Analysis Summary
Notes:
- 1) No attempt has been made to eliminate the non-significant decimal places.
- 2) This batgrbproduct analysis is done using the HEASARC data.
- 3) This batgrbproduct analysis is using the flight position for the mask-weighting calculation.
======================================================================
                  BAT GRB EVENT DATA PROCESSING REPORT
    Process Script Ver: batgrbproduct v2.46
    Process Start Time: Tue Jan 15 16:16:27 EST 2019
             Host Name: bat1
   Current Working Dir: /local/data/bat1/prebascript/trigger883832/GCN5_download_cron
======================================================================

  Trigger: 00883832      Segment: 000

  BAT Trigger Time: 569192245.44   [s; MET]
      Trigger Stop: 569192245.696   [s; MET]
               UTC: 2019-01-14T20:57:03.190000    [includes UTCF correction]
       Where From?: TDRSS position message

  BAT
    RA: 54.5096952529563   Dec: -26.938758821296  [deg; J2000]

     Catalogged Source?: NO
     Point Source?:      YES
     GRB Indicated?:     YES    [ by BAT flight software ]
     Image S/N Ratio:    25.36
     Image Trigger?:     NO
     Rate S/N Ratio:     255.998046867549  [ if not an image trigger ]
     Image S/N Ratio:    25.36

  Analysis Position:   [ source = BAT ]
    RA: 54.5096952529563   Dec: -26.938758821296  [deg; J2000]

  Refined Position:   [ source = BAT pre-slew burst ]
    RA: 54.502995751585   Dec: -26.9381939583958  [deg; J2000]
        { 03h 38m 00.7s , -26d 56' 17.5" }
         +/- 0.396807980535716 [arcmin] (estimated 90% radius based on SNR)
         +/- 0.128872026770839 [arcmin] (formal 1-sigma fit error)
    SNR: 113.91343664008

  Angular difference between the analysis and refined position is 0.359953 arcmin

  Partial Coding Fraction: 1.015625    [ including projection effects ]

  Duration
     T90: 361.459999918938 +/- 11.7360333432713
        Measured from: 0.288000106811523
                   to: 361.748000025749     [s; relative to TRIGTIME]
     T50: 49.0719999074936 +/- 1.47339065076633
        Measured from: 3.14400005340576
                   to: 52.2159999608994     [s; relative to TRIGTIME]


  Fluence
     Peak Flux  (peak 1 second)
        Measured from: 0.23199999332428
                   to: 1.23199999332428     [s; relative to TRIGTIME]
     Total Fluence
        Measured from: -6.60400009155273
                   to: 703.191999912262     [s; relative to TRIGTIME]

             Band 1     Band 2     Band 3     Band 4
              15-25      25-50     50-100    100-350     keV
 Total    41.600422  48.878760  36.983300  11.459671
           0.197109   0.209919   0.194058   0.178226 [error]
 Peak      2.324999   4.294172   4.863500   1.830169
           0.026597   0.036545   0.041352   0.033084 [error]

     [ fluence units of on-axis counts / fully illuminated detector ]

======================================================================


====== Table of the duration information =============================

        Value   tstart    tstop
T100  709.412   -6.604  702.808
T90   374.724    0.260  374.984
T50    55.648    3.684   59.332
Peak    1.000    0.232    1.232


====== Spectral Analysis Summary =====================================

Model      : spectral model: simple power-law (PL) and cutoff power-law (CPL)
Ph_index   : photon index: E^{Ph_index}
Ph_90err   : 90% error of the photon index
Epeak      : Epeak in keV
Epeak_90err: 90% error of Epeak
Norm       : normalization at 50 keV in both the PL model and CPL model
Nomr_90err : 90% error of the normalization
chi2       : Chi-Squared
dof        : degree of freedo

=== Time-averaged spectral analysis ===
(Best model with acceptable fit: N/A)

Model Ph_index Ph_90err_low Ph_90err_hi  Epeak  Epeak_90err_low  Epeak_90err_hi  Norm       Nomr_90err_low    Norm_90err_hi    chi2    dof
PL      -1.431    -0.024      0.025       -           -               -         1.21e-02     -1.58e-04          1.57e-04      90.470   57
CPL     -1.430    -0.022      0.028     9999.360    -9999.360      -9999.360      1.21e-02     -1.66e-04          1.31e-04      91.540   56


=== 1-s peak spectral analysis ===
(Best model with acceptable fit: PL)

Model Ph_index Ph_90err_low Ph_90err_hi  Epeak  Epeak_90err_low  Epeak_90err_hi  Norm       Nomr_90err_low    Norm_90err_hi    chi2    dof
PL      -0.886     -0.027     0.027       -           -               -         8.79e-01     -1.33e-02          1.32e-02      33.630   57
CPL     -0.807     -0.030     0.042      998.129    -998.129      -998.129      9.42e-01     -6.99e-02          -1.70e-02      37.310   56


=== Fluence/Peak Flux Summary ===

              Model    Band1     Band2     Band3     Band4     Band5     Total
                       15-25     25-50    50-100    100-350    15-150    15-350    keV
Fluence         PL   1.02e-05  1.96e-05  2.91e-05  9.29e-05  8.21e-05  1.52e-04   erg/cm2
      90%_error_low -3.18e-07 -3.57e-07 -3.45e-07 -2.78e-06 -9.51e-07 -2.71e-06   erg/cm2
      90%_error_hi   3.23e-07  3.57e-07  3.44e-07  2.84e-06  9.51e-07  2.76e-06   erg/cm2
Peak flux       PL   2.01e+01  2.93e+01  3.17e+01  6.41e+01  1.01e+02  1.45e+02   ph/cm2/s
      90%_error_low -6.91e-01 -6.08e-01 -4.39e-01 -2.02e+00 -1.52e+00 -2.13e+00   ph/cm2/s
      90%_error_hi   7.03e-01  6.08e-01  4.38e-01  2.07e+00  1.53e+00  2.15e+00   ph/cm2/s

Fluence        CPL   1.02e-05  1.96e-05  2.91e-05  9.25e-05  8.21e-05  1.52e-04   erg/cm2
      90%_error_low -3.18e-07 -3.57e-07 -3.46e-07    N/A    -9.45e-07    N/A      erg/cm2
      90%_error_hi   3.24e-07  3.58e-07  3.45e-07    N/A     9.51e-07    N/A      erg/cm2
Peak flux      CPL   9.17e+00  7.02e+00  3.77e+00  3.56e+00  2.14e+01  2.40e+01   ph/cm2/s
      90%_error_low -1.17e+00 -5.62e-01 -1.36e-01 -1.80e-01 -1.46e+00 -1.53e+00   ph/cm2/s
      90%_error_hi   6.24e-01  3.52e+00  2.92e-01  1.21e-01  2.22e+00  1.59e+00   ph/cm2/s

======================================================================
Image
Pre-slew 15.0-350.0 keV image (Event data)

#   RAcent    DECcent   POSerr    Theta     Phi              Peak Cts       SNR   Name
   54.5033   -26.9384   0.0017    14.4036    18.1966        66.6956702    114.973 TRIG_00883832

Foreground time interval of the image:
 -6.604   2.659 (delta_t =   9.263 [sec])
  3.560  14.061 (delta_t =  10.501 [sec])
Background time interval of the image:
-239.440  -6.604 (delta_t = 232.836 [sec])
Light Curves
Note: The mask-weighted lightcurves have units of either count/det or counts/sec/det, where a det is 0.4 x 0.4 = 0.16 sq cm.
Full-time range; 1 s binning
Other quick-look light curves:
- 64 ms binning (zoomed)
- 16 ms binning (zoomed)
- 8 ms binning (zoomed)
- 2 ms binning (zoomed)
- SN=5 or 10 s binning (full-time range)
- Raw light curve
Spectra
- 64 ms binning (zoomed)
- 16 ms binning (zoomed)
- 8 ms binning (zoomed)
- 2 ms binning (zoomed)
- SN=5 or 10 s binning (full-time range)
- Raw light curve
Spectra
Notes:
- 1) The fitting includes the systematic errors.
- 2) When the burst includes telescope slew time periods, the fitting uses an average response file made from multiple 5-s response files through out the slew time plus single time preiod for the non-slew times, and weighted by the total counts in the corresponding time period using addrmf. An average response file is needed becuase a spectral fit using the pre-slew DRM will introduce some errors in both a spectral shape and a normalization if the PHA file contains a lot of the slew/post-slew time interval.
- 3) For fits to more complicated models (e.g. a power-law over a cutoff power-law), the BAT team has decided to require a chi-square improvement of more than 6 for each extra dof.
Time averaged spectrum fit using the average DRM
Power-law model

Multiple GTIs in the spectrum
tstart tstop
-6.604000 652.170000
653.560000 703.192000

Spectral model in power-law:
------------------------------------------------------------
Parameters  : value       lower 90%   higher 90%
Photon index: -1.43068     ( -0.0244971   0.0245852 )
Norm@50keV  : 1.20664E-02    ( -0.000157982   0.000157165 )
------------------------------------------------------------
#Fit statistic : Chi-Squared =          90.47 using 59 PHA bins.
# Reduced chi-squared =          1.587 for     57 degrees of freedom
# Null hypothesis probability =   3.154757e-03

Photon flux (15-150 keV)    in 708.4 sec: 1.48005 ( -0.02461  0.02476 ) ph/cm2/s
Energy fluence (15-150 keV)             : 8.2105e-05 ( -9.51232e-07  9.50552e-07 ) ergs/cm2
Cutoff power-law model
Multiple GTIs in the spectrum
tstart tstop
-6.604000 652.170000
653.560000 703.192000
Spectral model in the cutoff power-law:
------------------------------------------------------------
Parameters  : value       lower 90%   higher 90%
Photon index: -1.42711     ( -0.0220235   0.0278178 )
Epeak [keV] : 1.00000E+04      ( -10000 -10000 )
Norm@50keV  : 1.21065E-02    ( -0.000157539   0.000139145 )
------------------------------------------------------------
#Fit statistic : Chi-Squared =          91.50 using 59 PHA bins.
# Reduced chi-squared =          1.634 for     56 degrees of freedom
# Null hypothesis probability =   1.930522e-03

Photon flux (15-150 keV)    in 708.4 sec: 1.47945 ( -0.0246  0.02479 ) ph/cm2/s
Energy fluence (15-150 keV)             : 8.2088e-05 ( -9.45445e-07  9.50347e-07 ) ergs/cm2
1-s peak spectrum fit
Power-law model
Time interval is from    0.232 sec. to    1.232 sec.

Spectral model in power-law:
------------------------------------------------------------
Parameters  : value       lower 90%   higher 90%
Photon index: -0.885755     ( -0.0265964   0.026708 )
Norm@50keV  : 0.878827    ( -0.0133008   0.013249 )
------------------------------------------------------------
#Fit statistic : Chi-Squared =          33.63 using 59 PHA bins.
# Reduced chi-squared =         0.5900 for     57 degrees of freedom
# Null hypothesis probability =   9.942009e-01

Photon flux (15-150 keV)    in 1 sec: 100.861 ( -1.5241  1.527 ) ph/cm2/s
Energy fluence (15-150 keV)             : 9.91882e-06 ( -1.39695e-07  1.39837e-07 ) ergs/cm2
Cutoff power-law model
Time interval is from    0.232 sec. to    1.232 sec.
Spectral model in the cutoff power-law:
------------------------------------------------------------
Parameters  : value       lower 90%   higher 90%
Photon index: -0.878389     ( -0.0295797   0.0424388 )
Epeak [keV] : 9995.92      ( -9996.34 -9996.34 )
Norm@50keV  : 0.884547    ( -0.0124028   0.0405339 )
------------------------------------------------------------
#Fit statistic : Chi-Squared =          33.85 using 59 PHA bins.
# Reduced chi-squared =         0.6044 for     56 degrees of freedom
# Null hypothesis probability =   9.916435e-01

Photon flux (15-150 keV)    in 1 sec: 21.3782 ( -1.4593  2.2153 ) ph/cm2/s
Energy fluence (15-150 keV)             : 9.92842e-06 ( -1.51096e-07  1.28616e-07 ) ergs/cm2
Time-resolved spectra

Distribution
T90 vs. Hardness ratio plot
T90                                   = N/A sec.
Hardness ratio (energy fluence ratio) = N/A
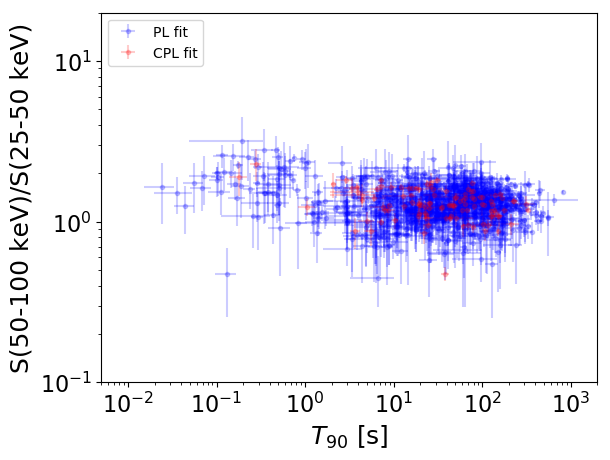
S(15-50 keV) vs. S(50-150 keV) plot
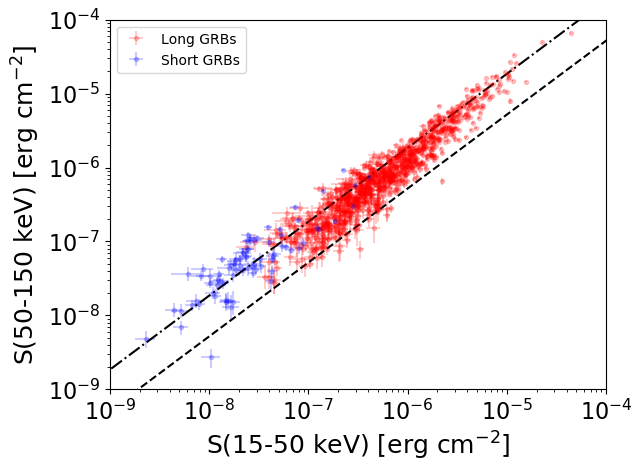
S(15-50 keV)  = N/A
S(50-150 keV) = N/A
The dash-dotted line and the dashed line traces the fluences calculated from the Band function with Epeak = 15 and 150 keV, respectively. Both lines assume a canonical values of alpha = -1 and beta = -2.5.
Mask shadow pattern
IMX = 2.439798759153241E-01, IMY = -8.020057465775930E-02
Spacecraft aspect plot
Bright source in the pre-burst/pre-slew/post-slew images
Pre-burst image of 15-350 keV band
Time interval of the image:
-239.440000 -6.604000

# RAcent  DECcent POSerr Theta    Phi  PeakCts   SNR AngSep     Name
#  [deg]    [deg]    ['] [deg]  [deg]                   [']
135.3289 -40.4880    4.0  54.0  164.0   3.6814   2.9    9.9	Vela X-1
 92.8125 -16.4756    3.7  35.2  105.3   1.9637   3.1 ------	UNKNOWN
  3.7229 -32.9037    2.9  47.0  -53.0   5.3257   4.1 ------	UNKNOWN
  7.3335 -78.1408    2.8  44.3 -118.1   5.2819   4.2 ------	UNKNOWN
  3.4306 -32.8098    3.9  47.2  -53.1   4.5263   3.3 ------	UNKNOWN
Pre-slew background subtracted image of 15-350 keV band
Time interval of the image:
-6.604000 2.659000
3.560000 14.060600

# RAcent  DECcent POSerr Theta    Phi  PeakCts   SNR AngSep     Name
#  [deg]    [deg]    ['] [deg]  [deg]                   [']
135.5543 -40.5299    7.4  54.2  164.2   5.2202   1.6    1.9	Vela X-1
 85.4393  -5.2585    2.9  40.2   85.0  11.2080   4.0 ------	UNKNOWN
 54.5033 -26.9384    0.1  14.4   18.2  66.6937 115.2 ------	UNKNOWN
129.0287 -53.0027    2.1  46.0  177.8   6.9877   5.5 ------	UNKNOWN
147.6879 -51.9368    1.8  57.1 -179.1  22.6655   6.6 ------	UNKNOWN
  7.9026 -11.6390    2.3  55.5  -27.5  12.8409   5.0 ------	UNKNOWN
Post-slew image of 15-350 keV band
Time interval of the image:
53.060600 625.660600

# RAcent  DECcent POSerr Theta    Phi  PeakCts   SNR AngSep     Name
#  [deg]    [deg]    ['] [deg]  [deg]                   [']
 68.1653  -9.3952    2.6  21.8   71.6   2.9120   4.5 ------	UNKNOWN
 39.1245  12.2651    2.8  41.9    9.8   3.6151   4.0 ------	UNKNOWN
 54.5056 -26.9383    0.2   0.0 -125.0  33.3329  60.8 ------	UNKNOWN
 29.3870  11.3239    3.0  45.4   -3.2   3.8987   3.8 ------	UNKNOWN