Analysis Summary
Notes:
- 1) No attempt has been made to eliminate the non-significant decimal places.
- 2) This batgrbproduct analysis is done using the HEASARC data.
- 3) This batgrbproduct analysis is using the flight position for the mask-weighting calculation.
======================================================================
BAT GRB EVENT DATA PROCESSING REPORT
Process Script Ver: batgrbproduct v2.46
Process Start Time: Sun Mar 17 22:41:43 EDT 2019
Host Name: bat1
Current Working Dir: /local/data/bat1/alien/Swift_3rdBATcatalog/event/batevent_reproc/trigger885314
======================================================================
Trigger: 00885314 Segment: 000
BAT Trigger Time: 569938775.488 [s; MET]
Trigger Stop: 569938783.68 [s; MET]
UTC: 2019-01-23T12:19:13.191160 [includes UTCF correction]
Where From?: TDRSS position message
BAT
RA: 53.2292503021484 Dec: 45.4840092707705 [deg; J2000]
Catalogged Source?: NO
Point Source?: YES
GRB Indicated?: YES [ by BAT flight software ]
Image S/N Ratio: 11.49
Image Trigger?: NO
Rate S/N Ratio: 16.5529453572468 [ if not an image trigger ]
Image S/N Ratio: 11.49
Analysis Position: [ source = BAT ]
RA: 53.2292503021484 Dec: 45.4840092707705 [deg; J2000]
Refined Position: [ source = BAT pre-slew burst ]
RA: 53.1781384919464 Dec: 45.5038450127407 [deg; J2000]
{ 03h 32m 42.8s , +45d 30' 13.8" }
+/- 1.73917822028068 [arcmin] (estimated 90% radius based on SNR)
+/- 0.802654670846529 [arcmin] (formal 1-sigma fit error)
SNR: 13.7965240610847
Angular difference between the analysis and refined position is 2.457178 arcmin
Partial Coding Fraction: 0.6484375 [ including projection effects ]
Duration
T90: 25.12399995327 +/- 4.06866118463902
Measured from: -0.340000033378601
to: 24.7839999198914 [s; relative to TRIGTIME]
T50: 11.432000041008 +/- 5.61054178216102
Measured from: 3.13599991798401
to: 14.567999958992 [s; relative to TRIGTIME]
Fluence
Peak Flux (peak 1 second)
Measured from: 4.8199999332428
to: 5.8199999332428 [s; relative to TRIGTIME]
Total Fluence
Measured from: -1.22000002861023
to: 27.6480000019073 [s; relative to TRIGTIME]
Band 1 Band 2 Band 3 Band 4
15-25 25-50 50-100 100-350 keV
Total 0.297741 0.289965 0.426653 0.170422
0.044572 0.046733 0.041814 0.037492 [error]
Peak 0.026388 0.029333 0.046083 0.022404
0.008875 0.009544 0.008614 0.007756 [error]
[ fluence units of on-axis counts / fully illuminated detector ]
======================================================================
====== Table of the duration information =============================
Value tstart tstop
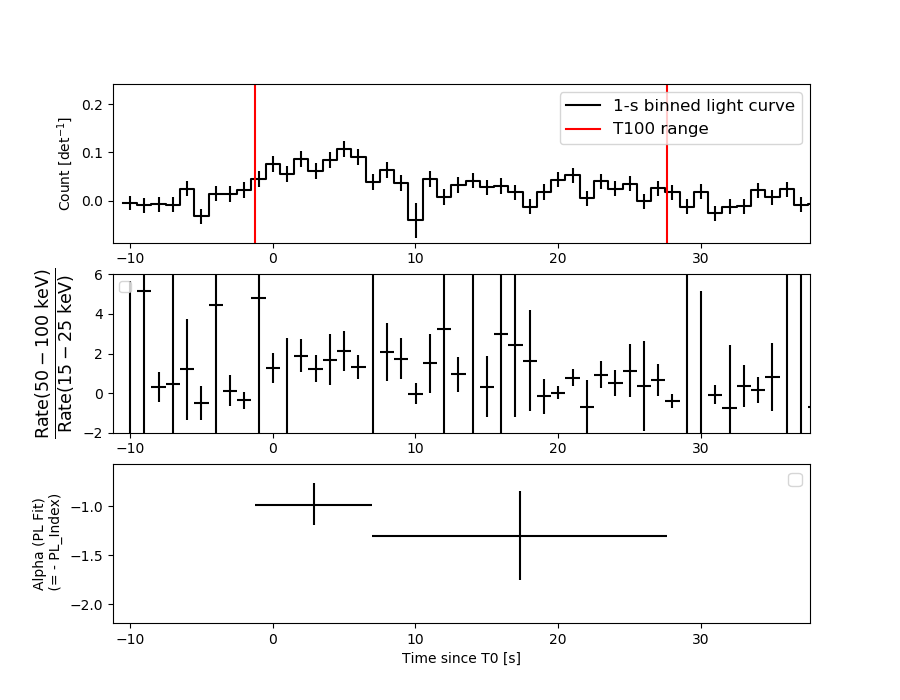
T100 28.868 -1.220 27.648
T90 25.124 -0.340 24.784
T50 11.432 3.136 14.568
Peak 1.000 4.820 5.820
====== Spectral Analysis Summary =====================================
Model : spectral model: simple power-law (PL) and cutoff power-law (CPL)
Ph_index : photon index: E^{Ph_index}
Ph_90err : 90% error of the photon index
Epeak : Epeak in keV
Epeak_90err: 90% error of Epeak
Norm : normalization at 50 keV in both the PL model and CPL model
Nomr_90err : 90% error of the normalization
chi2 : Chi-Squared
dof : degree of freedo
=== Time-averaged spectral analysis ===
(Best model with acceptable fit: PL)
Model Ph_index Ph_90err_low Ph_90err_hi Epeak Epeak_90err_low Epeak_90err_hi Norm Nomr_90err_low Norm_90err_hi chi2 dof
PL -1.105 -0.222 0.228 - - - 2.82e-03 -3.39e-04 3.37e-04 67.390 57
CPL -1.047 -0.280 0.662 978.755 -978.755 -978.755 2.99e-03 -4.87e-04 1.83e-04 67.520 56
=== 1-s peak spectral analysis ===
(Best model with acceptable fit: PL)
Model Ph_index Ph_90err_low Ph_90err_hi Epeak Epeak_90err_low Epeak_90err_hi Norm Nomr_90err_low Norm_90err_hi chi2 dof
PL -1.033 -0.398 0.432 - - - 8.59e-03 -1.94e-03 1.90e-03 70.060 57
CPL -1.037 -0.390 0.447 9999.360 -9999.360 -9999.360 8.64e-03 -1.90e-03 8.86e-02 70.060 56
=== Fluence/Peak Flux Summary ===
Model Band1 Band2 Band3 Band4 Band5 Total
15-25 25-50 50-100 100-350 15-150 15-350 keV
Fluence PL 6.99e-08 1.64e-07 3.05e-07 1.36e-06 8.26e-07 1.90e-06 erg/cm2
90%_error_low -1.72e-08 -2.47e-08 -4.12e-08 -3.90e-07 -1.05e-07 -4.14e-07 erg/cm2
90%_error_hi 1.87e-08 2.41e-08 4.05e-08 4.94e-07 1.06e-07 5.03e-07 erg/cm2
Peak flux PL 2.26e-01 3.01e-01 2.94e-01 5.15e-01 9.91e-01 1.34e+00 ph/cm2/s
90%_error_low -1.00e-01 -8.93e-02 -6.92e-02 -2.26e-01 -2.27e-01 -3.03e-01 ph/cm2/s
90%_error_hi 1.19e-01 8.57e-02 6.77e-02 3.28e-01 2.29e-01 3.20e-01 ph/cm2/s
Fluence CPL 6.99e-08 1.64e-07 3.05e-07 1.35e-06 8.26e-07 1.91e-06 erg/cm2
90%_error_low N/A N/A N/A N/A N/A -7.77e-07 erg/cm2
90%_error_hi N/A N/A N/A N/A N/A 2.05e-07 erg/cm2
Peak flux CPL 2.26e-01 3.00e-01 2.94e-01 5.12e-01 9.94e-01 1.41e+00 ph/cm2/s
90%_error_low N/A N/A N/A N/A N/A -6.13e-01 ph/cm2/s
90%_error_hi N/A N/A N/A N/A N/A 2.22e-01 ph/cm2/s
======================================================================
Image
Pre-slew 15.0-350.0 keV image (Event data)
#   RAcent    DECcent   POSerr    Theta     Phi              Peak Cts       SNR   Name
   53.1781    45.5038   0.0139    32.2354  -145.9780         1.2520171     13.797 TRIG_00885314

Foreground time interval of the image:
 -1.220   9.693 (delta_t =  10.913 [sec])
 10.512  27.648 (delta_t =  17.136 [sec])
Background time interval of the image:
-239.488  -1.220 (delta_t = 238.268 [sec])
Light Curves
Note: The mask-weighted lightcurves have units of either count/det or counts/sec/det, where a det is 0.4 x 0.4 = 0.16 sq cm.
Full-time range; 1 s binning
Other quick-look light curves:
- 64 ms binning (zoomed)
- 16 ms binning (zoomed)
- 8 ms binning (zoomed)
- 2 ms binning (zoomed)
- SN=5 or 10 s binning (full-time range)
- Raw light curve
Spectra
- 64 ms binning (zoomed)
- 16 ms binning (zoomed)
- 8 ms binning (zoomed)
- 2 ms binning (zoomed)
- SN=5 or 10 s binning (full-time range)
- Raw light curve
Spectra
Notes:
- 1) The fitting includes the systematic errors.
- 2) When the burst includes telescope slew time periods, the fitting uses an average response file made from multiple 5-s response files through out the slew time plus single time preiod for the non-slew times, and weighted by the total counts in the corresponding time period using addrmf. An average response file is needed becuase a spectral fit using the pre-slew DRM will introduce some errors in both a spectral shape and a normalization if the PHA file contains a lot of the slew/post-slew time interval.
- 3) For fits to more complicated models (e.g. a power-law over a cutoff power-law), the BAT team has decided to require a chi-square improvement of more than 6 for each extra dof.
Time averaged spectrum fit using the average DRM
Power-law model
Multiple GTIs in the spectrum
tstart tstop
-1.220000 9.692800
10.512000 27.648000

Spectral model in power-law:
------------------------------------------------------------
Parameters  : value       lower 90%   higher 90%
Photon index: -1.10513     ( -0.221544   0.228256 )
Norm@50keV  : 2.82237E-03    ( -0.000338988   0.000337253 )
------------------------------------------------------------
#Fit statistic : Chi-Squared =          67.39 using 59 PHA bins.
# Reduced chi-squared =          1.182 for     57 degrees of freedom
# Null hypothesis probability =   1.632208e-01

Photon flux (15-150 keV)    in 28.05 sec: 0.327541 ( -0.041039  0.041221 ) ph/cm2/s
Energy fluence (15-150 keV)             : 8.26462e-07 ( -1.05251e-07  1.05724e-07 ) ergs/cm2
Cutoff power-law model

Multiple GTIs in the spectrum
tstart tstop
-1.220000 9.692800
10.512000 27.648000
Spectral model in the cutoff power-law:
------------------------------------------------------------
Parameters  : value       lower 90%   higher 90%
Photon index: -1.09976     ( -0.279882   0.662126 )
Epeak [keV] : 1.00000E+04      ( -10000 -10000 )
Norm@50keV  : 2.83720E-03    ( -0.000335495   0.00033419 )
------------------------------------------------------------
#Fit statistic : Chi-Squared =          67.40 using 59 PHA bins.
# Reduced chi-squared =          1.204 for     56 degrees of freedom
# Null hypothesis probability =   1.414137e-01

Photon flux (15-150 keV)    in 28.05 sec: 0.327491 (    ) ph/cm2/s
Energy fluence (15-150 keV)             : 8.26232e-07 ( 0  0 ) ergs/cm2
1-s peak spectrum fit
Power-law model
Time interval is from    4.820 sec. to    5.820 sec.

Spectral model in power-law:
------------------------------------------------------------
Parameters  : value       lower 90%   higher 90%
Photon index: -1.03264     ( -0.397828   0.4321 )
Norm@50keV  : 8.58752E-03    ( -0.00193645   0.00189989 )
------------------------------------------------------------
#Fit statistic : Chi-Squared =          70.06 using 59 PHA bins.
# Reduced chi-squared =          1.229 for     57 degrees of freedom
# Null hypothesis probability =   1.147281e-01

Photon flux (15-150 keV)    in 1 sec: 0.990598 ( -0.227207  0.229162 ) ph/cm2/s
Energy fluence (15-150 keV)             : 9.18206e-08 ( -2.11596e-08  2.131e-08 ) ergs/cm2
Cutoff power-law model

Time interval is from    4.820 sec. to    5.820 sec.
Spectral model in the cutoff power-law:
------------------------------------------------------------
Parameters  : value       lower 90%   higher 90%
Photon index: -1.03746     ( -0.39381   0.443417 )
Epeak [keV] : 9999.36      ( -9999.36 -9999.36 )
Norm@50keV  : 8.63779E-03    ( -0.00189561   0.0886436 )
------------------------------------------------------------
#Fit statistic : Chi-Squared =          70.06 using 59 PHA bins.
# Reduced chi-squared =          1.251 for     56 degrees of freedom
# Null hypothesis probability =   9.795309e-02

Photon flux (15-150 keV)    in 1 sec: 0.994170 (    ) ph/cm2/s
Energy fluence (15-150 keV)             : 9.20556e-08 ( -2.28916e-08  2.15527e-08 ) ergs/cm2
Time-resolved spectra
Distribution
T90 vs. Hardness ratio plot
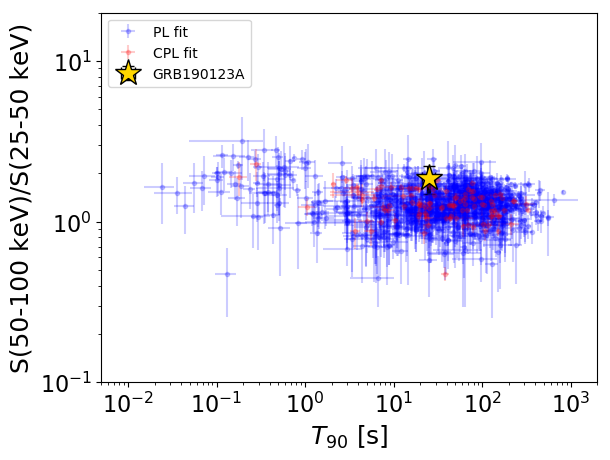
T90                                   = 25.124 sec.
Hardness ratio (energy fluence ratio) = 1.85951527896
S(15-50 keV) vs. S(50-150 keV) plot
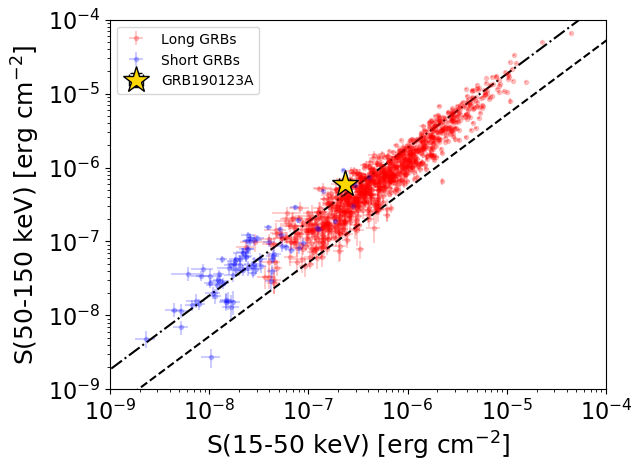
S(15-50 keV)  = 2.3370263e-07
S(50-150 keV) = 5.927521e-07
The dash-dotted line and the dashed line traces the fluences calculated from the Band function with Epeak = 15 and 150 keV, respectively. Both lines assume a canonical values of alpha = -1 and beta = -2.5.
Mask shadow pattern
IMX = -5.226531001837519E-01, IMY = 3.528256816859616E-01
Spacecraft aspect plot
Bright source in the pre-burst/pre-slew/post-slew images
Pre-burst image of 15-350 keV band
Time interval of the image:
-239.488000 -1.220000

# RAcent  DECcent POSerr Theta    Phi  PeakCts   SNR AngSep     Name
#  [deg]    [deg]    ['] [deg]  [deg]                   [']
 83.6475  21.9908    0.6  40.9  156.5  11.1228  18.4    1.6	Crab
181.4623  36.4153    3.7  53.6   28.2   4.7584   3.2 ------	UNKNOWN
178.1023  43.5447    2.2  46.5   25.0   2.8736   5.2 ------	UNKNOWN
170.1979  55.2734    3.0  34.7   17.3   1.2708   3.8 ------	UNKNOWN
212.8069  54.8316    2.4  52.1   -7.4   2.7019   4.8 ------	UNKNOWN
 40.8546  61.4472    1.1  28.7 -111.8   3.8489  10.1 ------	UNKNOWN
 38.9306  23.5383    2.5  56.7 -151.7   6.3624   4.5 ------	UNKNOWN
288.3833  72.2319    3.0  47.0  -53.1   4.8549   3.9 ------	UNKNOWN
Pre-slew background subtracted image of 15-350 keV band
Time interval of the image:
-1.220000 9.692800
10.512000 27.648000

# RAcent  DECcent POSerr Theta    Phi  PeakCts   SNR AngSep     Name
#  [deg]    [deg]    ['] [deg]  [deg]                   [']
 83.6314  22.1866    0.0  40.7  156.6   0.2322   1.5   10.3	Crab
203.2849  46.3102    2.4  55.5    4.8   1.2184   4.8 ------	UNKNOWN
 53.1781  45.5039    0.8  32.2 -146.0   1.2520  13.8 ------	UNKNOWN
256.8515  71.1147    2.2  47.0  -39.6   0.9262   5.2 ------	UNKNOWN
Post-slew image of 15-350 keV band
Time interval of the image:
103.612600 250.412600

# RAcent  DECcent POSerr Theta    Phi  PeakCts   SNR AngSep     Name
#  [deg]    [deg]    ['] [deg]  [deg]                   [']
 83.6246  22.0089    0.8  34.1  125.3   5.7059  14.2    0.6	Crab
 67.6785  -8.5435    2.3  55.6  164.6   5.8810   5.1 ------	UNKNOWN
248.8052  82.8651    2.5  51.4   -0.4   1.7548   4.6 ------	UNKNOWN
 40.9104  61.4380    0.8  17.5  -17.9   2.5281  13.9 ------	UNKNOWN