Analysis Summary
Notes:
- 1) No attempt has been made to eliminate the non-significant decimal places.
- 2) This batgrbproduct analysis is done using the HEASARC data.
- 3) This batgrbproduct analysis is using the flight position for the mask-weighting calculation.
======================================================================
BAT GRB EVENT DATA PROCESSING REPORT
Process Script Ver: batgrbproduct v2.46
Process Start Time: Sun Mar 17 22:27:41 EDT 2019
Host Name: bat1
Current Working Dir: /local/data/bat1/alien/Swift_3rdBATcatalog/event/batevent_reproc/trigger888648
======================================================================
Trigger: 00888648 Segment: 000
BAT Trigger Time: 571596907.136 [s; MET]
Trigger Stop: 571596909.184 [s; MET]
UTC: 2019-02-11T16:54:44.735040 [includes UTCF correction]
Where From?: TDRSS position message
BAT
RA: 196.67538854469 Dec: 41.9660247246067 [deg; J2000]
Catalogged Source?: NO
Point Source?: YES
GRB Indicated?: YES [ by BAT flight software ]
Image S/N Ratio: 6.93
Image Trigger?: NO
Rate S/N Ratio: 9.16515138991168 [ if not an image trigger ]
Image S/N Ratio: 6.93
Analysis Position: [ source = BAT ]
RA: 196.67538854469 Dec: 41.9660247246067 [deg; J2000]
Refined Position: [ source = BAT pre-slew burst ]
RA: 196.651839434863 Dec: 41.9686001671772 [deg; J2000]
{ 13h 06m 36.4s , +41d 58' 07.0" }
+/- 2.4082520685682 [arcmin] (estimated 90% radius based on SNR)
+/- 1.12611541339411 [arcmin] (formal 1-sigma fit error)
SNR: 8.66622362410689
Angular difference between the analysis and refined position is 1.061867 arcmin
Partial Coding Fraction: 0.2617188 [ including projection effects ]
Duration
T90: 10.8960000276566 +/- 1.54339884541641
Measured from: -9.44000005722046
to: 1.4559999704361 [s; relative to TRIGTIME]
T50: 7.27999997138977 +/- 3.10916066829362
Measured from: -6.5440000295639
to: 0.735999941825867 [s; relative to TRIGTIME]
Fluence
Peak Flux (peak 1 second)
Measured from: 0.564000010490417
to: 1.56400001049042 [s; relative to TRIGTIME]
Total Fluence
Measured from: -9.75999999046326
to: 1.66399991512299 [s; relative to TRIGTIME]
Band 1 Band 2 Band 3 Band 4
15-25 25-50 50-100 100-350 keV
Total 0.202334 0.282970 0.231516 0.139260
0.049711 0.050967 0.045443 0.040626 [error]
Peak 0.070087 0.059704 0.085217 0.020614
0.015647 0.017049 0.015913 0.012892 [error]
[ fluence units of on-axis counts / fully illuminated detector ]
======================================================================
====== Table of the duration information =============================
Value tstart tstop
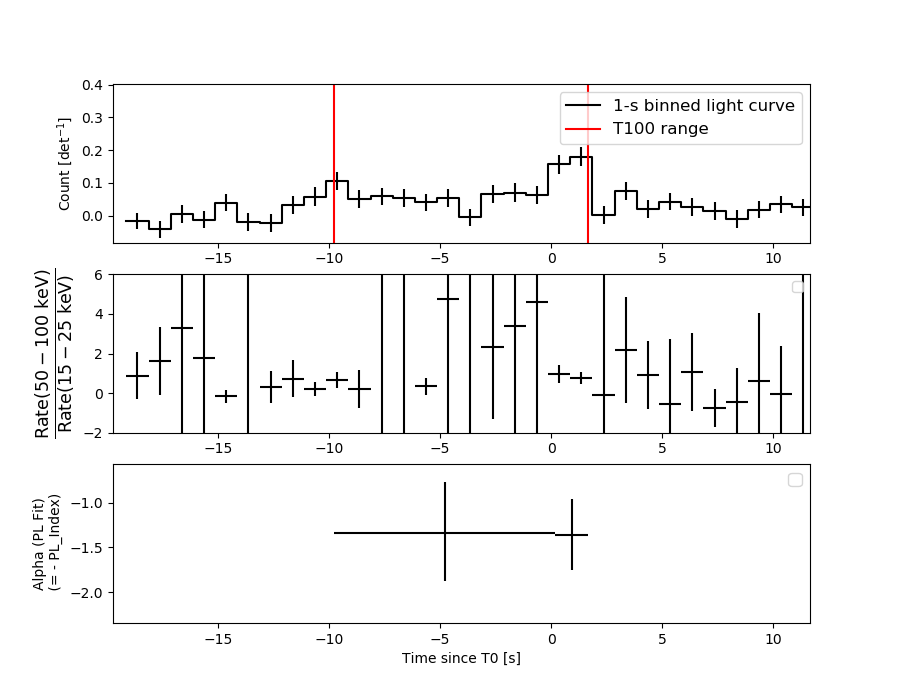
T100 11.424 -9.760 1.664
T90 10.896 -9.440 1.456
T50 7.280 -6.544 0.736
Peak 1.000 0.564 1.564
====== Spectral Analysis Summary =====================================
Model : spectral model: simple power-law (PL) and cutoff power-law (CPL)
Ph_index : photon index: E^{Ph_index}
Ph_90err : 90% error of the photon index
Epeak : Epeak in keV
Epeak_90err: 90% error of Epeak
Norm : normalization at 50 keV in both the PL model and CPL model
Nomr_90err : 90% error of the normalization
chi2 : Chi-Squared
dof : degree of freedo
=== Time-averaged spectral analysis ===
(Best model with acceptable fit: PL)
Model Ph_index Ph_90err_low Ph_90err_hi Epeak Epeak_90err_low Epeak_90err_hi Norm Nomr_90err_low Norm_90err_hi chi2 dof
PL -1.317 -0.368 0.380 - - - 5.15e-03 -9.19e-04 9.19e-04 64.210 57
CPL -1.328 -2.527 -0.607 9999.360 N/A N/A 5.17e-03 N/A N/A 64.230 56
=== 1-s peak spectral analysis ===
(Best model with acceptable fit: PL)
Model Ph_index Ph_90err_low Ph_90err_hi Epeak Epeak_90err_low Epeak_90err_hi Norm Nomr_90err_low Norm_90err_hi chi2 dof
PL -1.182 -0.438 0.456 - - - 1.62e-02 -3.51e-03 3.44e-03 54.520 57
CPL -1.224 -0.399 0.510 9999.360 -9999.360 -9999.360 1.61e-02 -3.27e-03 -1.61e-02 54.580 56
=== Fluence/Peak Flux Summary ===
Model Band1 Band2 Band3 Band4 Band5 Total
15-25 25-50 50-100 100-350 15-150 15-350 keV
Fluence PL 6.33e-08 1.30e-07 2.09e-07 7.50e-07 5.79e-07 1.15e-06 erg/cm2
90%_error_low -2.32e-08 -2.93e-08 -4.72e-08 -3.34e-07 -1.13e-07 -3.65e-07 erg/cm2
90%_error_hi 2.60e-08 2.75e-08 4.50e-08 4.93e-07 1.13e-07 4.99e-07 erg/cm2
Peak flux PL 4.92e-01 5.98e-01 5.27e-01 7.99e-01 1.90e+00 2.42e+00 ph/cm2/s
90%_error_low -2.22e-01 -1.78e-01 -1.29e-01 -3.77e-01 -4.38e-01 -5.19e-01 ph/cm2/s
90%_error_hi 2.64e-01 1.64e-01 1.21e-01 5.39e-01 4.38e-01 5.30e-01 ph/cm2/s
Fluence CPL 4.93e-08 1.30e-07 1.94e-07 7.76e-07 2.19e-07 1.12e-06 erg/cm2
90%_error_low N/A -3.11e-08 -3.28e-08 -4.63e-07 N/A -3.81e-07 erg/cm2
90%_error_hi N/A 2.87e-08 5.96e-08 5.90e-07 N/A 5.22e-07 erg/cm2
Peak flux CPL 4.92e-01 6.04e-01 5.26e-01 8.16e-01 1.90e+00 2.38e+00 ph/cm2/s
90%_error_low N/A -1.93e-01 N/A N/A -4.41e-01 -4.81e-01 ph/cm2/s
90%_error_hi N/A 1.66e-01 N/A N/A 4.36e-01 5.50e-01 ph/cm2/s
======================================================================
Image
Pre-slew 15.0-350.0 keV image (Event data)
#   RAcent    DECcent   POSerr    Theta     Phi              Peak Cts       SNR   Name
  196.6518    41.9686   0.0222    42.0614  -132.2798         0.9446369      8.666 TRIG_00888648

Foreground time interval of the image:
 -9.760   1.664 (delta_t =  11.424 [sec])
Background time interval of the image:
-157.635  -9.760 (delta_t = 147.875 [sec])
Light Curves
Note: The mask-weighted lightcurves have units of either count/det or counts/sec/det, where a det is 0.4 x 0.4 = 0.16 sq cm.
Full-time range; 1 s binning
Other quick-look light curves:
- 64 ms binning (zoomed)
- 16 ms binning (zoomed)
- 8 ms binning (zoomed)
- 2 ms binning (zoomed)
- SN=5 or 10 s binning (full-time range)
- Raw light curve
Spectra
- 64 ms binning (zoomed)
- 16 ms binning (zoomed)
- 8 ms binning (zoomed)
- 2 ms binning (zoomed)
- SN=5 or 10 s binning (full-time range)
- Raw light curve
Spectra
Notes:
- 1) The fitting includes the systematic errors.
- 2) When the burst includes telescope slew time periods, the fitting uses an average response file made from multiple 5-s response files through out the slew time plus single time preiod for the non-slew times, and weighted by the total counts in the corresponding time period using addrmf. An average response file is needed becuase a spectral fit using the pre-slew DRM will introduce some errors in both a spectral shape and a normalization if the PHA file contains a lot of the slew/post-slew time interval.
- 3) For fits to more complicated models (e.g. a power-law over a cutoff power-law), the BAT team has decided to require a chi-square improvement of more than 6 for each extra dof.
Time averaged spectrum fit using the average DRM
Power-law model
Time interval is from   -9.760 sec. to    1.664 sec.

Spectral model in power-law:
------------------------------------------------------------
Parameters  : value       lower 90%   higher 90%
Photon index: -1.31699     ( -0.367829   0.380114 )
Norm@50keV  : 5.15187E-03    ( -0.000919366   0.000919191 )
------------------------------------------------------------
#Fit statistic : Chi-Squared =          64.21 using 59 PHA bins.
# Reduced chi-squared =          1.126 for     57 degrees of freedom
# Null hypothesis probability =   2.387345e-01

Photon flux (15-150 keV)    in 11.42 sec: 0.616585 ( -0.119643  0.120003 ) ph/cm2/s
Energy fluence (15-150 keV)             : 5.79104e-07 ( -1.12738e-07  1.13056e-07 ) ergs/cm2
Cutoff power-law model
Time interval is from   -9.760 sec. to    1.664 sec.
Spectral model in the cutoff power-law:
------------------------------------------------------------
Parameters  : value       lower 90%   higher 90%
Photon index: -2.58759     ( -1.266   0.654064 )
Epeak [keV] : 191.353      (   )
Norm@50keV  : 1.14735E-03    (     )
------------------------------------------------------------
#Fit statistic : Chi-Squared =          61.69 using 59 PHA bins.
# Reduced chi-squared =          1.102 for     56 degrees of freedom
# Null hypothesis probability =   2.800006e-01

Photon flux (15-150 keV)    in 11.42 sec: 0.210089 ( -0.135509  0.182435 ) ph/cm2/s
Energy fluence (15-150 keV)             : 2.18805e-07 ( 0  0 ) ergs/cm2
1-s peak spectrum fit
Power-law model
Time interval is from    0.564 sec. to    1.564 sec.

Spectral model in power-law:
------------------------------------------------------------
Parameters  : value       lower 90%   higher 90%
Photon index: -1.18223     ( -0.438047   0.45594 )
Norm@50keV  : 1.61868E-02    ( -0.00351224   0.00343833 )
------------------------------------------------------------
#Fit statistic : Chi-Squared =          54.52 using 59 PHA bins.
# Reduced chi-squared =         0.9565 for     57 degrees of freedom
# Null hypothesis probability =   5.686573e-01

Photon flux (15-150 keV)    in 1 sec: 1.89529 ( -0.43825  0.43816 ) ph/cm2/s
Energy fluence (15-150 keV)             : 1.65082e-07 ( -3.74322e-08  3.72059e-08 ) ergs/cm2
Cutoff power-law model

Time interval is from    0.564 sec. to    1.564 sec.
Spectral model in the cutoff power-law:
------------------------------------------------------------
Parameters  : value       lower 90%   higher 90%
Photon index: -1.18174     ( -0.401707   0.507366 )
Epeak [keV] : 1.00000E+04      ( -10000 -10000 )
Norm@50keV  : 1.62703E-02    ( -0.00341924   -0.0162702 )
------------------------------------------------------------
#Fit statistic : Chi-Squared =          54.55 using 59 PHA bins.
# Reduced chi-squared =         0.9740 for     56 degrees of freedom
# Null hypothesis probability =   5.300679e-01

Photon flux (15-150 keV)    in 1 sec: 1.89729 ( -0.44078  0.43587 ) ph/cm2/s
Energy fluence (15-150 keV)             : 1.64892e-07 ( -3.73216e-08  3.7368e-08 ) ergs/cm2
Time-resolved spectra
Distribution
T90 vs. Hardness ratio plot
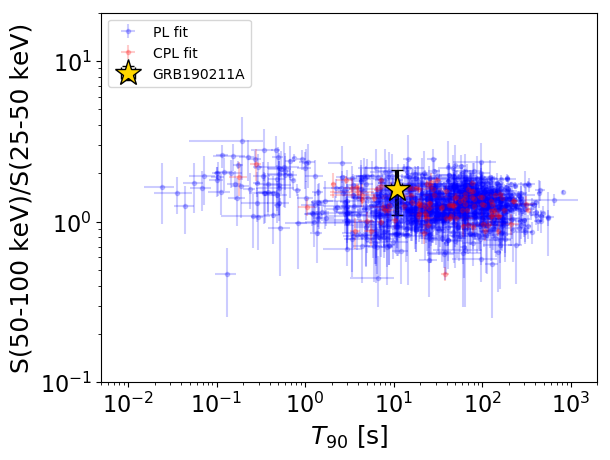
T90                                   = 10.896 sec.
Hardness ratio (energy fluence ratio) = 1.60568452733
S(15-50 keV) vs. S(50-150 keV) plot
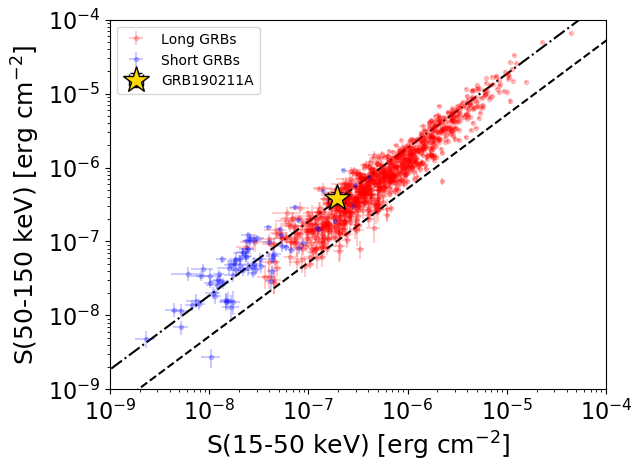
S(15-50 keV)  = 1.9340474e-07
S(50-150 keV) = 3.857001e-07
The dash-dotted line and the dashed line traces the fluences calculated from the Band function with Epeak = 15 and 150 keV, respectively. Both lines assume a canonical values of alpha = -1 and beta = -2.5.
Mask shadow pattern
IMX = -6.070552152356010E-01, IMY = 6.676171462328306E-01
Spacecraft aspect plot
Bright source in the pre-burst/pre-slew/post-slew images
Pre-burst image of 15-350 keV band
Time interval of the image:
-157.635400 -9.760000

# RAcent  DECcent POSerr Theta    Phi  PeakCts   SNR AngSep     Name
#  [deg]    [deg]    ['] [deg]  [deg]                   [']
125.7408   6.7196    2.3  40.4  103.3   4.0930   4.9 ------	UNKNOWN
139.5220 -32.2466    3.2  48.9   44.4   3.2218   3.6 ------	UNKNOWN
185.5962 -22.7606    3.3  37.1  -16.2   0.8675   3.5 ------	UNKNOWN
Pre-slew background subtracted image of 15-350 keV band
Time interval of the image:
-9.760000 1.664000

# RAcent  DECcent POSerr Theta    Phi  PeakCts   SNR AngSep     Name
#  [deg]    [deg]    ['] [deg]  [deg]                   [']
196.6527  41.9691    1.3  42.1 -132.3   0.9463   8.7 ------	UNKNOWN
Post-slew image of 15-350 keV band
Time interval of the image:
180.364600 962.993000

# RAcent  DECcent POSerr Theta    Phi  PeakCts   SNR AngSep     Name
#  [deg]    [deg]    ['] [deg]  [deg]                   [']
208.3439 -13.6792    3.0  56.7    3.0   9.9849   3.9 ------	UNKNOWN
189.2589  84.6124    2.4  42.7 -164.4   6.0298   4.7 ------	UNKNOWN
226.1379  31.8718    2.7  25.5  -59.7   3.4298   4.3 ------	UNKNOWN
241.1902  50.8025    3.4  31.4 -105.2   3.6663   3.4 ------	UNKNOWN
238.6447   8.0985    3.0  50.1  -43.1  11.9882   3.8 ------	UNKNOWN