Analysis Summary
Notes:
- 1) No attempt has been made to eliminate the non-significant decimal places.
- 2) This batgrbproduct analysis is done using the HEASARC data.
- 3) This batgrbproduct analysis is using the flight position for the mask-weighting calculation.
======================================================================
                  BAT GRB EVENT DATA PROCESSING REPORT
    Process Script Ver: batgrbproduct v2.46
    Process Start Time: Thu Mar 21 13:35:48 EDT 2019
             Host Name: bat1
   Current Working Dir: /local/data/bat1/alien/Swift_3rdBATcatalog/event/batevent_reproc/trigger889748
======================================================================

  Trigger: 00889748      Segment: 000

  BAT Trigger Time: 572297960.448   [s; MET]
      Trigger Stop: 572297964.544   [s; MET]
               UTC: 2019-02-19T19:38:58.002900    [includes UTCF correction]
       Where From?: TDRSS position message

  BAT
    RA: 189.757083789005   Dec: 76.6139916242753  [deg; J2000]

     Catalogged Source?: NO
     Point Source?:      YES
     GRB Indicated?:     YES    [ by BAT flight software ]
     Image S/N Ratio:    10.13
     Image Trigger?:     NO
     Rate S/N Ratio:     8.54400374531753  [ if not an image trigger ]
     Image S/N Ratio:    10.13

  Analysis Position:   [ source = BAT ]
    RA: 189.757083789005   Dec: 76.6139916242753  [deg; J2000]

  Refined Position:   [ source = BAT pre-slew burst ]
    RA: 189.689543805993   Dec: 76.6071023927069  [deg; J2000]
        { 12h 38m 45.5s , +76d 36' 25.6" }
         +/- 1.63188274752761 [arcmin] (estimated 90% radius based on SNR)
         +/- 0.720827480316864 [arcmin] (formal 1-sigma fit error)
    SNR: 15.1104368914486

  Angular difference between the analysis and refined position is 1.025414 arcmin

  Partial Coding Fraction: 0.765625    [ including projection effects ]

  Duration
     T90: 167.739999890327 +/- 12.7941918627511
        Measured from: -89.3319998979568
                   to: 78.4079999923706     [s; relative to TRIGTIME]
     T50: 62.5080000162125 +/- 2.4526133393256
        Measured from: 3.68400001525879
                   to: 66.1920000314713     [s; relative to TRIGTIME]


  Fluence
     Peak Flux  (peak 1 second)
        Measured from: 65.5240000486374
                   to: 66.5240000486374     [s; relative to TRIGTIME]
     Total Fluence
        Measured from: -105.740000009537
                   to: 88.4960000514984     [s; relative to TRIGTIME]

             Band 1     Band 2     Band 3     Band 4
              15-25      25-50     50-100    100-350     keV
 Total     3.146041   2.930655   1.261988   0.279404
           0.108649   0.112020   0.095600   0.083857 [error]
 Peak      0.092585   0.088123   0.029180   0.007747
           0.008226   0.008302   0.006664   0.005296 [error]

     [ fluence units of on-axis counts / fully illuminated detector ]

======================================================================


====== Table of the duration information =============================

        Value   tstart    tstop
T100  194.236 -105.740   88.496
T90   167.740  -89.332   78.408
T50    62.508    3.684   66.192
Peak    1.000   65.524   66.524


====== Spectral Analysis Summary =====================================

Model      : spectral model: simple power-law (PL) and cutoff power-law (CPL)
Ph_index   : photon index: E^{Ph_index}
Ph_90err   : 90% error of the photon index
Epeak      : Epeak in keV
Epeak_90err: 90% error of Epeak
Norm       : normalization at 50 keV in both the PL model and CPL model
Nomr_90err : 90% error of the normalization
chi2       : Chi-Squared
dof        : degree of freedo

=== Time-averaged spectral analysis ===
(Best model with acceptable fit: PL)

Model Ph_index Ph_90err_low Ph_90err_hi  Epeak  Epeak_90err_low  Epeak_90err_hi  Norm       Nomr_90err_low    Norm_90err_hi    chi2    dof
PL      -2.214    -0.105      0.102       -           -               -         2.08e-03     -1.32e-04          1.30e-04      49.040   57
CPL     -2.213    -0.107      0.100     10000.000    -10000.000      -10000.000      2.08e-03     -1.01e-04          1.28e-04      49.060   56


=== 1-s peak spectral analysis ===
(Best model with acceptable fit: PL)

Model Ph_index Ph_90err_low Ph_90err_hi  Epeak  Epeak_90err_low  Epeak_90err_hi  Norm       Nomr_90err_low    Norm_90err_hi    chi2    dof
PL      -2.119     -0.212     0.199       -           -               -         1.12e-02     -1.66e-03          1.62e-03      60.530   57
CPL     -1.648     -0.414     1.165       28.683      N/A           N/A         2.18e-02        N/A               N/A         59.740   56


=== Fluence/Peak Flux Summary ===

              Model    Band1     Band2     Band3     Band4     Band5     Total
                       15-25     25-50    50-100    100-350    15-150    15-350    keV
Fluence         PL   1.01e-06  1.21e-06  1.04e-06  1.53e-06  3.80e-06  4.79e-06   erg/cm2
      90%_error_low -7.55e-08 -5.85e-08 -9.22e-08 -2.58e-07 -2.06e-07 -3.59e-07   erg/cm2
      90%_error_hi   7.72e-08  5.85e-08  9.36e-08  2.94e-07  2.08e-07  3.83e-07   erg/cm2
Peak flux       PL   8.35e-01  5.84e-01  2.69e-01  1.73e-01  1.77e+00  1.86e+00   ph/cm2/s
      90%_error_low -1.21e-01 -6.44e-02 -5.15e-02 -5.51e-02 -1.92e-01 -2.04e-01   ph/cm2/s
      90%_error_hi   1.24e-01  6.42e-02  5.28e-02  6.91e-02  1.92e-01  2.04e-01   ph/cm2/s

Fluence        CPL   9.65e-07  1.25e-06  1.02e-06  7.60e-07  3.64e-06  4.00e-06   erg/cm2
      90%_error_low -8.82e-08 -7.12e-08 -1.04e-07 -3.55e-07 -2.51e-07 -4.55e-07   erg/cm2
      90%_error_hi   8.58e-08  7.47e-08  1.02e-07  5.09e-07  2.54e-07  6.47e-07   erg/cm2
Peak flux      CPL   8.14e-01  6.20e-01  2.60e-01  8.19e-02  1.75e+00  1.78e+00   ph/cm2/s
      90%_error_low -1.31e-01 -8.44e-02 -6.96e-02 -8.19e-02 -1.97e-01 -2.13e-01   ph/cm2/s
      90%_error_hi   1.30e-01  9.76e-02  5.87e-02  1.74e-01  1.96e-01  2.41e-01   ph/cm2/s

======================================================================
Image
Pre-slew 15.0-350.0 keV image (Event data)
#   RAcent    DECcent   POSerr    Theta     Phi              Peak Cts       SNR   Name
  189.6895    76.6071   0.0127    26.9185  -142.9218         3.9692595     15.110 TRIG_00889748

Foreground time interval of the image:
-105.740  35.653 (delta_t = 141.393 [sec])
Background time interval of the image:
-239.448 -105.740 (delta_t = 133.708 [sec])
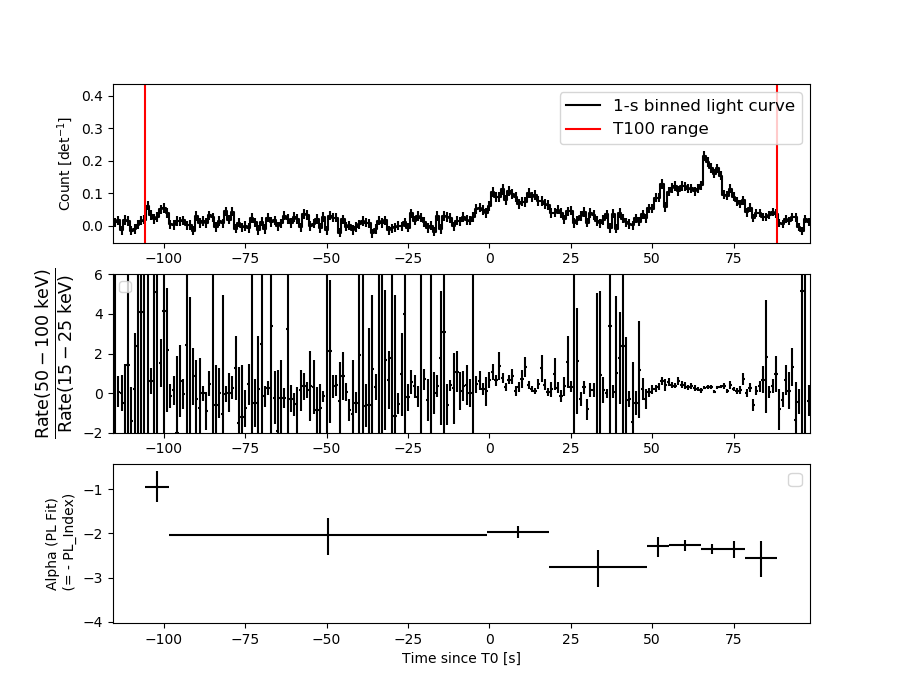
Light Curves
Note: The mask-weighted lightcurves have units of either count/det or counts/sec/det, where a det is 0.4 x 0.4 = 0.16 sq cm.
Full-time range; 1 s binning
Other quick-look light curves:
- 64 ms binning (zoomed)
- 16 ms binning (zoomed)
- 8 ms binning (zoomed)
- 2 ms binning (zoomed)
- SN=5 or 10 s binning (full-time range)
- Raw light curve
Spectra
- 64 ms binning (zoomed)
- 16 ms binning (zoomed)
- 8 ms binning (zoomed)
- 2 ms binning (zoomed)
- SN=5 or 10 s binning (full-time range)
- Raw light curve
Spectra
Notes:
- 1) The fitting includes the systematic errors.
- 2) When the burst includes telescope slew time periods, the fitting uses an average response file made from multiple 5-s response files through out the slew time plus single time preiod for the non-slew times, and weighted by the total counts in the corresponding time period using addrmf. An average response file is needed becuase a spectral fit using the pre-slew DRM will introduce some errors in both a spectral shape and a normalization if the PHA file contains a lot of the slew/post-slew time interval.
- 3) For fits to more complicated models (e.g. a power-law over a cutoff power-law), the BAT team has decided to require a chi-square improvement of more than 6 for each extra dof.
Time averaged spectrum fit using the average DRM
Power-law model

Time interval is from -105.740 sec. to   88.496 sec.

Spectral model in power-law:
------------------------------------------------------------
Parameters  : value       lower 90%   higher 90%
Photon index: -2.21422     ( -0.104605   0.101869 )
Norm@50keV  : 2.07737E-03    ( -0.000131507   0.000129997 )
------------------------------------------------------------
#Fit statistic : Chi-Squared =          49.04 using 59 PHA bins.
# Reduced chi-squared =         0.8603 for     57 degrees of freedom
# Null hypothesis probability =   7.643119e-01

Photon flux (15-150 keV)    in 194.2 sec: 0.346542 ( -0.017456  0.017498 ) ph/cm2/s
Energy fluence (15-150 keV)             : 3.80154e-06 ( -2.06042e-07  2.08041e-07 ) ergs/cm2
Cutoff power-law model
Time interval is from -105.740 sec. to   88.496 sec.
Spectral model in the cutoff power-law:
------------------------------------------------------------
Parameters  : value       lower 90%   higher 90%
Photon index: -2.21264     ( -0.106925   0.100277 )
Epeak [keV] : 1.00000E+04      ( -10000 -10000 )
Norm@50keV  : 2.07761E-03    ( -0.000100578   0.000128894 )
------------------------------------------------------------
#Fit statistic : Chi-Squared =          49.06 using 59 PHA bins.
# Reduced chi-squared =         0.8760 for     56 degrees of freedom
# Null hypothesis probability =   7.329545e-01

Photon flux (15-150 keV)    in 194.2 sec: 0.337678 ( -0.019312  0.019189 ) ph/cm2/s
Energy fluence (15-150 keV)             : 3.6384e-06 ( -2.5113e-07  2.5393e-07 ) ergs/cm2
1-s peak spectrum fit
Power-law model
Time interval is from   65.524 sec. to   66.524 sec.

Spectral model in power-law:
------------------------------------------------------------
Parameters  : value       lower 90%   higher 90%
Photon index: -2.11879     ( -0.212409   0.19907 )
Norm@50keV  : 1.11586E-02    ( -0.00166147   0.00162228 )
------------------------------------------------------------
#Fit statistic : Chi-Squared =          60.53 using 59 PHA bins.
# Reduced chi-squared =          1.062 for     57 degrees of freedom
# Null hypothesis probability =   3.497084e-01

Photon flux (15-150 keV)    in 1 sec: 1.77215 ( -0.19172  0.19171 ) ph/cm2/s
Energy fluence (15-150 keV)             : 1.03891e-07 ( -1.37069e-08  1.40025e-08 ) ergs/cm2
Cutoff power-law model
Time interval is from   65.524 sec. to   66.524 sec.
Spectral model in the cutoff power-law:
------------------------------------------------------------
Parameters  : value       lower 90%   higher 90%
Photon index: -1.64772     ( -0.415662   1.16296 )
Epeak [keV] : 28.6833      (   )
Norm@50keV  : 2.17512E-02    (     )
------------------------------------------------------------
#Fit statistic : Chi-Squared =          59.74 using 59 PHA bins.
# Reduced chi-squared =          1.067 for     56 degrees of freedom
# Null hypothesis probability =   3.414947e-01

Photon flux (15-150 keV)    in 1 sec: 1.75036 ( -0.19661  0.19624 ) ph/cm2/s
Energy fluence (15-150 keV)             : 0 ( 0  0 ) ergs/cm2
Time-resolved spectra
Distribution
T90 vs. Hardness ratio plot
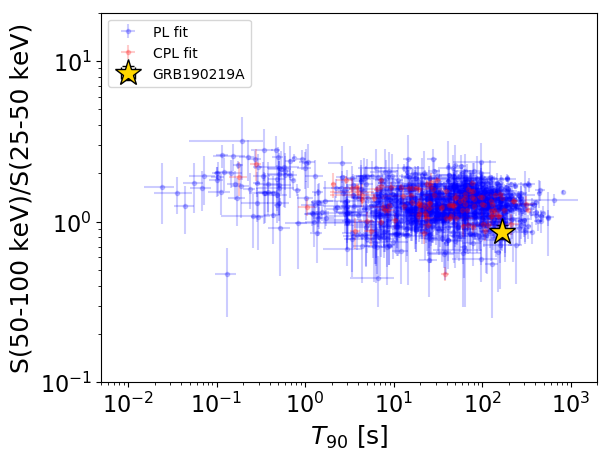
T90                                   = 167.74 sec.
Hardness ratio (energy fluence ratio) = 0.862064339389
S(15-50 keV) vs. S(50-150 keV) plot
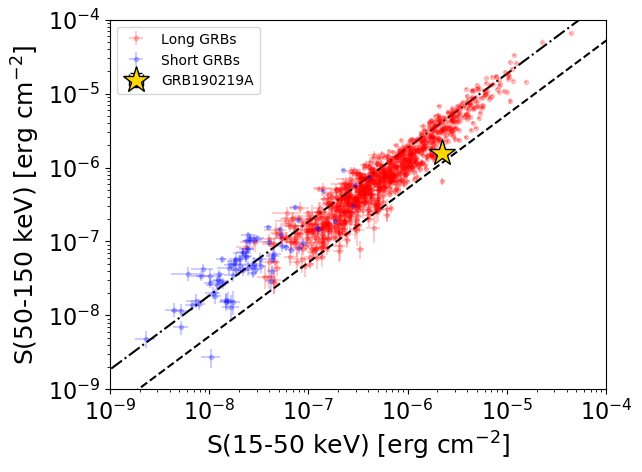
S(15-50 keV)  = 2.219624e-06
S(50-150 keV) = 1.5819619e-06
The dash-dotted line and the dashed line traces the fluences calculated from the Band function with Epeak = 15 and 150 keV, respectively. Both lines assume a canonical values of alpha = -1 and beta = -2.5.
Mask shadow pattern
IMX = -4.050769346816848E-01, IMY = 3.061155258480396E-01
Spacecraft aspect plot
Bright source in the pre-burst/pre-slew/post-slew images
Pre-burst image of 15-350 keV band
Time interval of the image:
-239.448000 -105.740000

# RAcent  DECcent POSerr Theta    Phi  PeakCts   SNR AngSep     Name
#  [deg]    [deg]    ['] [deg]  [deg]                   [']
Pre-slew background subtracted image of 15-350 keV band
Time interval of the image:
-105.740000 35.652590

# RAcent  DECcent POSerr Theta    Phi  PeakCts   SNR AngSep     Name
#  [deg]    [deg]    ['] [deg]  [deg]                   [']
189.6895  76.6071    0.8  26.9 -142.9   3.9688  15.1 ------	UNKNOWN
Post-slew image of 15-350 keV band
Time interval of the image:
89.652610 962.711300

# RAcent  DECcent POSerr Theta    Phi  PeakCts   SNR AngSep     Name
#  [deg]    [deg]    ['] [deg]  [deg]                   [']
254.4200  35.3473    5.0  49.9  -23.5   3.4155   2.3    1.9	Her X-1
227.4583  25.8679    2.6  53.9    8.0   8.4344   4.3 ------	UNKNOWN
272.6815  39.5012    3.1  50.2  -43.2  11.8160   3.8 ------	UNKNOWN