Analysis Summary
Notes:
- 1) No attempt has been made to eliminate the non-significant decimal places.
- 2) This batgrbproduct analysis is done using the HEASARC data.
- 3) This batgrbproduct analysis is using the flight position for the mask-weighting calculation.
======================================================================
                  BAT GRB EVENT DATA PROCESSING REPORT
    Process Script Ver: batgrbproduct v2.46
    Process Start Time: Wed Apr 10 23:53:00 EDT 2019
             Host Name: bat1
   Current Working Dir: /local/data/bat1/alien/Swift_3rdBATcatalog/event/batevent_reproc/trigger895006
======================================================================

  Trigger: 00895006      Segment: 000

  BAT Trigger Time: 575278551.544   [s; MET]
      Trigger Stop: 575278551.576   [s; MET]
               UTC: 2019-03-26T07:35:28.910940    [includes UTCF correction]
       Where From?: (*SHORT BURST*) TDRSS scaled map message

  BAT
    RA: 341.652491920313   Dec: 39.9026483879093  [deg; J2000]

     Catalogged Source?: NO
     Point Source?:      YES
     GRB Indicated?:     YES    [ by BAT flight software ]
     Image S/N Ratio:    10.57
     Image Trigger?:     NO
     Rate S/N Ratio:     44.8330235429198  [ if not an image trigger ]
     Image S/N Ratio:    10.57

  Analysis Position:   [ source = BAT ]
    RA: 341.652491920313   Dec: 39.9026483879093  [deg; J2000]

  Refined Position:   [ source = BAT pre-slew burst ]
    RA: 341.651025472315   Dec: 39.9149191655983  [deg; J2000]
        { 22h 46m 36.2s , +39d 54' 53.7" }
         +/- 1.56044711839257 [arcmin] (estimated 90% radius based on SNR)
         +/- 0.576350421507955 [arcmin] (formal 1-sigma fit error)
    SNR: 16.1082477519168

  Angular difference between the analysis and refined position is 0.739334 arcmin

  Partial Coding Fraction: 0.578125    [ including projection effects ]

  Duration
     T90: 0.0759999752044678 +/- 0.0322489854521138
        Measured from: 0
                   to: 0.0759999752044678     [s; relative to TRIGTIME]
     T50: 0.0279998779296875 +/- 0.00894431669225064
        Measured from: 0.00800001621246338
                   to: 0.0359998941421509     [s; relative to TRIGTIME]


  Fluence
     Peak Flux  (peak 1 second)
        Measured from: -0.445999979972839
                   to: 0.554000020027161     [s; relative to TRIGTIME]
     Total Fluence
        Measured from: 0
                   to: 0.103999972343445     [s; relative to TRIGTIME]

             Band 1     Band 2     Band 3     Band 4
              15-25      25-50     50-100    100-350     keV
 Total     0.055873   0.068781   0.040450   0.007587
           0.006472   0.007054   0.005874   0.004044 [error]
 Peak      0.051182   0.076510   0.047490  -0.002898
           0.011340   0.011838   0.010709   0.009100 [error]

     [ fluence units of on-axis counts / fully illuminated detector ]

======================================================================


====== Table of the duration information =============================

        Value   tstart    tstop
T100    0.104    0.000    0.104
T90     0.076    0.000    0.076
T50     0.028    0.008    0.036
Peak    1.000   -0.446    0.554


====== Spectral Analysis Summary =====================================

Model      : spectral model: simple power-law (PL) and cutoff power-law (CPL)
Ph_index   : photon index: E^{Ph_index}
Ph_90err   : 90% error of the photon index
Epeak      : Epeak in keV
Epeak_90err: 90% error of Epeak
Norm       : normalization at 50 keV in both the PL model and CPL model
Nomr_90err : 90% error of the normalization
chi2       : Chi-Squared
dof        : degree of freedo

=== Time-averaged spectral analysis ===
(Best model with acceptable fit: N/A)

Model Ph_index Ph_90err_low Ph_90err_hi  Epeak  Epeak_90err_low  Epeak_90err_hi  Norm       Nomr_90err_low    Norm_90err_hi    chi2    dof
PL      -3.249     N/A       N/A          -           -               -         2.74e-02        N/A               N/A        144.210   57
CPL     -1.000     N/A        N/A          80.000      N/A           N/A         1.54e-02        N/A               N/A        243.360   56


=== 1-s peak spectral analysis ===
(Best model with acceptable fit: N/A)

Model Ph_index Ph_90err_low Ph_90err_hi  Epeak  Epeak_90err_low  Epeak_90err_hi  Norm       Nomr_90err_low    Norm_90err_hi    chi2    dof
PL      -1.870     -0.310     0.288       -           -               -         1.12e-02     -2.46e-03          2.41e-03      72.150   57
CPL      0.387     -1.485     2.021       43.394      -8.603        14.137      2.31e-01     -2.31e-01          3.39e+00      64.460   56


=== Fluence/Peak Flux Summary ===

              Model    Band1     Band2     Band3     Band4     Band5     Total
                       15-25     25-50    50-100    100-350    15-150    15-350    keV
Fluence         PL   1.94e-08  1.26e-08  5.29e-09  3.04e-09  3.88e-08  4.03e-08   erg/cm2
      90%_error_low    N/A       N/A       N/A       N/A       N/A       N/A      erg/cm2
      90%_error_hi     N/A       N/A       N/A       N/A       N/A       N/A      erg/cm2
Peak flux       PL   6.57e-01  5.31e-01  2.90e-01  2.33e-01  1.58e+00  1.71e+00   ph/cm2/s
      90%_error_low -1.64e-01 -9.95e-02 -7.88e-02 -1.00e-01 -2.97e-01 -3.24e-01   ph/cm2/s
      90%_error_hi   1.71e-01  9.95e-02  8.08e-02  1.36e-01  2.97e-01  3.25e-01   ph/cm2/s

Fluence        CPL    N/A      N/A      N/A      N/A      N/A      N/A      erg/cm2
      90%_error_low    N/A       N/A       N/A       N/A       N/A       N/A      erg/cm2
      90%_error_hi     N/A       N/A       N/A       N/A       N/A       N/A      erg/cm2
Peak flux      CPL   5.39e-01  6.84e-01  2.76e-01  2.38e-02  1.52e+00  1.52e+00   ph/cm2/s
      90%_error_low -1.90e-01 -1.39e-01 -1.11e-01 -2.38e-02 -2.92e-01 -2.93e-01   ph/cm2/s
      90%_error_hi   1.95e-01  1.45e-01  1.07e-01  7.81e-02  2.95e-01  2.98e-01   ph/cm2/s

======================================================================
Image
Pre-slew 15.0-350.0 keV image (Event data)
#   RAcent    DECcent   POSerr    Theta     Phi              Peak Cts       SNR   Name
  341.6510    39.9149   0.0120    39.5739   -14.5923         0.1795208     16.108 TRIG_00895006

Foreground time interval of the image:
  0.000   0.104 (delta_t =   0.104 [sec])
Background time interval of the image:
-351.843 -334.937 (delta_t =  16.906 [sec])
-239.544   0.000 (delta_t = 239.544 [sec])
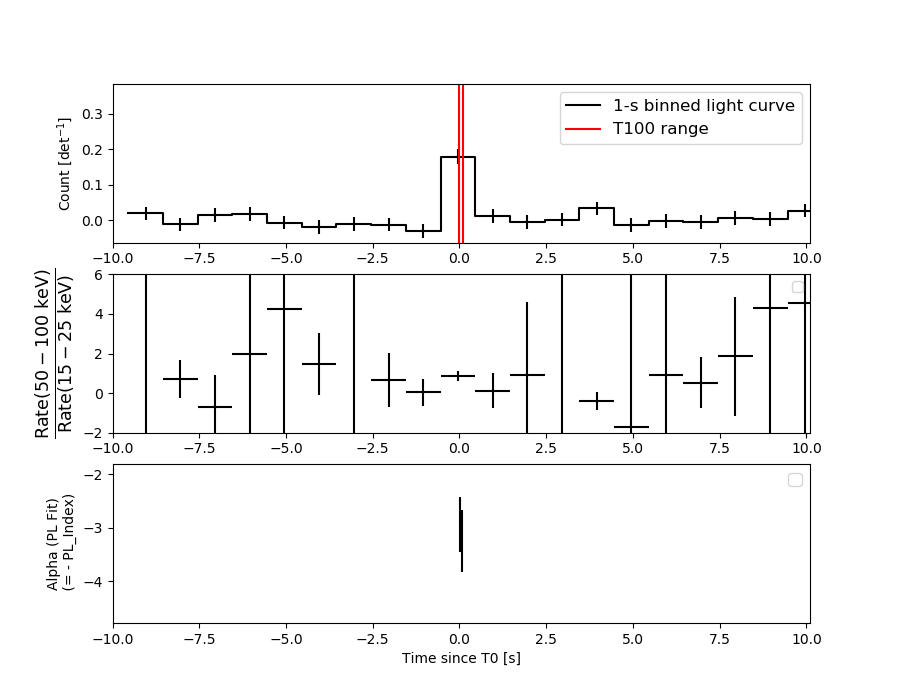
Light Curves
Note: The mask-weighted lightcurves have units of either count/det or counts/sec/det, where a det is 0.4 x 0.4 = 0.16 sq cm.
Full-time range; 1 s binning
Other quick-look light curves:
- 64 ms binning (zoomed)
- 16 ms binning (zoomed)
- 8 ms binning (zoomed)
- 2 ms binning (zoomed)
- SN=5 or 10 s binning (full-time range)
- Raw light curve
Spectra
- 64 ms binning (zoomed)
- 16 ms binning (zoomed)
- 8 ms binning (zoomed)
- 2 ms binning (zoomed)
- SN=5 or 10 s binning (full-time range)
- Raw light curve
Spectra
Notes:
- 1) The fitting includes the systematic errors.
- 2) When the burst includes telescope slew time periods, the fitting uses an average response file made from multiple 5-s response files through out the slew time plus single time preiod for the non-slew times, and weighted by the total counts in the corresponding time period using addrmf. An average response file is needed becuase a spectral fit using the pre-slew DRM will introduce some errors in both a spectral shape and a normalization if the PHA file contains a lot of the slew/post-slew time interval.
- 3) For fits to more complicated models (e.g. a power-law over a cutoff power-law), the BAT team has decided to require a chi-square improvement of more than 6 for each extra dof.
Time averaged spectrum fit using the average DRM
Power-law model
Time interval is from    0.000 sec. to    0.104 sec.

Spectral model in power-law:
------------------------------------------------------------
Parameters  : value       lower 90%   higher 90%
Photon index: -3.24856     (       )
Norm@50keV  : 2.73723E-02    (     )
------------------------------------------------------------
#Fit statistic : Chi-Squared =         144.21 using 59 PHA bins.
# Reduced chi-squared =         2.5300 for     57 degrees of freedom
# Null hypothesis probability =   1.672380e-09

Photon flux (15-150 keV)    in 0.104 sec: 9.07451 (    ) ph/cm2/s
Energy fluence (15-150 keV)             : 3.8752e-08 ( 0  0 ) ergs/cm2
Cutoff power-law model
Time interval is from    0.000 sec. to    0.104 sec.
Spectral model in the cutoff power-law:
------------------------------------------------------------
Parameters  : value       lower 90%   higher 90%
Photon index: -1     (       )
Epeak [keV] : 80.0000      (   )
Norm@50keV  : 1.54089E-02    (     )
------------------------------------------------------------
#Fit statistic : Chi-Squared =         243.36 using 59 PHA bins.
# Reduced chi-squared =         4.3457 for     56 degrees of freedom
# Null hypothesis probability =   3.364000e-25

Photon flux (15-150 keV)    in 0.104 sec:  (    ) ph/cm2/s
Energy fluence (15-150 keV)             : 0 ( 0  0 ) ergs/cm2
1-s peak spectrum fit
Power-law model
Time interval is from   -0.446 sec. to    0.554 sec.

Spectral model in power-law:
------------------------------------------------------------
Parameters  : value       lower 90%   higher 90%
Photon index: -1.87041     ( -0.308556   0.289077 )
Norm@50keV  : 1.11688E-02    ( -0.00245377   0.00240909 )
------------------------------------------------------------
#Fit statistic : Chi-Squared =          72.15 using 59 PHA bins.
# Reduced chi-squared =          1.266 for     57 degrees of freedom
# Null hypothesis probability =   8.516119e-02

Photon flux (15-150 keV)    in 1 sec: 1.58322 ( -0.29677  0.29691 ) ph/cm2/s
Energy fluence (15-150 keV)             : 1.02664e-07 ( -2.20389e-08  2.26588e-08 ) ergs/cm2
Cutoff power-law model
Time interval is from   -0.446 sec. to    0.554 sec.
Spectral model in the cutoff power-law:
------------------------------------------------------------
Parameters  : value       lower 90%   higher 90%
Photon index: 0.38742     ( -1.48512   2.02076 )
Epeak [keV] : 43.3943      ( -8.60296 14.1375 )
Norm@50keV  : 0.230669    ( -0.230669   3.38991 )
------------------------------------------------------------
#Fit statistic : Chi-Squared =          64.46 using 59 PHA bins.
# Reduced chi-squared =          1.151 for     56 degrees of freedom
# Null hypothesis probability =   2.047230e-01

Photon flux (15-150 keV)    in 1 sec: 1.52119 ( -0.2925  0.295 ) ph/cm2/s
Energy fluence (15-150 keV)             : 8.87503e-08 ( -1.94891e-08  2.21748e-08 ) ergs/cm2
Time-resolved spectra
Distribution
T90 vs. Hardness ratio plot

T90                                   = N/A sec.
Hardness ratio (energy fluence ratio) = N/A
S(15-50 keV) vs. S(50-150 keV) plot
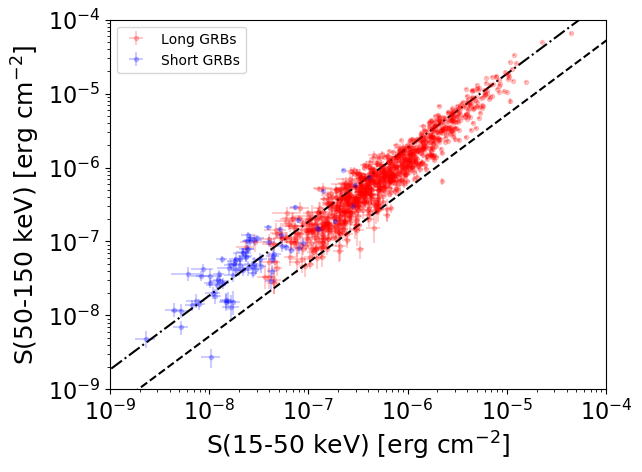
S(15-50 keV)  = N/A
S(50-150 keV) = N/A
The dash-dotted line and the dashed line traces the fluences calculated from the Band function with Epeak = 15 and 150 keV, respectively. Both lines assume a canonical values of alpha = -1 and beta = -2.5.
Mask shadow pattern
IMX = 7.998433717839682E-01, IMY = 2.082295522740699E-01
Spacecraft aspect plot

Bright source in the pre-burst/pre-slew/post-slew images
Pre-burst image of 15-350 keV band
Time interval of the image:
-351.843400 -334.937100
-239.544000 0.000000

# RAcent  DECcent POSerr Theta    Phi  PeakCts   SNR AngSep     Name
#  [deg]    [deg]    ['] [deg]  [deg]                   [']
 83.6073  21.9928    0.9  45.1  162.8  10.2915  13.5    1.9	Crab
326.3953  38.2872    7.4  51.0   -9.5  -0.9664  -1.5   10.7	Cyg X-2
 96.3749  60.0496    2.5  40.0  103.9   4.9018   4.6 ------	UNKNOWN
 88.3170  19.9163    2.3  49.8  161.1   5.4120   5.1 ------	UNKNOWN
 64.5239  47.9431    2.3  21.0  127.0   1.6339   5.0 ------	UNKNOWN
350.1789  60.2563    2.8  32.0   19.4   1.5924   4.2 ------	UNKNOWN
 62.6467  34.7084    2.3  22.8  162.9   1.5297   4.9 ------	UNKNOWN
339.3138  29.1895    2.3  46.3  -27.2   2.6556   5.1 ------	UNKNOWN
 32.9953  -0.7212    2.6  43.7 -115.9   5.6769   4.4 ------	UNKNOWN
Pre-slew background subtracted image of 15-350 keV band
Time interval of the image:
0.000000 0.104000

# RAcent  DECcent POSerr Theta    Phi  PeakCts   SNR AngSep     Name
#  [deg]    [deg]    ['] [deg]  [deg]                   [']
 83.6334  22.0150   13.5  45.1  162.7  -0.0159  -0.9    0.0	Crab
325.9376  38.3748    0.0  51.2   -9.2  -0.0325  -1.6   11.5	Cyg X-2
 17.2820  67.0547    1.8  26.0   45.1   0.0718   6.6 ------	UNKNOWN
 79.0866   7.9303    3.1  51.9 -179.7   0.0796   3.8 ------	UNKNOWN
341.6510  39.9149    0.7  39.6  -14.6   0.1795  16.1 ------	UNKNOWN
320.3241  30.4833    2.8  59.3  -14.4   0.2274   4.1 ------	UNKNOWN
Post-slew image of 15-350 keV band
Time interval of the image:
389.856600 654.306000
660.456000 962.593200

# RAcent  DECcent POSerr Theta    Phi  PeakCts   SNR AngSep     Name
#  [deg]    [deg]    ['] [deg]  [deg]                   [']
 88.3581  -9.6220    2.4  49.8   24.8   7.0446   4.9 ------	UNKNOWN
 77.0968   2.5569    2.5  55.3    5.1   8.4508   4.7 ------	UNKNOWN
338.4550 -49.2486    2.7  45.7 -149.2   4.1933   4.3 ------	UNKNOWN