Analysis Summary
Notes:
- 1) No attempt has been made to eliminate the non-significant decimal places.
- 2) This batgrbproduct analysis is done using the HEASARC data.
- 3) This batgrbproduct analysis is using the flight position for the mask-weighting calculation.
======================================================================
                  BAT GRB EVENT DATA PROCESSING REPORT
    Process Script Ver: batgrbproduct v2.46
    Process Start Time: Mon May 20 17:24:09 EDT 2019
             Host Name: bat1
   Current Working Dir: /local/data/bat1/alien/Swift_3rdBATcatalog/event/batevent_reproc/trigger895813
======================================================================

  Trigger: 00895813      Segment: 000

  BAT Trigger Time: 575691300.232   [s; MET]
      Trigger Stop: 575691300.296   [s; MET]
               UTC: 2019-03-31T02:14:37.572780    [includes UTCF correction]
       Where From?: (*SHORT BURST*) TDRSS scaled map message

  BAT
    RA: 28.5761909565301   Dec: 27.6194435216332  [deg; J2000]

     Catalogged Source?: NO
     Point Source?:      YES
     GRB Indicated?:     YES    [ by BAT flight software ]
     Image S/N Ratio:    8.8
     Image Trigger?:     NO
     Rate S/N Ratio:     26.0192236625154  [ if not an image trigger ]
     Image S/N Ratio:    8.8

  Analysis Position:   [ source = BAT ]
    RA: 28.5761909565301   Dec: 27.6194435216332  [deg; J2000]

  Refined Position:   [ source = BAT pre-slew burst ]
    RA: 28.5725445814888   Dec: 27.6354154966189  [deg; J2000]
        { 01h 54m 17.4s , +27d 38' 07.5" }
         +/- 1.38159534240199 [arcmin] (estimated 90% radius based on SNR)
         +/- 0.628515946292495 [arcmin] (formal 1-sigma fit error)
    SNR: 19.1678893461

  Angular difference between the analysis and refined position is 0.977726 arcmin

  Partial Coding Fraction: 0.828125    [ including projection effects ]

  Duration
     T90: 4.33599984645844 +/- 0.234776531617368
        Measured from: -0.00399994850158691
                   to: 4.33199989795685     [s; relative to TRIGTIME]
     T50: 1.17599999904633 +/- 1.06831647465854
        Measured from: 0.23199999332428
                   to: 1.40799999237061     [s; relative to TRIGTIME]


  Fluence
     Peak Flux  (peak 1 second)
        Measured from: -0.0559999942779541
                   to: 0.944000005722046     [s; relative to TRIGTIME]
     Total Fluence
        Measured from: -0.0559999942779541
                   to: 4.50399994850159     [s; relative to TRIGTIME]

             Band 1     Band 2     Band 3     Band 4
              15-25      25-50     50-100    100-350     keV
 Total     0.165040   0.243238   0.199876   0.072919
           0.017556   0.019320   0.017939   0.016065 [error]
 Peak      0.084624   0.122249   0.114848   0.033056
           0.009503   0.010236   0.009855   0.008047 [error]

     [ fluence units of on-axis counts / fully illuminated detector ]

======================================================================


====== Table of the duration information =============================

        Value   tstart    tstop
T100    4.560   -0.056    4.504
T90     4.336   -0.004    4.332
T50     1.176    0.232    1.408
Peak    1.000   -0.056    0.944


====== Spectral Analysis Summary =====================================

Model      : spectral model: simple power-law (PL) and cutoff power-law (CPL)
Ph_index   : photon index: E^{Ph_index}
Ph_90err   : 90% error of the photon index
Epeak      : Epeak in keV
Epeak_90err: 90% error of Epeak
Norm       : normalization at 50 keV in both the PL model and CPL model
Nomr_90err : 90% error of the normalization
chi2       : Chi-Squared
dof        : degree of freedo

=== Time-averaged spectral analysis ===
(Best model with acceptable fit: PL)

Model Ph_index Ph_90err_low Ph_90err_hi  Epeak  Epeak_90err_low  Epeak_90err_hi  Norm       Nomr_90err_low    Norm_90err_hi    chi2    dof
PL      -1.242    -0.150      0.151       -           -               -         9.77e-03     -8.35e-04          8.33e-04      47.270   57
CPL     -1.164    -0.215      0.577      535.688    -535.688      -535.688      1.07e-02     -3.35e-03          9.58e-03      47.220   56


=== 1-s peak spectral analysis ===
(Best model with acceptable fit: PL)

Model Ph_index Ph_90err_low Ph_90err_hi  Epeak  Epeak_90err_low  Epeak_90err_hi  Norm       Nomr_90err_low    Norm_90err_hi    chi2    dof
PL      -1.140     -0.149     0.151       -           -               -         2.36e-02     -2.02e-03          2.02e-03      41.820   57
CPL     -1.034     -0.181     0.569      486.027    -486.027      -486.027      2.66e-02     -4.71e-03          2.23e-02      41.700   56


=== Fluence/Peak Flux Summary ===

              Model    Band1     Band2     Band3     Band4     Band5     Total
                       15-25     25-50    50-100    100-350    15-150    15-350    keV
Fluence         PL   4.47e-08  9.62e-08  1.63e-07  6.32e-07  4.47e-07  9.35e-07   erg/cm2
      90%_error_low -6.78e-09 -8.97e-09 -1.75e-08 -1.38e-07 -4.36e-08 -1.52e-07   erg/cm2
      90%_error_hi   7.05e-09  8.88e-09  1.74e-08  1.63e-07  4.41e-08  1.74e-07   erg/cm2
Peak flux       PL   6.89e-01  8.59e-01  7.80e-01  1.23e+00  2.75e+00  3.56e+00   ph/cm2/s
      90%_error_low -1.11e-01 -8.69e-02 -7.84e-02 -2.45e-01 -2.40e-01 -3.31e-01   ph/cm2/s
      90%_error_hi   1.17e-01  8.57e-02  7.76e-02  2.82e-01  2.40e-01  3.39e-01   ph/cm2/s

Fluence        CPL   4.41e-08  9.70e-08  1.64e-07  5.56e-07  4.44e-07  8.61e-07   erg/cm2
      90%_error_low -7.89e-09 -9.58e-09 -1.79e-08 -3.14e-07 -4.81e-08 -3.15e-07   erg/cm2
      90%_error_hi   6.85e-09  1.06e-08  1.90e-08  1.13e-07  4.37e-08  3.15e-07   erg/cm2
Peak flux      CPL   6.74e-01  8.68e-01  7.89e-01  1.08e+00  2.74e+00  3.41e+00   ph/cm2/s
      90%_error_low -1.32e-01 -9.00e-02 -8.54e-02 -4.96e-01 -2.46e-01 -5.58e-01   ph/cm2/s
      90%_error_hi   1.18e-01  9.64e-02  9.06e-02  1.92e-01  2.46e-01  4.55e-01   ph/cm2/s

======================================================================
Image
Pre-slew 15.0-350.0 keV image (Event data)
#   RAcent    DECcent   POSerr    Theta     Phi              Peak Cts       SNR   Name
   28.5725    27.6354   0.0101    18.7544   -82.4346         0.6857405     19.168 TRIG_00895813

Foreground time interval of the image:
 -0.056   4.504 (delta_t =   4.560 [sec])
Background time interval of the image:
-90.931  -0.056 (delta_t =  90.875 [sec])
Light Curves
Note: The mask-weighted lightcurves have units of either count/det or counts/sec/det, where a det is 0.4 x 0.4 = 0.16 sq cm.
Full-time range; 1 s binning
Other quick-look light curves:
- 64 ms binning (zoomed)
- 16 ms binning (zoomed)
- 8 ms binning (zoomed)
- 2 ms binning (zoomed)
- SN=5 or 10 s binning (full-time range)
- Raw light curve
Spectra
- 64 ms binning (zoomed)
- 16 ms binning (zoomed)
- 8 ms binning (zoomed)
- 2 ms binning (zoomed)
- SN=5 or 10 s binning (full-time range)
- Raw light curve
Spectra
Notes:
- 1) The fitting includes the systematic errors.
- 2) When the burst includes telescope slew time periods, the fitting uses an average response file made from multiple 5-s response files through out the slew time plus single time preiod for the non-slew times, and weighted by the total counts in the corresponding time period using addrmf. An average response file is needed becuase a spectral fit using the pre-slew DRM will introduce some errors in both a spectral shape and a normalization if the PHA file contains a lot of the slew/post-slew time interval.
- 3) For fits to more complicated models (e.g. a power-law over a cutoff power-law), the BAT team has decided to require a chi-square improvement of more than 6 for each extra dof.
Time averaged spectrum fit using the average DRM
Power-law model
Time interval is from   -0.056 sec. to    4.504 sec.

Spectral model in power-law:
------------------------------------------------------------
Parameters  : value       lower 90%   higher 90%
Photon index: -1.24158     ( -0.149623   0.150753 )
Norm@50keV  : 9.77481E-03    ( -0.000834544   0.000832677 )
------------------------------------------------------------
#Fit statistic : Chi-Squared =          47.27 using 59 PHA bins.
# Reduced chi-squared =         0.8294 for     57 degrees of freedom
# Null hypothesis probability =   8.173299e-01

Photon flux (15-150 keV)    in 4.56 sec: 1.15454 ( -0.09906  0.09915 ) ph/cm2/s
Energy fluence (15-150 keV)             : 4.47131e-07 ( -4.35836e-08  4.40648e-08 ) ergs/cm2
Cutoff power-law model
Time interval is from   -0.056 sec. to    4.504 sec.
Spectral model in the cutoff power-law:
------------------------------------------------------------
Parameters  : value       lower 90%   higher 90%
Photon index: -1.16391     ( -0.214781   0.577209 )
Epeak [keV] : 535.688      ( -559.433 -559.433 )
Norm@50keV  : 1.06881E-02    ( -0.00334015   0.00959268 )
------------------------------------------------------------
#Fit statistic : Chi-Squared =          47.22 using 59 PHA bins.
# Reduced chi-squared =         0.8431 for     56 degrees of freedom
# Null hypothesis probability =   7.921655e-01

Photon flux (15-150 keV)    in 4.56 sec: 1.15089 ( -0.10221  0.1005 ) ph/cm2/s
Energy fluence (15-150 keV)             : 4.44319e-07 ( -4.81372e-08  4.3709e-08 ) ergs/cm2
1-s peak spectrum fit
Power-law model
Time interval is from   -0.056 sec. to    0.944 sec.

Spectral model in power-law:
------------------------------------------------------------
Parameters  : value       lower 90%   higher 90%
Photon index: -1.13968     ( -0.149151   0.151296 )
Norm@50keV  : 2.36167E-02    ( -0.00202373   0.00202372 )
------------------------------------------------------------
#Fit statistic : Chi-Squared =          41.82 using 59 PHA bins.
# Reduced chi-squared =         0.7337 for     57 degrees of freedom
# Null hypothesis probability =   9.342561e-01

Photon flux (15-150 keV)    in 1 sec: 2.75088 ( -0.24001  0.24022 ) ph/cm2/s
Energy fluence (15-150 keV)             : 2.4391e-07 ( -2.36021e-08  2.38033e-08 ) ergs/cm2
Cutoff power-law model
Time interval is from   -0.056 sec. to    0.944 sec.
Spectral model in the cutoff power-law:
------------------------------------------------------------
Parameters  : value       lower 90%   higher 90%
Photon index: -1.03373     ( -0.181474   0.569059 )
Epeak [keV] : 486.027      ( -486.042 -486.042 )
Norm@50keV  : 2.65751E-02    ( -0.00470603   0.0223076 )
------------------------------------------------------------
#Fit statistic : Chi-Squared =          41.70 using 59 PHA bins.
# Reduced chi-squared =         0.7446 for     56 degrees of freedom
# Null hypothesis probability =   9.226100e-01

Photon flux (15-150 keV)    in 1 sec: 2.74006 ( -0.24577  0.24563 ) ph/cm2/s
Energy fluence (15-150 keV)             : 2.42148e-07 ( -2.54225e-08  2.3802e-08 ) ergs/cm2
Time-resolved spectra
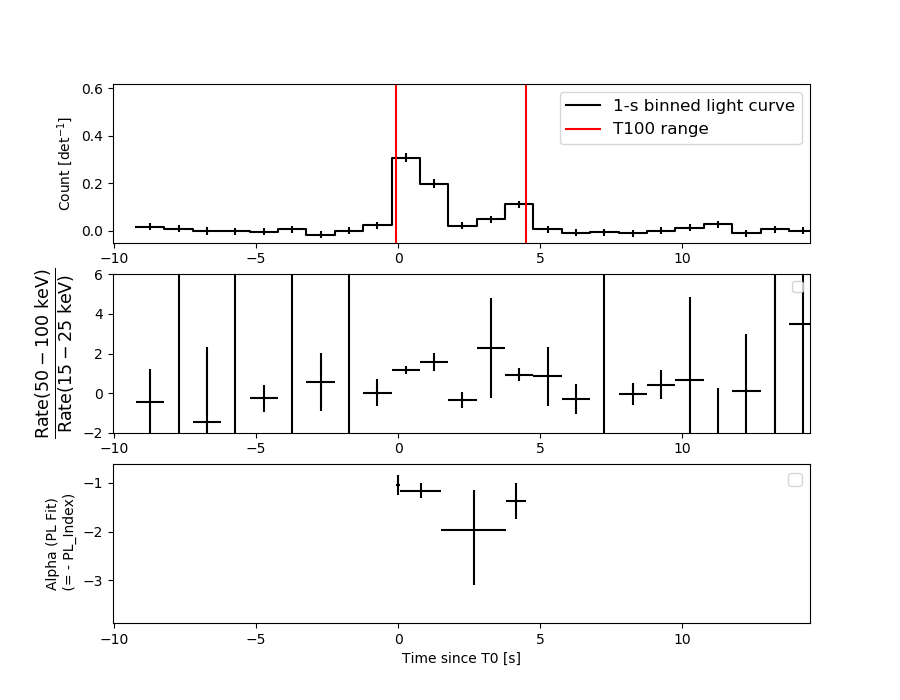
Distribution
T90 vs. Hardness ratio plot
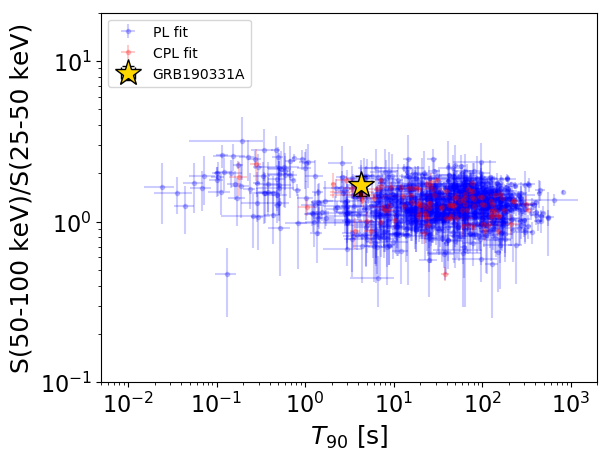
T90                                   = 4.336 sec.
Hardness ratio (energy fluence ratio) = 1.69164871103
S(15-50 keV) vs. S(50-150 keV) plot
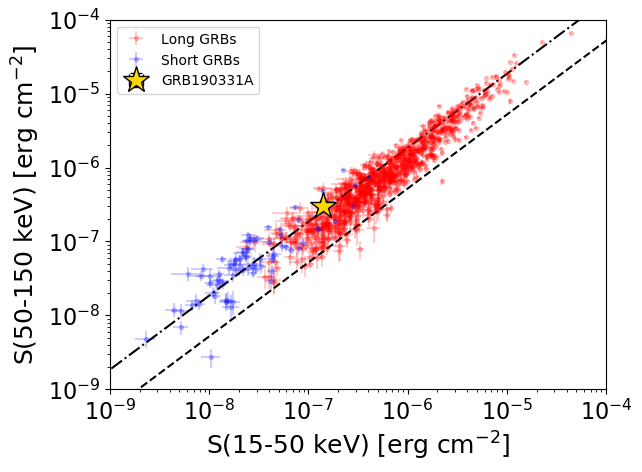
S(15-50 keV)  = 1.4094515e-07
S(50-150 keV) = 3.061873e-07
The dash-dotted line and the dashed line traces the fluences calculated from the Band function with Epeak = 15 and 150 keV, respectively. Both lines assume a canonical values of alpha = -1 and beta = -2.5.
Mask shadow pattern
IMX = 4.470270617610526E-02, IMY = 3.365833946717831E-01
Spacecraft aspect plot
Bright source in the pre-burst/pre-slew/post-slew images
Pre-burst image of 15-350 keV band
Time interval of the image:
-90.931410 -0.056000

# RAcent  DECcent POSerr Theta    Phi  PeakCts   SNR AngSep     Name
#  [deg]    [deg]    ['] [deg]  [deg]                   [']
 83.6072  22.0155    1.2  38.7  159.4   3.2512   9.2    1.4	Crab
326.2628  38.2412    5.2  57.4  -14.2   1.3109   2.2    6.5	Cyg X-2
 94.5513  32.2009    2.6  41.1  137.7   2.7692   4.3 ------	UNKNOWN
309.5843  65.8650    2.4  54.2   21.2   4.0396   4.7 ------	UNKNOWN
 61.4645   3.1113    2.8  41.7 -155.8   1.1003   4.1 ------	UNKNOWN
 45.7362   6.4130    2.4  35.3 -132.0   1.0634   4.7 ------	UNKNOWN
Pre-slew background subtracted image of 15-350 keV band
Time interval of the image:
-0.056000 4.504000

# RAcent  DECcent POSerr Theta    Phi  PeakCts   SNR AngSep     Name
#  [deg]    [deg]    ['] [deg]  [deg]                   [']
 83.7576  21.9736    9.3  38.8  159.3  -0.0826  -1.2    7.3	Crab
326.0284  38.3935  197.6  57.5  -13.9  -0.0084  -0.1    8.0	Cyg X-2
334.6650  71.1705    2.4  44.3   25.8   0.3686   4.8 ------	UNKNOWN
329.6156  54.2630    2.3  48.8    3.0   0.3553   4.9 ------	UNKNOWN
 71.4425  16.8838    2.2  34.3  179.3   0.2365   5.3 ------	UNKNOWN
 81.5893  -1.0909    2.0  54.8 -177.3   0.8667   5.6 ------	UNKNOWN
 28.5725  27.6354    0.6  18.8  -82.4   0.6858  19.2 ------	UNKNOWN
 67.0861  -0.4276    2.2  47.1 -161.4   0.3800   5.4 ------	UNKNOWN
Post-slew image of 15-350 keV band
Time interval of the image:
1079.868590 1093.118000

# RAcent  DECcent POSerr Theta    Phi  PeakCts   SNR AngSep     Name
#  [deg]    [deg]    ['] [deg]  [deg]                   [']
135.4187 -40.4834    4.6  50.9  153.7   0.6320   2.5    6.6	Vela X-1
154.5654  -0.1507    2.1  28.0   90.4   0.4838   5.5 ------	UNKNOWN
 97.5493  37.7934    2.8  39.2  -59.1   0.4185   4.1 ------	UNKNOWN