Analysis Summary
Notes:
- 1) No attempt has been made to eliminate the non-significant decimal places.
- 2) This batgrbproduct analysis is done using the HEASARC data.
- 3) This batgrbproduct analysis is using the flight position for the mask-weighting calculation.
======================================================================
                  BAT GRB EVENT DATA PROCESSING REPORT
    Process Script Ver: batgrbproduct v2.46
    Process Start Time: Mon May 20 17:21:26 EDT 2019
             Host Name: bat1
   Current Working Dir: /local/data/bat1/alien/Swift_3rdBATcatalog/event/batevent_reproc/trigger899979
======================================================================

  Trigger: 00899979      Segment: 000

  BAT Trigger Time: 577666552   [s; MET]
      Trigger Stop: 577666656   [s; MET]
               UTC: 2019-04-22T22:55:29.215560    [includes UTCF correction]
       Where From?: TDRSS position message

  BAT
    RA: 182.124237954621   Dec: -60.2379723458902  [deg; J2000]

     Catalogged Source?: NO
     Point Source?:      YES
     GRB Indicated?:     YES    [ by BAT flight software ]
     Image S/N Ratio:    10.54
     Image Trigger?:     YES
     Rate S/N Ratio:     0  [ if not an image trigger ]
     Image S/N Ratio:    10.54

  Analysis Position:   [ source = BAT ]
    RA: 182.124237954621   Dec: -60.2379723458902  [deg; J2000]

  Refined Position:   [ source = BAT pre-slew burst ]
    RA: 182.134686693791   Dec: -60.1692386477795  [deg; J2000]
        { 12h 08m 32.3s , -60d 10' 09.3" }
         +/- 2.43777419334157 [arcmin] (estimated 90% radius based on SNR)
         +/- 1.28307860168927 [arcmin] (formal 1-sigma fit error)
    SNR: 8.51668448240087

  Angular difference between the analysis and refined position is 4.135772 arcmin

  Partial Coding Fraction: 0.828125    [ including projection effects ]

  Duration
     T90: 269.016000032425 +/- 50.7213055702129
        Measured from: 18.2519999742508
                   to: 287.268000006676     [s; relative to TRIGTIME]
     T50: 88.1599999666214 +/- 22.569598648955
        Measured from: 105.723999977112
                   to: 193.883999943733     [s; relative to TRIGTIME]


  Fluence
     Peak Flux  (peak 1 second)
        Measured from: 174.37600004673
                   to: 175.37600004673     [s; relative to TRIGTIME]
     Total Fluence
        Measured from: 6.42799997329712
                   to: 359.531999945641     [s; relative to TRIGTIME]

             Band 1     Band 2     Band 3     Band 4
              15-25      25-50     50-100    100-350     keV
 Total     3.796835   4.232050   2.536182   0.633619
           0.147429   0.151678   0.131223   0.114973 [error]
 Peak      0.081910   0.118972   0.086320   0.022703
           0.009707   0.010608   0.009554   0.007395 [error]

     [ fluence units of on-axis counts / fully illuminated detector ]

======================================================================


====== Table of the duration information =============================

        Value   tstart    tstop
T100  353.104    6.428  359.532
T90   269.016   18.252  287.268
T50    88.160  105.724  193.884
Peak    1.000  174.376  175.376


====== Spectral Analysis Summary =====================================

Model      : spectral model: simple power-law (PL) and cutoff power-law (CPL)
Ph_index   : photon index: E^{Ph_index}
Ph_90err   : 90% error of the photon index
Epeak      : Epeak in keV
Epeak_90err: 90% error of Epeak
Norm       : normalization at 50 keV in both the PL model and CPL model
Nomr_90err : 90% error of the normalization
chi2       : Chi-Squared
dof        : degree of freedo

=== Time-averaged spectral analysis ===
(Best model with acceptable fit: PL)

Model Ph_index Ph_90err_low Ph_90err_hi  Epeak  Epeak_90err_low  Epeak_90err_hi  Norm       Nomr_90err_low    Norm_90err_hi    chi2    dof
PL      -1.776    -0.088      0.087       -           -               -         1.88e-03     -8.99e-05          8.93e-05      39.550   57
CPL     -1.777    -0.086      0.117     9999.360    -9999.350      -9999.360      1.88e-03     -5.84e-04          7.40e-04      39.550   56


=== 1-s peak spectral analysis ===
(Best model with acceptable fit: PL)

Model Ph_index Ph_90err_low Ph_90err_hi  Epeak  Epeak_90err_low  Epeak_90err_hi  Norm       Nomr_90err_low    Norm_90err_hi    chi2    dof
PL      -1.509     -0.180     0.176       -           -               -         1.94e-02     -2.06e-03          2.03e-03      44.260   57
CPL     -1.236     -0.427     0.747      137.363    -137.363      -137.363      2.68e-02     -1.07e-02          3.68e-02      43.750   56


=== Fluence/Peak Flux Summary ===

              Model    Band1     Band2     Band3     Band4     Band5     Total
                       15-25     25-50    50-100    100-350    15-150    15-350    keV
Fluence         PL   1.10e-06  1.71e-06  2.00e-06  4.50e-06  6.13e-06  9.31e-06   erg/cm2
      90%_error_low -8.36e-08 -7.65e-08 -1.33e-07 -6.15e-07 -3.01e-07 -7.24e-07   erg/cm2
      90%_error_hi   8.57e-08  7.64e-08  1.33e-07  6.82e-07  3.03e-07  7.76e-07   erg/cm2
Peak flux       PL   8.07e-01  8.07e-01  5.67e-01  6.32e-01  2.43e+00  2.81e+00   ph/cm2/s
      90%_error_low -1.31e-01 -8.35e-02 -7.76e-02 -1.60e-01 -2.42e-01 -2.89e-01   ph/cm2/s
      90%_error_hi   1.37e-01  8.30e-02  7.70e-02  1.91e-01  2.42e-01  2.92e-01   ph/cm2/s

Fluence        CPL   1.10e-06  1.71e-06  2.00e-06  4.49e-06  6.15e-06  9.33e-06   erg/cm2
      90%_error_low -8.37e-08 -7.85e-08    N/A       N/A    -4.06e-07 -1.78e-06   erg/cm2
      90%_error_hi   8.58e-08  9.99e-08    N/A       N/A     2.74e-07  3.78e-07   erg/cm2
Peak flux      CPL   7.71e-01  8.29e-01  5.79e-01  4.52e-01  2.40e+00  2.63e+00   ph/cm2/s
      90%_error_low -1.58e-01 -9.75e-02 -8.28e-02 -2.45e-01 -2.53e-01 -3.71e-01   ph/cm2/s
      90%_error_hi   1.60e-01  1.01e-01  8.52e-02  2.32e-01  2.52e-01  4.37e-01   ph/cm2/s

======================================================================
Image
Pre-slew 15.0-350.0 keV image (Event data)
#   RAcent    DECcent   POSerr    Theta     Phi              Peak Cts       SNR   Name
  182.1347   -60.1692   0.0225    15.8711   132.7921        10.6216547      8.517 TRIG_00899979

Foreground time interval of the image:
  6.428 359.532 (delta_t = 353.104 [sec])
Background time interval of the image:
-10.699   6.428 (delta_t =  17.127 [sec])
Light Curves
Note: The mask-weighted lightcurves have units of either count/det or counts/sec/det, where a det is 0.4 x 0.4 = 0.16 sq cm.
Full-time range; 1 s binning
Other quick-look light curves:
- 64 ms binning (zoomed)
- 16 ms binning (zoomed)
- 8 ms binning (zoomed)
- 2 ms binning (zoomed)
- SN=5 or 10 s binning (full-time range)
- Raw light curve
Spectra
- 64 ms binning (zoomed)
- 16 ms binning (zoomed)
- 8 ms binning (zoomed)
- 2 ms binning (zoomed)
- SN=5 or 10 s binning (full-time range)
- Raw light curve
Spectra
Notes:
- 1) The fitting includes the systematic errors.
- 2) When the burst includes telescope slew time periods, the fitting uses an average response file made from multiple 5-s response files through out the slew time plus single time preiod for the non-slew times, and weighted by the total counts in the corresponding time period using addrmf. An average response file is needed becuase a spectral fit using the pre-slew DRM will introduce some errors in both a spectral shape and a normalization if the PHA file contains a lot of the slew/post-slew time interval.
- 3) For fits to more complicated models (e.g. a power-law over a cutoff power-law), the BAT team has decided to require a chi-square improvement of more than 6 for each extra dof.
Time averaged spectrum fit using the average DRM
Power-law model
Time interval is from    6.428 sec. to  359.532 sec.

Spectral model in power-law:
------------------------------------------------------------
Parameters  : value       lower 90%   higher 90%
Photon index: -1.77592     ( -0.0880226   0.0871109 )
Norm@50keV  : 1.88415E-03    ( -8.98512e-05   8.92481e-05 )
------------------------------------------------------------
#Fit statistic : Chi-Squared =          39.55 using 59 PHA bins.
# Reduced chi-squared =         0.6938 for     57 degrees of freedom
# Null hypothesis probability =   9.620763e-01

Photon flux (15-150 keV)    in 353.1 sec: 0.257261 ( -0.011742  0.011781 ) ph/cm2/s
Energy fluence (15-150 keV)             : 6.13165e-06 ( -3.00858e-07  3.03039e-07 ) ergs/cm2
Cutoff power-law model

Time interval is from    6.428 sec. to  359.532 sec.
Spectral model in the cutoff power-law:
------------------------------------------------------------
Parameters  : value       lower 90%   higher 90%
Photon index: -1.77694     ( -0.0871566   0.115928 )
Epeak [keV] : 9999.36      ( -9999.35 -9999.36 )
Norm@50keV  : 1.88481E-03    ( -0.000585909   0.000738236 )
------------------------------------------------------------
#Fit statistic : Chi-Squared =          39.55 using 59 PHA bins.
# Reduced chi-squared =         0.7063 for     56 degrees of freedom
# Null hypothesis probability =   9.529894e-01

Photon flux (15-150 keV)    in 353.1 sec: 0.257902 ( -0.014068  0.012154 ) ph/cm2/s
Energy fluence (15-150 keV)             : 6.15386e-06 ( -4.05585e-07  2.73573e-07 ) ergs/cm2
1-s peak spectrum fit
Power-law model
Time interval is from  174.376 sec. to  175.376 sec.

Spectral model in power-law:
------------------------------------------------------------
Parameters  : value       lower 90%   higher 90%
Photon index: -1.50945     ( -0.180246   0.176503 )
Norm@50keV  : 1.94201E-02    ( -0.00205644   0.00203367 )
------------------------------------------------------------
#Fit statistic : Chi-Squared =          44.26 using 59 PHA bins.
# Reduced chi-squared =         0.7764 for     57 degrees of freedom
# Null hypothesis probability =   8.911494e-01

Photon flux (15-150 keV)    in 1 sec: 2.43067 ( -0.24211  0.24223 ) ph/cm2/s
Energy fluence (15-150 keV)             : 1.83971e-07 ( -2.15359e-08  2.18359e-08 ) ergs/cm2
Cutoff power-law model

Time interval is from  174.376 sec. to  175.376 sec.
Spectral model in the cutoff power-law:
------------------------------------------------------------
Parameters  : value       lower 90%   higher 90%
Photon index: -1.23638     ( -0.426854   0.747469 )
Epeak [keV] : 137.363      ( -137.363 -137.363 )
Norm@50keV  : 2.68456E-02    ( -0.0107093   0.0368391 )
------------------------------------------------------------
#Fit statistic : Chi-Squared =          43.75 using 59 PHA bins.
# Reduced chi-squared =         0.7813 for     56 degrees of freedom
# Null hypothesis probability =   8.829475e-01

Photon flux (15-150 keV)    in 1 sec: 2.40174 ( -0.25284  0.25163 ) ph/cm2/s
Energy fluence (15-150 keV)             : 1.79833e-07 ( -2.38275e-08  2.35947e-08 ) ergs/cm2
Time-resolved spectra
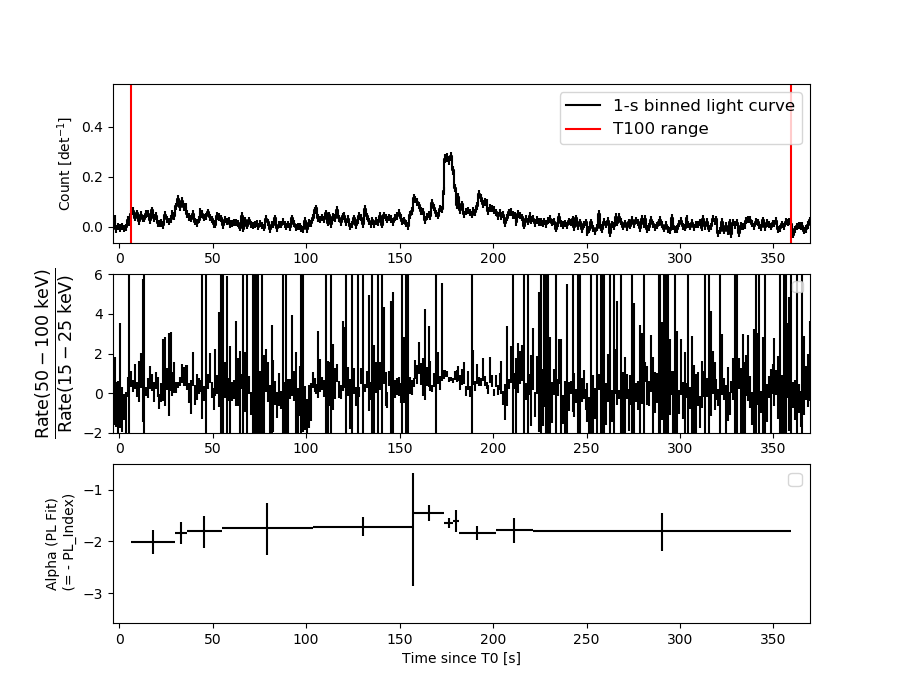
Distribution
T90 vs. Hardness ratio plot
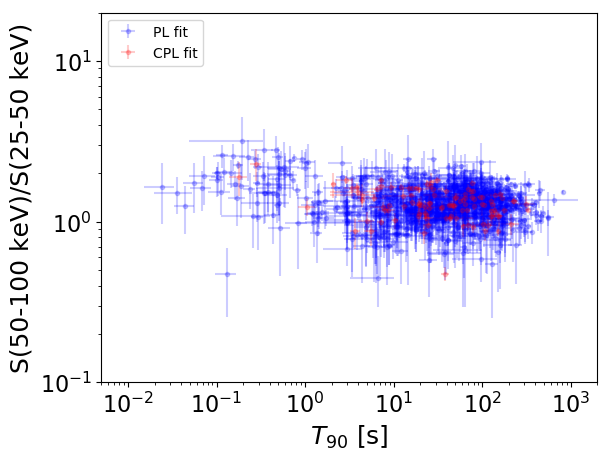
T90                                   = N/A sec.
Hardness ratio (energy fluence ratio) = N/A
S(15-50 keV) vs. S(50-150 keV) plot
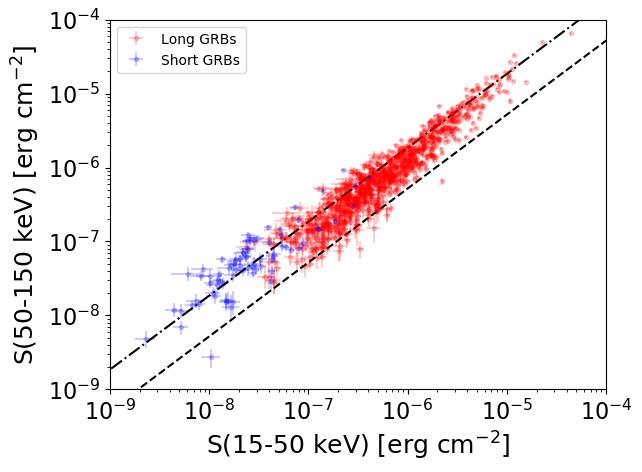
S(15-50 keV)  = N/A
S(50-150 keV) = N/A
The dash-dotted line and the dashed line traces the fluences calculated from the Band function with Epeak = 15 and 150 keV, respectively. Both lines assume a canonical values of alpha = -1 and beta = -2.5.
Mask shadow pattern
IMX = -1.931450815150185E-01, IMY = -2.086357058177104E-01
Spacecraft aspect plot
Bright source in the pre-burst/pre-slew/post-slew images
Pre-burst image of 15-350 keV band
Time interval of the image:
-10.699390 6.428000

# RAcent  DECcent POSerr Theta    Phi  PeakCts   SNR AngSep     Name
#  [deg]    [deg]    ['] [deg]  [deg]                   [']
135.6932 -40.5491    2.1  20.4  -11.1   0.3363   5.4    7.5	Vela X-1
170.1711 -60.4878    5.9  10.0  133.0  -0.1143  -2.0    9.2	Cen X-3
186.4689 -62.8677    3.4  17.7  142.7   0.2256   3.4    7.8	GX 301-2
 89.2729 -46.1924    2.5  38.0  -75.3   0.6260   4.5 ------	UNKNOWN
Pre-slew background subtracted image of 15-350 keV band
Time interval of the image:
6.428000 359.532000

# RAcent  DECcent POSerr Theta    Phi  PeakCts   SNR AngSep     Name
#  [deg]    [deg]    ['] [deg]  [deg]                   [']
135.6801 -40.5299    3.6  20.4  -11.2  -3.6997  -3.2    7.1	Vela X-1
170.5562 -60.7177    5.5  10.2  134.3  -2.3621  -2.1    9.1	Cen X-3
186.5048 -62.8999    4.3  17.7  142.8  -3.3624  -2.7    8.8	GX 301-2
182.1346 -60.1692    1.3  15.9  132.8  10.6247   8.5 ------	UNKNOWN
322.9195 -65.3604    2.5  55.9 -160.4  20.6790   4.5 ------	UNKNOWN
Post-slew image of 15-350 keV band
Time interval of the image:
512.800600 963.131300

# RAcent  DECcent POSerr Theta    Phi  PeakCts   SNR AngSep     Name
#  [deg]    [deg]    ['] [deg]  [deg]                   [']
135.5290 -40.5652    1.9  34.5  -22.3   5.2536   6.1    0.6	Vela X-1
169.9028 -60.6279    8.6   6.0  -44.6  -0.9243  -1.3   12.2	Cen X-3
186.7355 -62.7079    6.7   3.3 -165.6   1.2028   1.7    4.3	GX 301-2
255.8870 -37.9098    5.5  50.0  152.9   8.1731   2.1    6.1	4U 1700-377
264.5635 -44.4039    4.7  49.2  165.0  -6.9170  -2.4    8.2	4U 1735-44
224.8922 -31.2728    3.2  40.4  118.1  10.4013   3.6 ------	UNKNOWN
239.3925 -43.5048    3.0  37.6  144.5   6.4475   3.8 ------	UNKNOWN
167.2300 -38.6275    2.6  23.5   24.3   3.2954   4.5 ------	UNKNOWN
150.3519 -38.0669    3.0  29.8   -2.0   3.1857   3.8 ------	UNKNOWN
261.8027 -67.5806    2.8  33.3 -168.8   3.5735   4.1 ------	UNKNOWN