Analysis Summary
Notes:
- 1) No attempt has been made to eliminate the non-significant decimal places.
- 2) This batgrbproduct analysis is done using the HEASARC data.
- 3) This batgrbproduct analysis is using the flight position for the mask-weighting calculation.
======================================================================
BAT GRB EVENT DATA PROCESSING REPORT
Process Script Ver: batgrbproduct v2.46
Process Start Time: Mon May 20 17:16:22 EDT 2019
Host Name: bat1
Current Working Dir: /local/data/bat1/alien/Swift_3rdBATcatalog/event/batevent_reproc/trigger900285
======================================================================
Trigger: 00900285 Segment: 000
BAT Trigger Time: 577792865.984 [s; MET]
Trigger Stop: 577792867.008 [s; MET]
UTC: 2019-04-24T10:00:43.191560 [includes UTCF correction]
Where From?: TDRSS position message
BAT
RA: 48.6808760446314 Dec: 20.2334856376405 [deg; J2000]
Catalogged Source?: NO
Point Source?: YES
GRB Indicated?: YES [ by BAT flight software ]
Image S/N Ratio: 6.72
Image Trigger?: NO
Rate S/N Ratio: 15.1657508881031 [ if not an image trigger ]
Image S/N Ratio: 6.72
Analysis Position: [ source = BAT ]
RA: 48.6808760446314 Dec: 20.2334856376405 [deg; J2000]
Refined Position: [ source = BAT pre-slew burst ]
RA: 48.6932555577323 Dec: 20.2413142171866 [deg; J2000]
{ 03h 14m 46.4s , +20d 14' 28.7" }
+/- 1.43103058970632 [arcmin] (estimated 90% radius based on SNR)
+/- 0.552892855010032 [arcmin] (formal 1-sigma fit error)
SNR: 18.2289974335155
Angular difference between the analysis and refined position is 0.840432 arcmin
Partial Coding Fraction: 0.4101562 [ including projection effects ]
Duration
T90: 9.83599996566772 +/- 3.91796534981675
Measured from: -0.804000020027161
to: 9.03199994564056 [s; relative to TRIGTIME]
T50: 5.2960000038147 +/- 0.985397294079381
Measured from: 1.36800003051758
to: 6.66400003433228 [s; relative to TRIGTIME]
Fluence
Peak Flux (peak 1 second)
Measured from: 1.09600007534027
to: 2.09600007534027 [s; relative to TRIGTIME]
Total Fluence
Measured from: -1.31199991703033
to: 14.3680000305176 [s; relative to TRIGTIME]
Band 1 Band 2 Band 3 Band 4
15-25 25-50 50-100 100-350 keV
Total 0.480433 0.720049 0.552130 0.133657
0.049801 0.053556 0.047571 0.038782 [error]
Peak 0.044193 0.093931 0.082831 0.021367
0.012608 0.014186 0.013420 0.011071 [error]
[ fluence units of on-axis counts / fully illuminated detector ]
======================================================================
====== Table of the duration information =============================
Value tstart tstop
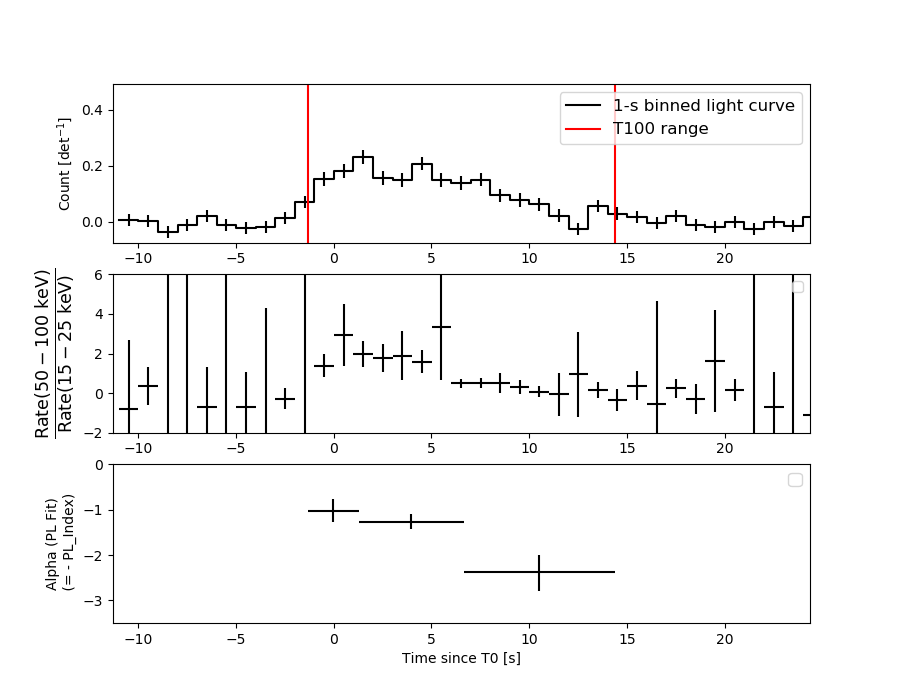
T100 15.680 -1.312 14.368
T90 9.836 -0.804 9.032
T50 5.296 1.368 6.664
Peak 1.000 1.096 2.096
====== Spectral Analysis Summary =====================================
Model : spectral model: simple power-law (PL) and cutoff power-law (CPL)
Ph_index : photon index: E^{Ph_index}
Ph_90err : 90% error of the photon index
Epeak : Epeak in keV
Epeak_90err: 90% error of Epeak
Norm : normalization at 50 keV in both the PL model and CPL model
Nomr_90err : 90% error of the normalization
chi2 : Chi-Squared
dof : degree of freedo
=== Time-averaged spectral analysis ===
(Best model with acceptable fit: PL)
Model Ph_index Ph_90err_low Ph_90err_hi Epeak Epeak_90err_low Epeak_90err_hi Norm Nomr_90err_low Norm_90err_hi chi2 dof
PL -1.493 -0.142 0.141 - - - 8.12e-03 -6.81e-04 6.78e-04 54.930 57
CPL -1.197 -0.370 0.611 135.409 -61.298 -135.409 1.15e-02 -3.92e-03 1.16e-02 54.090 56
=== 1-s peak spectral analysis ===
(Best model with acceptable fit: PL)
Model Ph_index Ph_90err_low Ph_90err_hi Epeak Epeak_90err_low Epeak_90err_hi Norm Nomr_90err_low Norm_90err_hi chi2 dof
PL -1.100 -0.280 0.290 - - - 1.72e-02 -2.77e-03 2.76e-03 64.350 57
CPL -0.870 N/A N/A 281.263 N/A N/A 2.19e-02 N/A N/A 64.320 56
=== Fluence/Peak Flux Summary ===
Model Band1 Band2 Band3 Band4 Band5 Total
15-25 25-50 50-100 100-350 15-150 15-350 keV
Fluence PL 1.62e-07 2.98e-07 4.24e-07 1.27e-06 1.21e-06 2.15e-06 erg/cm2
90%_error_low -2.22e-08 -2.57e-08 -4.57e-08 -2.68e-07 -1.10e-07 -3.08e-07 erg/cm2
90%_error_hi 2.30e-08 2.56e-08 4.54e-08 3.13e-07 1.11e-07 3.44e-07 erg/cm2
Peak flux PL 4.84e-01 6.19e-01 5.78e-01 9.48e-01 2.00e+00 2.63e+00 ph/cm2/s
90%_error_low -1.50e-01 -1.25e-01 -1.03e-01 -3.19e-01 -3.31e-01 -4.41e-01 ph/cm2/s
90%_error_hi 1.67e-01 1.21e-01 1.01e-01 4.12e-01 3.33e-01 4.55e-01 ph/cm2/s
Fluence CPL 1.54e-07 3.08e-07 4.32e-07 8.07e-07 1.18e-06 1.70e-06 erg/cm2
90%_error_low -2.61e-08 -3.13e-08 -4.90e-08 -4.34e-07 -1.22e-07 -4.47e-07 erg/cm2
90%_error_hi 2.65e-08 3.23e-08 5.00e-08 5.91e-07 1.21e-07 5.75e-07 erg/cm2
Peak flux CPL 4.68e-01 6.24e-01 5.87e-01 8.25e-01 1.99e+00 2.50e+00 ph/cm2/s
90%_error_low -1.86e-01 -1.28e-01 -1.10e-01 -5.06e-01 -3.40e-01 -6.44e-01 ph/cm2/s
90%_error_hi 1.50e-01 1.31e-01 1.25e-01 3.56e-01 3.25e-01 5.44e-01 ph/cm2/s
======================================================================
Image
Pre-slew 15.0-350.0 keV image (Event data)
#   RAcent    DECcent   POSerr    Theta     Phi              Peak Cts       SNR   Name
   48.6933    20.2413   0.0106    33.6996   -74.8538         1.9146232     18.229 TRIG_00900285

Foreground time interval of the image:
 -1.312  14.368 (delta_t =  15.680 [sec])
Background time interval of the image:
-239.984  -1.312 (delta_t = 238.672 [sec])
Light Curves
Note: The mask-weighted lightcurves have units of either count/det or counts/sec/det, where a det is 0.4 x 0.4 = 0.16 sq cm.
Full-time range; 1 s binning
Other quick-look light curves:
- 64 ms binning (zoomed)
- 16 ms binning (zoomed)
- 8 ms binning (zoomed)
- 2 ms binning (zoomed)
- SN=5 or 10 s binning (full-time range)
- Raw light curve
Spectra
- 64 ms binning (zoomed)
- 16 ms binning (zoomed)
- 8 ms binning (zoomed)
- 2 ms binning (zoomed)
- SN=5 or 10 s binning (full-time range)
- Raw light curve
Spectra
Notes:
- 1) The fitting includes the systematic errors.
- 2) When the burst includes telescope slew time periods, the fitting uses an average response file made from multiple 5-s response files through out the slew time plus single time preiod for the non-slew times, and weighted by the total counts in the corresponding time period using addrmf. An average response file is needed becuase a spectral fit using the pre-slew DRM will introduce some errors in both a spectral shape and a normalization if the PHA file contains a lot of the slew/post-slew time interval.
- 3) For fits to more complicated models (e.g. a power-law over a cutoff power-law), the BAT team has decided to require a chi-square improvement of more than 6 for each extra dof.
Time averaged spectrum fit using the average DRM
Power-law model
Time interval is from   -1.312 sec. to   14.368 sec.

Spectral model in power-law:
------------------------------------------------------------
Parameters  : value       lower 90%   higher 90%
Photon index: -1.49329     ( -0.141898   0.14093 )
Norm@50keV  : 8.12291E-03    ( -0.000680606   0.000678017 )
------------------------------------------------------------
#Fit statistic : Chi-Squared =          54.93 using 59 PHA bins.
# Reduced chi-squared =         0.9638 for     57 degrees of freedom
# Null hypothesis probability =   5.529803e-01

Photon flux (15-150 keV)    in 15.68 sec: 1.01226 ( -0.084713  0.08482 ) ph/cm2/s
Energy fluence (15-150 keV)             : 1.20978e-06 ( -1.10353e-07  1.112e-07 ) ergs/cm2
Cutoff power-law model
Time interval is from   -1.312 sec. to   14.368 sec.
Spectral model in the cutoff power-law:
------------------------------------------------------------
Parameters  : value       lower 90%   higher 90%
Photon index: -1.19687     ( -0.369741   0.610924 )
Epeak [keV] : 135.409      ( -61.3085 -135.42 )
Norm@50keV  : 1.15021E-02    ( -0.0039145   0.0116416 )
------------------------------------------------------------
#Fit statistic : Chi-Squared =          54.09 using 59 PHA bins.
# Reduced chi-squared =         0.9659 for     56 degrees of freedom
# Null hypothesis probability =   5.475491e-01

Photon flux (15-150 keV)    in 15.68 sec: 1.00055 ( -0.087564  0.08748 ) ph/cm2/s
Energy fluence (15-150 keV)             : 1.1842e-06 ( -1.21709e-07  1.20724e-07 ) ergs/cm2
1-s peak spectrum fit
Power-law model
Time interval is from    1.096 sec. to    2.096 sec.

Spectral model in power-law:
------------------------------------------------------------
Parameters  : value       lower 90%   higher 90%
Photon index: -1.09966     ( -0.279617   0.290242 )
Norm@50keV  : 1.72483E-02    ( -0.00276909   0.00276043 )
------------------------------------------------------------
#Fit statistic : Chi-Squared =          64.35 using 59 PHA bins.
# Reduced chi-squared =          1.129 for     57 degrees of freedom
# Null hypothesis probability =   2.348955e-01

Photon flux (15-150 keV)    in 1 sec: 2.00062 ( -0.33115  0.33288 ) ph/cm2/s
Energy fluence (15-150 keV)             : 1.80372e-07 ( -3.11338e-08  3.13568e-08 ) ergs/cm2
Cutoff power-law model
Time interval is from    1.096 sec. to    2.096 sec.
Spectral model in the cutoff power-law:
------------------------------------------------------------
Parameters  : value       lower 90%   higher 90%
Photon index: -2.02645     (       )
Epeak [keV] : 9.66330      (   )
Norm@50keV  : 3.46717E-03    (     )
------------------------------------------------------------
#Fit statistic : Chi-Squared =          64.27 using 59 PHA bins.
# Reduced chi-squared =          1.148 for     56 degrees of freedom
# Null hypothesis probability =   2.094573e-01

Photon flux (15-150 keV)    in 1 sec: 1.98973 ( -0.33994  0.32511 ) ph/cm2/s
Energy fluence (15-150 keV)             : 1.79374e-07 ( -3.22952e-08  3.09409e-08 ) ergs/cm2
Time-resolved spectra
Distribution
T90 vs. Hardness ratio plot
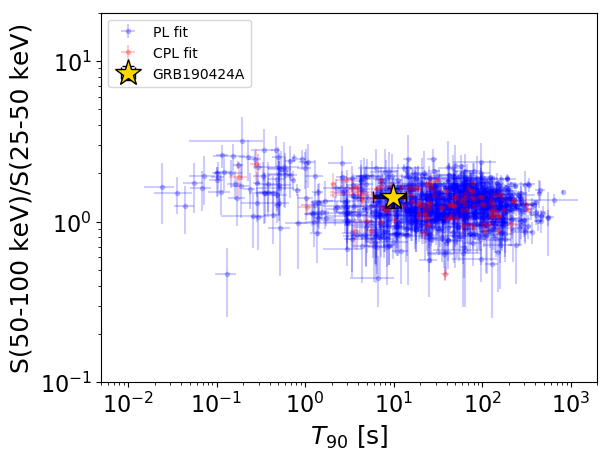
T90                                   = 9.836 sec.
Hardness ratio (energy fluence ratio) = 1.42085602565
S(15-50 keV) vs. S(50-150 keV) plot
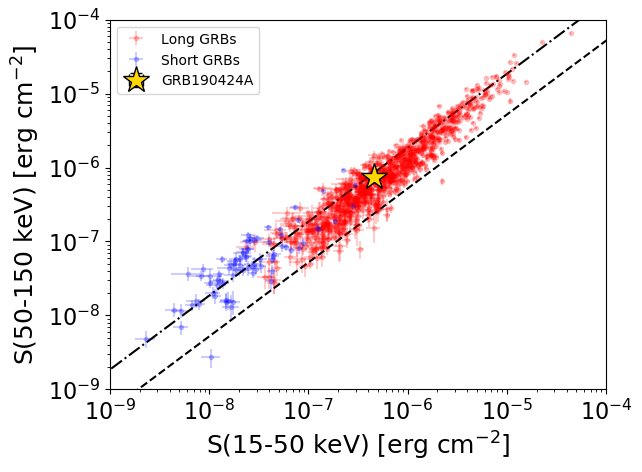
S(15-50 keV)  = 4.59805e-07
S(50-150 keV) = 7.499646e-07
The dash-dotted line and the dashed line traces the fluences calculated from the Band function with Epeak = 15 and 150 keV, respectively. Both lines assume a canonical values of alpha = -1 and beta = -2.5.
Mask shadow pattern
IMX = 1.742514579650881E-01, IMY = 6.437401024430686E-01
Spacecraft aspect plot
Bright source in the pre-burst/pre-slew/post-slew images
Pre-burst image of 15-350 keV band
Time interval of the image:
-239.984000 -1.312000

# RAcent  DECcent POSerr Theta    Phi  PeakCts   SNR AngSep     Name
#  [deg]    [deg]    ['] [deg]  [deg]                   [']
 83.6395  22.0249    0.4   5.4   -0.8  10.0435  26.4    0.7	Crab
120.2143  -2.4021    3.7  40.4  118.1   5.9760   3.1 ------	UNKNOWN
 65.5192 -13.1830    2.8  35.0 -143.9   2.3908   4.1 ------	UNKNOWN
Pre-slew background subtracted image of 15-350 keV band
Time interval of the image:
-1.312000 14.368000

# RAcent  DECcent POSerr Theta    Phi  PeakCts   SNR AngSep     Name
#  [deg]    [deg]    ['] [deg]  [deg]                   [']
 83.7841  22.1733    0.0   5.6    0.7   0.0343   0.6   12.7	Crab
 54.7496  73.2885    1.9  59.1   -6.0   2.2338   6.1 ------	UNKNOWN
 48.6933  20.2413    0.6  33.7  -74.9   1.9144  18.2 ------	UNKNOWN
 47.4004 -10.8345    2.0  45.5 -121.2   1.3821   5.7 ------	UNKNOWN
Post-slew image of 15-350 keV band
Time interval of the image:
179.516600 962.126600

# RAcent  DECcent POSerr Theta    Phi  PeakCts   SNR AngSep     Name
#  [deg]    [deg]    ['] [deg]  [deg]                   [']
135.5631 -40.5038    1.6  13.3  -90.5   8.9327   7.1    3.4	Vela X-1
170.6881 -60.6952    3.5  24.9  172.5   4.6091   3.3   11.8	Cen X-3
186.7751 -62.8057    3.5  31.9  164.5   5.6270   3.3    3.9	GX 301-2
204.2980 -36.9431    3.1  40.4  118.1  20.0608   3.7 ------	UNKNOWN
221.6208 -61.1036    2.5  47.1  155.6  22.9137   4.6 ------	UNKNOWN
145.0613  15.0143    3.0  54.0    4.6  11.3305   3.9 ------	UNKNOWN
142.2254  -4.9751    2.9  34.8   -4.7   6.5360   4.0 ------	UNKNOWN
126.1629 -24.5581    2.4  26.3  -52.3   6.9902   4.9 ------	UNKNOWN
124.3811   1.0507    3.2  47.3  -26.4   8.4050   3.6 ------	UNKNOWN
 98.2996 -42.7775    2.4  40.7 -100.4  27.5892   4.8 ------	UNKNOWN
 91.2153 -52.8490    2.0  43.8 -116.3  31.1127   5.6 ------	UNKNOWN