Analysis Summary
Notes:
- 1) No attempt has been made to eliminate the non-significant decimal places.
- 2) This batgrbproduct analysis is done using the HEASARC data.
- 3) This batgrbproduct analysis is using the flight position for the mask-weighting calculation.
======================================================================
                  BAT GRB EVENT DATA PROCESSING REPORT
    Process Script Ver: batgrbproduct v2.46
    Process Start Time: Mon Jul 15 19:10:48 EDT 2019
             Host Name: bat1
   Current Working Dir: /local/data/bat1/alien/Swift_3rdBATcatalog/event/batevent_reproc/trigger903158
======================================================================

  Trigger: 00903158      Segment: 000

  BAT Trigger Time: 579251711.168   [s; MET]
      Trigger Stop: 579251715.264   [s; MET]
               UTC: 2019-05-11T07:14:48.282980    [includes UTCF correction]
       Where From?: TDRSS position message

  BAT
    RA: 126.436247844037   Dec: -20.241918781366  [deg; J2000]

     Catalogged Source?: NO
     Point Source?:      YES
     GRB Indicated?:     YES    [ by BAT flight software ]
     Image S/N Ratio:    9.72
     Image Trigger?:     NO
     Rate S/N Ratio:     38.7040049607273  [ if not an image trigger ]
     Image S/N Ratio:    9.72

  Analysis Position:   [ source = BAT ]
    RA: 126.436247844037   Dec: -20.241918781366  [deg; J2000]

  Refined Position:   [ source = BAT pre-slew burst ]
    RA: 126.443352200869   Dec: -20.2516490161234  [deg; J2000]
        { 08h 25m 46.4s , -20d 15' 05.9" }
         +/- 1.54578529804546 [arcmin] (estimated 90% radius based on SNR)
         +/- 0.573521889661727 [arcmin] (formal 1-sigma fit error)
    SNR: 16.3269580370783

  Angular difference between the analysis and refined position is 0.707656 arcmin

  Partial Coding Fraction: 0.09082031    [ including projection effects ]

  Duration
     T90: 27.6640000343323 +/- 2.35417588983274
        Measured from: -21.7919999361038
                   to: 5.87200009822845     [s; relative to TRIGTIME]
     T50: 15.7760000228882 +/- 1.75635985311219
        Measured from: -14.2239999771118
                   to: 1.55200004577637     [s; relative to TRIGTIME]


  Fluence
     Peak Flux  (peak 1 second)
        Measured from: 0.356000065803528
                   to: 1.35600006580353     [s; relative to TRIGTIME]
     Total Fluence
        Measured from: -24.2719999551773
                   to: 6.87999999523163     [s; relative to TRIGTIME]

             Band 1     Band 2     Band 3     Band 4
              15-25      25-50     50-100    100-350     keV
 Total     1.482746   3.318016   3.490758   1.604831
           0.182192   0.210369   0.201215   0.162955 [error]
 Peak      0.064672   0.277670   0.368425   0.092962
           0.035118   0.047866   0.049889   0.037150 [error]

     [ fluence units of on-axis counts / fully illuminated detector ]

======================================================================


====== Table of the duration information =============================

        Value   tstart    tstop
T100   31.152  -24.272    6.880
T90    27.664  -21.792    5.872
T50    15.776  -14.224    1.552
Peak    1.000    0.356    1.356


====== Spectral Analysis Summary =====================================

Model      : spectral model: simple power-law (PL) and cutoff power-law (CPL)
Ph_index   : photon index: E^{Ph_index}
Ph_90err   : 90% error of the photon index
Epeak      : Epeak in keV
Epeak_90err: 90% error of Epeak
Norm       : normalization at 50 keV in both the PL model and CPL model
Nomr_90err : 90% error of the normalization
chi2       : Chi-Squared
dof        : degree of freedo

=== Time-averaged spectral analysis ===
(Best model with acceptable fit: PL)

Model Ph_index Ph_90err_low Ph_90err_hi  Epeak  Epeak_90err_low  Epeak_90err_hi  Norm       Nomr_90err_low    Norm_90err_hi    chi2    dof
PL      -1.202    -0.104      0.106       -           -               -         2.34e-02     -1.54e-03          1.53e-03      62.040   57
CPL     -0.579    -0.441      0.491      135.503     -35.173       170.666      4.37e-02     -1.54e-02          2.63e-02      56.040   56


=== 1-s peak spectral analysis ===
(Best model with acceptable fit: N/A)

Model Ph_index Ph_90err_low Ph_90err_hi  Epeak  Epeak_90err_low  Epeak_90err_hi  Norm       Nomr_90err_low    Norm_90err_hi    chi2    dof
PL      -1.227     -0.257     0.264       -           -               -         5.27e-02     -1.01e-02          1.00e-02      64.910   57
CPL      1.297     -1.420     2.033       78.251     -13.699        27.208      6.39e-01     -6.39e-01          3.37e+00      53.860   56


=== Fluence/Peak Flux Summary ===

              Model    Band1     Band2     Band3     Band4     Band5     Total
                       15-25     25-50    50-100    100-350    15-150    15-350    keV
Fluence         PL   7.04e-07  1.55e-06  2.70e-06  1.09e-05  7.39e-06  1.59e-05   erg/cm2
      90%_error_low -8.96e-08 -1.25e-07 -1.83e-07 -1.53e-06 -4.79e-07 -1.63e-06   erg/cm2
      90%_error_hi   9.37e-08  1.25e-07  1.82e-07  1.68e-06  4.80e-07  1.75e-06   erg/cm2
Peak flux       PL   2.17e-04  2.16e-03  3.07e-02  2.65e+00  1.41e-01  2.64e+00   ph/cm2/s
      90%_error_low -3.76e-05 6.71e-05 -5.48e-03 -4.64e-01 -2.68e-02 -4.30e-01   ph/cm2/s
      90%_error_hi   2.30e-04  2.97e-03  2.23e-02  1.35e+00  8.91e-02  1.45e+00   ph/cm2/s

Fluence        CPL   1.66e-07  2.17e-07  2.17e-07  4.86e-07  7.29e-07  1.08e-06   erg/cm2
      90%_error_low    N/A       N/A       N/A       N/A       N/A       N/A      erg/cm2
      90%_error_hi     N/A       N/A       N/A       N/A       N/A       N/A      erg/cm2
Peak flux      CPL   8.29e-01  2.21e+00  2.38e+00  7.32e-01  6.01e+00  6.15e+00   ph/cm2/s
      90%_error_low -4.90e-01 -5.89e-01 -5.00e-01 -4.14e-01 -1.21e+00 -1.28e+00   ph/cm2/s
      90%_error_hi   6.50e-01  5.75e-01  5.20e-01  6.57e-01  1.24e+00  1.34e+00   ph/cm2/s

======================================================================
Image
Pre-slew 15.0-350.0 keV image (Event data)
#   RAcent    DECcent   POSerr    Theta     Phi              Peak Cts       SNR   Name
  126.4434   -20.2516   0.0118    56.3270    -4.3011        10.8558042     16.327 TRIG_00903158

Foreground time interval of the image:
-24.272   6.880 (delta_t =  31.152 [sec])
Background time interval of the image:
-86.867 -24.272 (delta_t =  62.595 [sec])
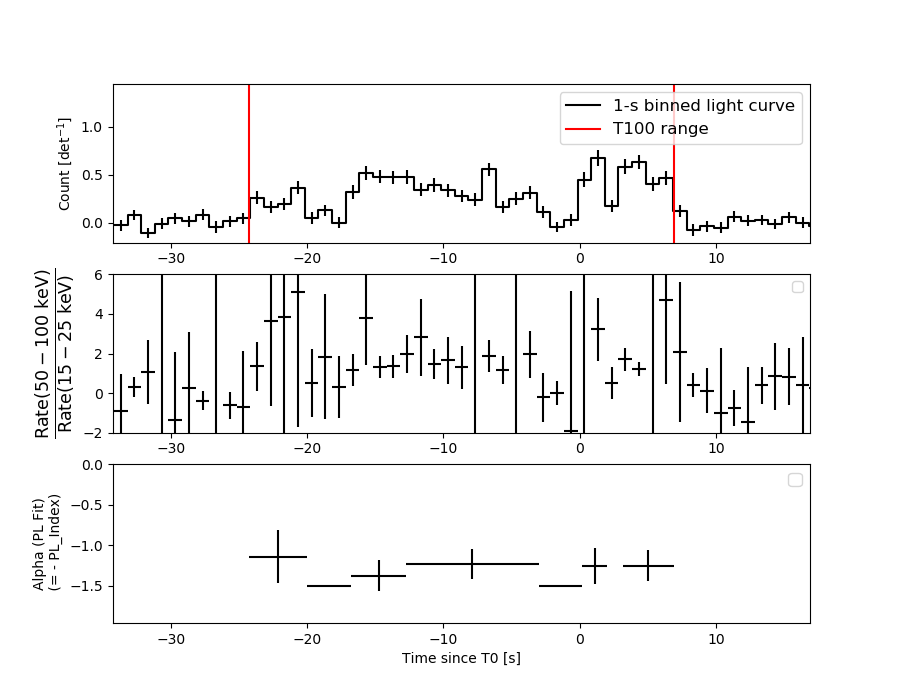
Light Curves
Note: The mask-weighted lightcurves have units of either count/det or counts/sec/det, where a det is 0.4 x 0.4 = 0.16 sq cm.
Full-time range; 1 s binning
Other quick-look light curves:
- 64 ms binning (zoomed)
- 16 ms binning (zoomed)
- 8 ms binning (zoomed)
- 2 ms binning (zoomed)
- SN=5 or 10 s binning (full-time range)
- Raw light curve
Spectra
- 64 ms binning (zoomed)
- 16 ms binning (zoomed)
- 8 ms binning (zoomed)
- 2 ms binning (zoomed)
- SN=5 or 10 s binning (full-time range)
- Raw light curve
Spectra
Notes:
- 1) The fitting includes the systematic errors.
- 2) When the burst includes telescope slew time periods, the fitting uses an average response file made from multiple 5-s response files through out the slew time plus single time preiod for the non-slew times, and weighted by the total counts in the corresponding time period using addrmf. An average response file is needed becuase a spectral fit using the pre-slew DRM will introduce some errors in both a spectral shape and a normalization if the PHA file contains a lot of the slew/post-slew time interval.
- 3) For fits to more complicated models (e.g. a power-law over a cutoff power-law), the BAT team has decided to require a chi-square improvement of more than 6 for each extra dof.
Time averaged spectrum fit using the average DRM
Power-law model
Time interval is from  -24.272 sec. to    6.880 sec.

Spectral model in power-law:
------------------------------------------------------------
Parameters  : value       lower 90%   higher 90%
Photon index: -1.20163     ( -0.103783   0.105733 )
Norm@50keV  : 2.33828E-02    ( -0.00154041   0.0015348 )
------------------------------------------------------------
#Fit statistic : Chi-Squared =          62.04 using 59 PHA bins.
# Reduced chi-squared =          1.088 for     57 degrees of freedom
# Null hypothesis probability =   3.012905e-01

Photon flux (15-150 keV)    in 31.15 sec: 2.74531 ( -0.19428  0.19508 ) ph/cm2/s
Energy fluence (15-150 keV)             : 7.387e-06 ( -4.79071e-07  4.79794e-07 ) ergs/cm2
Cutoff power-law model
Time interval is from  -24.272 sec. to    6.880 sec.
Spectral model in the cutoff power-law:
------------------------------------------------------------
Parameters  : value       lower 90%   higher 90%
Photon index: -0.579282     ( -0.441394   0.490712 )
Epeak [keV] : 135.503      ( -35.1735 170.666 )
Norm@50keV  : 4.36972E-02    ( -0.0153597   0.0262939 )
------------------------------------------------------------
#Fit statistic : Chi-Squared =          56.04 using 59 PHA bins.
# Reduced chi-squared =          1.001 for     56 degrees of freedom
# Null hypothesis probability =   4.732105e-01

Photon flux (15-150 keV)    in 31.15 sec: 2.68748 ( -0.19729  0.19844 ) ph/cm2/s
Energy fluence (15-150 keV)             : 7.29337e-07 ( 0  0 ) ergs/cm2
1-s peak spectrum fit
Power-law model
Time interval is from    0.356 sec. to    1.356 sec.

Spectral model in power-law:
------------------------------------------------------------
Parameters  : value       lower 90%   higher 90%
Photon index: -1.22708     ( -0.258082   0.263277 )
Norm@50keV  : 5.26869E-02    ( -0.0100649   0.0100323 )
------------------------------------------------------------
#Fit statistic : Chi-Squared =          64.91 using 59 PHA bins.
# Reduced chi-squared =          1.139 for     57 degrees of freedom
# Null hypothesis probability =   2.203732e-01

Photon flux (15-150 keV)    in 1 sec: 0.141097 ( -0.026836  0.08907 ) ph/cm2/s
Energy fluence (15-150 keV)             : 5.3064e-07 ( -1.01677e-07  1.01728e-07 ) ergs/cm2
Cutoff power-law model
Time interval is from    0.356 sec. to    1.356 sec.
Spectral model in the cutoff power-law:
------------------------------------------------------------
Parameters  : value       lower 90%   higher 90%
Photon index: 1.29734     ( -1.42011   2.03287 )
Epeak [keV] : 78.2510      ( -13.6989 27.2077 )
Norm@50keV  : 0.639092    ( -0.639076   3.37399 )
------------------------------------------------------------
#Fit statistic : Chi-Squared =          53.86 using 59 PHA bins.
# Reduced chi-squared =         0.9618 for     56 degrees of freedom
# Null hypothesis probability =   5.561988e-01

Photon flux (15-150 keV)    in 1 sec: 6.01150 ( -1.20986  1.23723 ) ph/cm2/s
Energy fluence (15-150 keV)             : 5.38456e-07 ( -1.06291e-07  1.05951e-07 ) ergs/cm2
Time-resolved spectra
Distribution
T90 vs. Hardness ratio plot
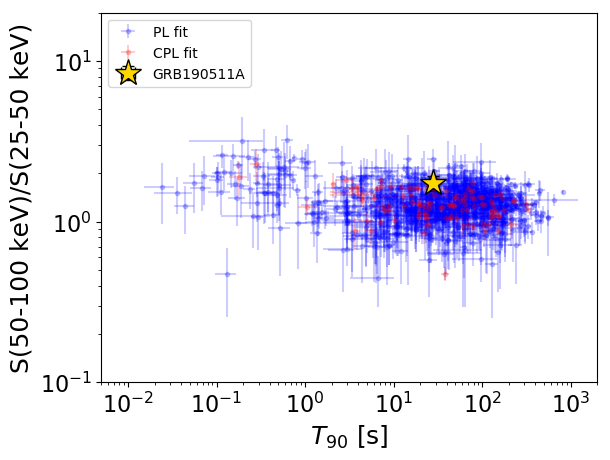
T90                                   = 27.664 sec.
Hardness ratio (energy fluence ratio) = 1.73916187344
S(15-50 keV) vs. S(50-150 keV) plot
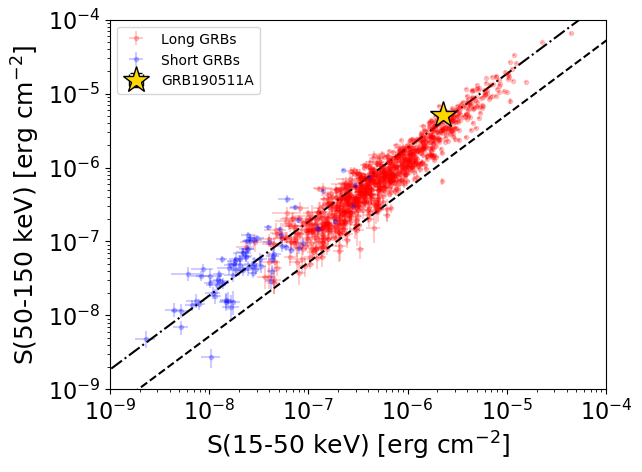
S(15-50 keV)  = 2.2568085e-06
S(50-150 keV) = 5.130248e-06
The dash-dotted line and the dashed line traces the fluences calculated from the Band function with Epeak = 15 and 150 keV, respectively. Both lines assume a canonical values of alpha = -1 and beta = -2.5.
Mask shadow pattern
IMX = 1.496742258843311E+00, IMY = 1.125690093231964E-01
Spacecraft aspect plot
Bright source in the pre-burst/pre-slew/post-slew images
Pre-burst image of 15-350 keV band
Time interval of the image:
-86.867410 -24.272000

# RAcent  DECcent POSerr Theta    Phi  PeakCts   SNR AngSep     Name
#  [deg]    [deg]    ['] [deg]  [deg]                   [']
135.3590 -40.4426   24.5  36.7    8.4   0.1135   0.5   10.3	Vela X-1
169.8903 -60.5931    0.0  23.3   63.1   0.6220   2.9   12.7	Cen X-3
186.3288 -62.7395    6.4  25.3   82.2   0.4710   1.8    9.2	GX 301-2
171.6895 -44.1029    2.2  39.0   52.8   2.2565   5.2 ------	UNKNOWN
266.4484 -64.4962    2.0  37.7  144.6   2.0247   5.7 ------	UNKNOWN
 26.8906 -66.8900    2.9  26.9 -133.4   0.6928   3.9 ------	UNKNOWN
 30.0234 -47.5496    2.6  43.8 -116.3   3.0617   4.4 ------	UNKNOWN
 25.4684 -47.1699    2.0  45.2 -120.3   3.9537   5.8 ------	UNKNOWN
Pre-slew background subtracted image of 15-350 keV band
Time interval of the image:
-24.272000 6.880000

# RAcent  DECcent POSerr Theta    Phi  PeakCts   SNR AngSep     Name
#  [deg]    [deg]    ['] [deg]  [deg]                   [']
135.5987 -40.4987    7.6  36.7    8.8   0.2556   1.5    4.6	Vela X-1
170.6200 -60.6916   15.2  23.4   64.0  -0.1279  -0.8    9.8	Cen X-3
186.7802 -62.6371    4.1  25.5   82.4  -0.5405  -2.9    8.7	GX 301-2
202.1766 -53.5374    3.2  37.2   88.6   1.6709   3.6 ------	UNKNOWN
269.6777 -58.7741    2.8  43.6  145.4   1.4601   4.2 ------	UNKNOWN
126.4434 -20.2517    0.7  56.3   -4.3  10.8550  16.3 ------	UNKNOWN
 57.8676 -44.0166    2.6  40.6  -87.3   1.8523   4.5 ------	UNKNOWN
Post-slew image of 15-350 keV band
Time interval of the image:
112.132600 384.432590

# RAcent  DECcent POSerr Theta    Phi  PeakCts   SNR AngSep     Name
#  [deg]    [deg]    ['] [deg]  [deg]                   [']
135.7497 -40.5019    6.3  21.8  140.1   1.2612   1.8   10.6	Vela X-1
123.0442  27.1198    2.1  47.5  -24.6   6.1906   5.4 ------	UNKNOWN
 79.9930 -18.3853    2.4  43.7 -116.3  12.0247   4.8 ------	UNKNOWN