Analysis Summary
Notes:
- 1) No attempt has been made to eliminate the non-significant decimal places.
- 2) This batgrbproduct analysis is done using the HEASARC data.
- 3) This batgrbproduct analysis is using the flight position for the mask-weighting calculation.
======================================================================
                  BAT GRB EVENT DATA PROCESSING REPORT
    Process Script Ver: batgrbproduct v2.46
    Process Start Time: Mon Jul 15 18:59:25 EDT 2019
             Host Name: bat1
   Current Working Dir: /local/data/bat1/alien/Swift_3rdBATcatalog/event/batevent_reproc/trigger904394
======================================================================

  Trigger: 00904394      Segment: 000

  BAT Trigger Time: 579943562.368   [s; MET]
      Trigger Stop: 579943562.88   [s; MET]
               UTC: 2019-05-19T07:25:39.438900    [includes UTCF correction]
       Where From?: TDRSS position message

  BAT
    RA: 114.764434750018   Dec: -38.8241293159876  [deg; J2000]

     Catalogged Source?: NO
     Point Source?:      YES
     GRB Indicated?:     YES    [ by BAT flight software ]
     Image S/N Ratio:    6.76
     Image Trigger?:     NO
     Rate S/N Ratio:     45.0222167379617  [ if not an image trigger ]
     Image S/N Ratio:    6.76

  Analysis Position:   [ source = BAT ]
    RA: 114.764434750018   Dec: -38.8241293159876  [deg; J2000]

  Refined Position:   [ source = BAT pre-slew burst ]
    RA: 114.756667817351   Dec: -38.8137924943174  [deg; J2000]
        { 07h 39m 01.6s , -38d 48' 49.7" }
         +/- 1.66512971456172 [arcmin] (estimated 90% radius based on SNR)
         +/- 0.672961569435034 [arcmin] (formal 1-sigma fit error)
    SNR: 14.6812824118911

  Angular difference between the analysis and refined position is 0.718674 arcmin

  Partial Coding Fraction: 0.08105469    [ including projection effects ]

  Duration
     T90: 44.4800000190735 +/- 2.58586929632961
        Measured from: -41.6720000505447
                   to: 2.80799996852875     [s; relative to TRIGTIME]
     T50: 26.7200000286102 +/- 1.3555691946078
        Measured from: -27.0160000324249
                   to: -0.296000003814697     [s; relative to TRIGTIME]


  Fluence
     Peak Flux  (peak 1 second)
        Measured from: -0.212000012397766
                   to: 0.787999987602234     [s; relative to TRIGTIME]
     Total Fluence
        Measured from: -52.472000002861
                   to: 5.62399995326996     [s; relative to TRIGTIME]

             Band 1     Band 2     Band 3     Band 4
              15-25      25-50     50-100    100-350     keV
 Total     8.136554  11.021014   7.686798   1.659554
           0.262051   0.288001   0.256864   0.179598 [error]
 Peak      0.484875   0.964724   0.858259   0.305616
           0.054709   0.072380   0.071790   0.043408 [error]

     [ fluence units of on-axis counts / fully illuminated detector ]

======================================================================


====== Table of the duration information =============================

        Value   tstart    tstop
T100   58.096  -52.472    5.624
T90    44.480  -41.672    2.808
T50    26.720  -27.016   -0.296
Peak    1.000   -0.212    0.788


====== Spectral Analysis Summary =====================================

Model      : spectral model: simple power-law (PL) and cutoff power-law (CPL)
Ph_index   : photon index: E^{Ph_index}
Ph_90err   : 90% error of the photon index
Epeak      : Epeak in keV
Epeak_90err: 90% error of Epeak
Norm       : normalization at 50 keV in both the PL model and CPL model
Nomr_90err : 90% error of the normalization
chi2       : Chi-Squared
dof        : degree of freedo

=== Time-averaged spectral analysis ===
(Best model with acceptable fit: N/A)

Model Ph_index Ph_90err_low Ph_90err_hi  Epeak  Epeak_90err_low  Epeak_90err_hi  Norm       Nomr_90err_low    Norm_90err_hi    chi2    dof
PL      -1.696    -0.059      0.058       -           -               -         3.40e-02     -1.12e-03          1.12e-03      80.390   57
CPL     -1.281    -0.229      0.243       90.950     -16.182        46.794      5.38e-02     -1.18e-02          1.61e-02      70.440   56


=== 1-s peak spectral analysis ===
(Best model with acceptable fit: N/A)

Model Ph_index Ph_90err_low Ph_90err_hi  Epeak  Epeak_90err_low  Epeak_90err_hi  Norm       Nomr_90err_low    Norm_90err_hi    chi2    dof
PL      -1.361     -0.120     0.119       -           -               -         1.70e-01     -1.42e-02          1.41e-02      51.190   57
CPL     -0.342     -0.521     0.587       88.118     -15.491        36.966      5.35e-01     -2.32e-01          4.71e-01      39.030   56


=== Fluence/Peak Flux Summary ===

              Model    Band1     Band2     Band3     Band4     Band5     Total
                       15-25     25-50    50-100    100-350    15-150    15-350    keV
Fluence         PL   3.03e-06  4.94e-06  6.10e-06  1.49e-05  1.83e-05  2.90e-05   erg/cm2
      90%_error_low -1.76e-07 -1.74e-07 -2.58e-07 -1.32e-06 -6.25e-07 -1.51e-06   erg/cm2
      90%_error_hi   1.80e-07  1.74e-07  2.58e-07  1.40e-06  6.27e-07  1.57e-06   erg/cm2
Peak flux       PL   7.66e-04  1.41e-02  9.12e-02  1.43e+01  7.51e-01  1.37e+01   ph/cm2/s
      90%_error_low     N/A       N/A       N/A       N/A       N/A       N/A     ph/cm2/s
      90%_error_hi      N/A       N/A       N/A       N/A       N/A       N/A     ph/cm2/s

Fluence        CPL   2.78e-06  5.11e-06  6.30e-06  8.74e-06  1.78e-05  2.29e-05   erg/cm2
      90%_error_low -2.17e-07 -1.98e-07 -2.87e-07 -2.10e-06 -6.77e-07 -2.19e-06   erg/cm2
      90%_error_hi   2.21e-07  2.00e-07  2.90e-07  2.89e-06  6.76e-07  2.92e-06   erg/cm2
Peak flux      CPL   4.20e+00  2.99e+00  1.48e+00  1.24e+00  9.19e+00  9.89e+00   ph/cm2/s
      90%_error_low -1.21e+00 -8.34e-01 -4.49e-01 -3.32e-01 -2.55e+00 -2.60e+00   ph/cm2/s
      90%_error_hi   9.35e-01  5.81e-01  2.62e-01  4.47e-01  1.66e+00  1.62e+00   ph/cm2/s

======================================================================
Image
Pre-slew 15.0-350.0 keV image (Event data)

#   RAcent    DECcent   POSerr    Theta     Phi              Peak Cts       SNR   Name
  114.7567   -38.8138   0.0131    39.9351   128.7765        24.1439625     14.681 TRIG_00904394

Foreground time interval of the image:
-28.267   5.624 (delta_t =  33.891 [sec])
Background time interval of the image:
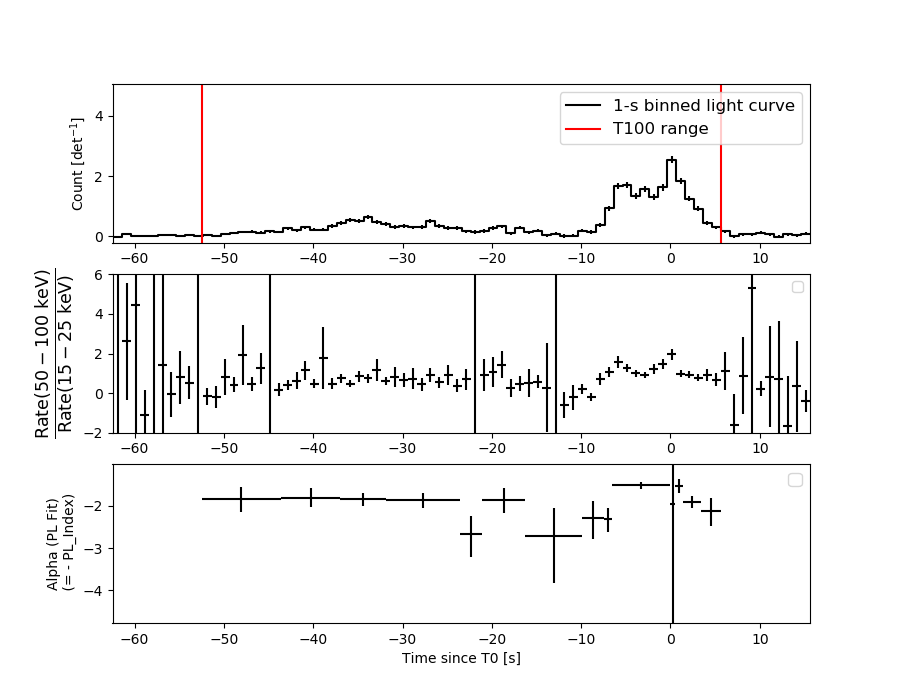
Light Curves
Note: The mask-weighted lightcurves have units of either count/det or counts/sec/det, where a det is 0.4 x 0.4 = 0.16 sq cm.
Full-time range; 1 s binning
Other quick-look light curves:
- 64 ms binning (zoomed)
- 16 ms binning (zoomed)
- 8 ms binning (zoomed)
- 2 ms binning (zoomed)
- SN=5 or 10 s binning (full-time range)
- Raw light curve
Spectra
- 64 ms binning (zoomed)
- 16 ms binning (zoomed)
- 8 ms binning (zoomed)
- 2 ms binning (zoomed)
- SN=5 or 10 s binning (full-time range)
- Raw light curve
Spectra
Notes:
- 1) The fitting includes the systematic errors.
- 2) When the burst includes telescope slew time periods, the fitting uses an average response file made from multiple 5-s response files through out the slew time plus single time preiod for the non-slew times, and weighted by the total counts in the corresponding time period using addrmf. An average response file is needed becuase a spectral fit using the pre-slew DRM will introduce some errors in both a spectral shape and a normalization if the PHA file contains a lot of the slew/post-slew time interval.
- 3) For fits to more complicated models (e.g. a power-law over a cutoff power-law), the BAT team has decided to require a chi-square improvement of more than 6 for each extra dof.
Time averaged spectrum fit using the average DRM
Power-law model
Time interval is from  -52.472 sec. to    5.624 sec.

Spectral model in power-law:
------------------------------------------------------------
Parameters  : value       lower 90%   higher 90%
Photon index: -1.69573     ( -0.0585692   0.0582495 )
Norm@50keV  : 3.39866E-02    ( -0.00112442   0.00112323 )
------------------------------------------------------------
#Fit statistic : Chi-Squared =          80.39 using 59 PHA bins.
# Reduced chi-squared =          1.410 for     57 degrees of freedom
# Null hypothesis probability =   2.233632e-02

Photon flux (15-150 keV)    in 58.1 sec: 4.50728 ( -0.15964  0.16006 ) ph/cm2/s
Energy fluence (15-150 keV)             : 1.82914e-05 ( -6.25476e-07  6.27085e-07 ) ergs/cm2
Cutoff power-law model
Time interval is from  -52.472 sec. to    5.624 sec.
Spectral model in the cutoff power-law:
------------------------------------------------------------
Parameters  : value       lower 90%   higher 90%
Photon index: -1.28087     ( -0.2293   0.242533 )
Epeak [keV] : 90.9497      ( -16.1818 46.794 )
Norm@50keV  : 5.38375E-02    ( -0.0118008   0.0161153 )
------------------------------------------------------------
#Fit statistic : Chi-Squared =          70.44 using 59 PHA bins.
# Reduced chi-squared =          1.258 for     56 degrees of freedom
# Null hypothesis probability =   9.277030e-02

Photon flux (15-150 keV)    in 58.1 sec: 4.39086 ( -0.17036  0.17094 ) ph/cm2/s
Energy fluence (15-150 keV)             : 1.78421e-05 ( -6.77405e-07  6.75558e-07 ) ergs/cm2
1-s peak spectrum fit
Power-law model
Time interval is from   -0.212 sec. to    0.788 sec.

Spectral model in power-law:
------------------------------------------------------------
Parameters  : value       lower 90%   higher 90%
Photon index: -1.36135     ( -0.119852   0.118825 )
Norm@50keV  : 0.170303    ( -0.0141603   0.0141507 )
------------------------------------------------------------
#Fit statistic : Chi-Squared =          51.19 using 59 PHA bins.
# Reduced chi-squared =         0.8980 for     57 degrees of freedom
# Null hypothesis probability =   6.919004e-01

Photon flux (15-150 keV)    in 1 sec: 0.751056 (    ) ph/cm2/s
Energy fluence (15-150 keV)             : 1.65932e-06 ( -1.48266e-07  1.48728e-07 ) ergs/cm2
Cutoff power-law model
Time interval is from   -0.212 sec. to    0.788 sec.
Spectral model in the cutoff power-law:
------------------------------------------------------------
Parameters  : value       lower 90%   higher 90%
Photon index: -0.342177     ( -0.521315   0.587335 )
Epeak [keV] : 88.1182      ( -15.4914 36.9655 )
Norm@50keV  : 0.534778    ( -0.231675   0.471308 )
------------------------------------------------------------
#Fit statistic : Chi-Squared =          39.03 using 59 PHA bins.
# Reduced chi-squared =         0.6970 for     56 degrees of freedom
# Null hypothesis probability =   9.587753e-01

Photon flux (15-150 keV)    in 1 sec: 9.19469 ( -2.55237  1.65981 ) ph/cm2/s
Energy fluence (15-150 keV)             : 6.31364e-07 ( -1.71499e-07  1.57187e-07 ) ergs/cm2
Time-resolved spectra
Distribution
T90 vs. Hardness ratio plot
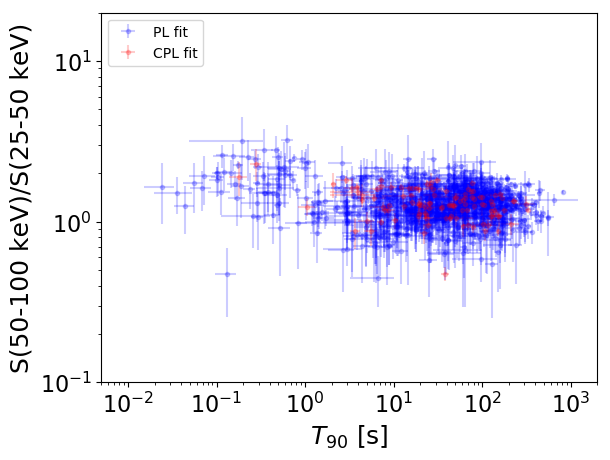
T90                                   = N/A sec.
Hardness ratio (energy fluence ratio) = N/A
S(15-50 keV) vs. S(50-150 keV) plot
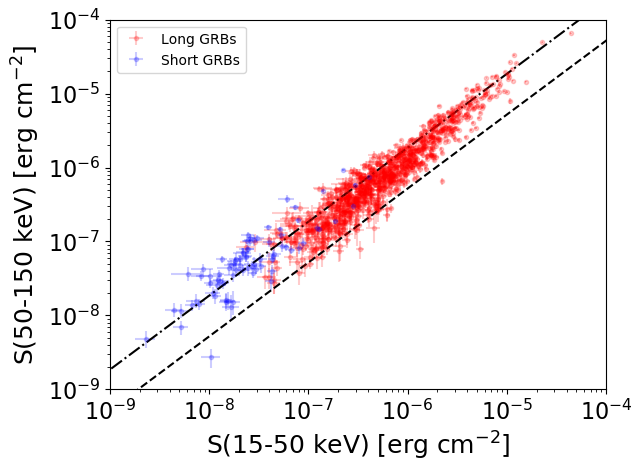
S(15-50 keV)  = N/A
S(50-150 keV) = N/A
The dash-dotted line and the dashed line traces the fluences calculated from the Band function with Epeak = 15 and 150 keV, respectively. Both lines assume a canonical values of alpha = -1 and beta = -2.5.
Mask shadow pattern
IMX = -5.243064978599906E-01, IMY = -6.526537511321755E-01
Spacecraft aspect plot
Bright source in the pre-burst/pre-slew/post-slew images
Pre-burst image of 15-350 keV band
Time interval of the image:
Pre-slew background subtracted image of 15-350 keV band
Time interval of the image:
-28.267400 5.624000

# RAcent  DECcent POSerr Theta    Phi  PeakCts   SNR AngSep     Name
#  [deg]    [deg]    ['] [deg]  [deg]                   [']
 83.6374  22.0255    1.4  29.3  -75.9   1.3225   8.2    0.7	Crab
114.7566 -38.8138    0.8  39.9  128.8  24.1455  14.7 ------	UNKNOWN
 71.7200 -31.5376    3.0  43.0 -176.4   1.2400   3.8 ------	UNKNOWN
Post-slew image of 15-350 keV band
Time interval of the image:
74.132590 962.712000

# RAcent  DECcent POSerr Theta    Phi  PeakCts   SNR AngSep     Name
#  [deg]    [deg]    ['] [deg]  [deg]                   [']
135.7477 -40.4994    7.6  16.2   67.8   2.4832   1.5   10.5	Vela X-1
 30.3347 -56.2408    3.0  55.7 -172.9  30.6886   3.9 ------	UNKNOWN
114.6328 -10.8788    2.5  27.9  -35.2   8.4762   4.6 ------	UNKNOWN