Analysis Summary
Notes:
- 1) No attempt has been made to eliminate the non-significant decimal places.
- 2) This batgrbproduct analysis is done using the HEASARC data.
- 3) This batgrbproduct analysis is using the flight position for the mask-weighting calculation.
======================================================================
                  BAT GRB EVENT DATA PROCESSING REPORT
    Process Script Ver: batgrbproduct v2.46
    Process Start Time: Mon Jul 15 18:42:13 EDT 2019
             Host Name: bat1
   Current Working Dir: /local/data/bat1/alien/Swift_3rdBATcatalog/event/batevent_reproc/trigger908329
======================================================================

  Trigger: 00908329      Segment: 000

  BAT Trigger Time: 582115645.12   [s; MET]
      Trigger Stop: 582115646.144   [s; MET]
               UTC: 2019-06-13T10:47:02.052640    [includes UTCF correction]
       Where From?: TDRSS position message

  BAT
    RA: 305.422149308421   Dec: -4.66387279817383  [deg; J2000]

     Catalogged Source?: NO
     Point Source?:      YES
     GRB Indicated?:     YES    [ by BAT flight software ]
     Image S/N Ratio:    9.16
     Image Trigger?:     NO
     Rate S/N Ratio:     31.8904374382039  [ if not an image trigger ]
     Image S/N Ratio:    9.16

  Analysis Position:   [ source = BAT ]
    RA: 305.422149308421   Dec: -4.66387279817383  [deg; J2000]

  Refined Position:   [ source = BAT pre-slew burst ]
    RA: 305.437065736736   Dec: -4.65208286174333  [deg; J2000]
        { 20h 21m 44.9s , -04d 39' 07.5" }
         +/- 1.96945160951666 [arcmin] (estimated 90% radius based on SNR)
         +/- 1.0589482476599 [arcmin] (formal 1-sigma fit error)
    SNR: 11.5511460142017

  Angular difference between the analysis and refined position is 1.138475 arcmin

  Partial Coding Fraction: 0.1835938    [ including projection effects ]

  Duration
     T90: 160.819999933243 +/- 17.0842647385542
        Measured from: -2.23199999332428
                   to: 158.587999939919     [s; relative to TRIGTIME]
     T50: 119.759999990463 +/- 25.0265991761277
        Measured from: -0.120000004768372
                   to: 119.639999985695     [s; relative to TRIGTIME]


  Fluence
     Peak Flux  (peak 1 second)
        Measured from: 0.0119999647140503
                   to: 1.01199996471405     [s; relative to TRIGTIME]
     Total Fluence
        Measured from: -2.84800004959106
                   to: 175.651999950409     [s; relative to TRIGTIME]

             Band 1     Band 2     Band 3     Band 4
              15-25      25-50     50-100    100-350     keV
 Total     1.017011   1.441225   0.866051   0.337596
           0.150350   0.155411   0.141000   0.126658 [error]
 Peak      0.138503   0.189149   0.252131   0.106932
           0.024399   0.027960   0.028607   0.024651 [error]

     [ fluence units of on-axis counts / fully illuminated detector ]

======================================================================


====== Table of the duration information =============================

        Value   tstart    tstop
T100  178.500   -2.848  175.652
T90   160.820   -2.232  158.588
T50   119.760   -0.120  119.640
Peak    1.000    0.012    1.012


====== Spectral Analysis Summary =====================================

Model      : spectral model: simple power-law (PL) and cutoff power-law (CPL)
Ph_index   : photon index: E^{Ph_index}
Ph_90err   : 90% error of the photon index
Epeak      : Epeak in keV
Epeak_90err: 90% error of Epeak
Norm       : normalization at 50 keV in both the PL model and CPL model
Nomr_90err : 90% error of the normalization
chi2       : Chi-Squared
dof        : degree of freedo

=== Time-averaged spectral analysis ===
(Best model with acceptable fit: N/A)

Model Ph_index Ph_90err_low Ph_90err_hi  Epeak  Epeak_90err_low  Epeak_90err_hi  Norm       Nomr_90err_low    Norm_90err_hi    chi2    dof
PL      -1.754    -0.248      0.237       -           -               -         1.32e-03     -1.92e-04          1.86e-04      81.590   57
CPL     -1.752    -1.030      0.286     9999.360      N/A           N/A         1.32e-03        N/A               N/A         81.590   56


=== 1-s peak spectral analysis ===
(Best model with acceptable fit: PL)

Model Ph_index Ph_90err_low Ph_90err_hi  Epeak  Epeak_90err_low  Epeak_90err_hi  Norm       Nomr_90err_low    Norm_90err_hi    chi2    dof
PL      -1.254     -0.223     0.225       -           -               -         4.78e-02     -6.20e-03          6.19e-03      57.050   57
CPL     -0.985     -0.469     1.102      199.050    -199.050      -199.050      6.46e-02     -6.25e-02          1.49e-01      56.810   56


=== Fluence/Peak Flux Summary ===

              Model    Band1     Band2     Band3     Band4     Band5     Total
                       15-25     25-50    50-100    100-350    15-150    15-350    keV
Fluence         PL   3.81e-07  6.00e-07  7.12e-07  1.64e-06  2.17e-06  3.33e-06   erg/cm2
      90%_error_low -7.45e-08 -7.49e-08 -1.42e-07 -5.92e-07 -3.22e-07 -7.39e-07   erg/cm2
      90%_error_hi   7.75e-08  7.48e-08  1.42e-07  7.82e-07  3.28e-07  8.88e-07   erg/cm2
Peak flux       PL   1.55e+00  1.81e+00  1.52e+00  2.15e+00  5.65e+00  7.03e+00   ph/cm2/s
      90%_error_low -3.61e-01 -2.69e-01 -2.36e-01 -6.25e-01 -7.47e-01 -9.54e-01   ph/cm2/s
      90%_error_hi   3.86e-01  2.64e-01  2.32e-01  7.67e-01  7.48e-01  9.72e-01   ph/cm2/s

Fluence        CPL   3.60e-07  4.91e-07  4.45e-07  1.82e-06  2.19e-06  3.31e-06   erg/cm2
      90%_error_low -9.23e-08 -1.13e-07 -1.86e-07 -8.74e-07 -4.59e-07 -1.02e-06   erg/cm2
      90%_error_hi   6.94e-08  8.19e-08  1.16e-07  1.73e-07  1.42e-07  8.66e-07   erg/cm2
Peak flux      CPL   1.47e+00  1.85e+00  1.56e+00  1.59e+00  5.60e+00  6.47e+00   ph/cm2/s
      90%_error_low -4.54e-01 -3.00e-01 -2.68e-01 -9.83e-01 -7.75e-01 -1.32e+00   ph/cm2/s
      90%_error_hi   4.47e-01  3.17e-01  2.84e-01  7.48e-01  7.71e-01  1.25e+00   ph/cm2/s

======================================================================
Image
Pre-slew 15.0-350.0 keV image (Event data)
#   RAcent    DECcent   POSerr    Theta     Phi              Peak Cts       SNR   Name
  305.4371    -4.6521   0.0166    45.7069    31.6983         2.0634316     11.551 TRIG_00908329

Foreground time interval of the image:
 -2.848  12.381 (delta_t =  15.229 [sec])
Background time interval of the image:
-239.120  -2.848 (delta_t = 236.272 [sec])
Light Curves
Note: The mask-weighted lightcurves have units of either count/det or counts/sec/det, where a det is 0.4 x 0.4 = 0.16 sq cm.
Full-time range; 1 s binning
Other quick-look light curves:
- 64 ms binning (zoomed)
- 16 ms binning (zoomed)
- 8 ms binning (zoomed)
- 2 ms binning (zoomed)
- SN=5 or 10 s binning (full-time range)
- Raw light curve
Spectra
- 64 ms binning (zoomed)
- 16 ms binning (zoomed)
- 8 ms binning (zoomed)
- 2 ms binning (zoomed)
- SN=5 or 10 s binning (full-time range)
- Raw light curve
Spectra
Notes:
- 1) The fitting includes the systematic errors.
- 2) When the burst includes telescope slew time periods, the fitting uses an average response file made from multiple 5-s response files through out the slew time plus single time preiod for the non-slew times, and weighted by the total counts in the corresponding time period using addrmf. An average response file is needed becuase a spectral fit using the pre-slew DRM will introduce some errors in both a spectral shape and a normalization if the PHA file contains a lot of the slew/post-slew time interval.
- 3) For fits to more complicated models (e.g. a power-law over a cutoff power-law), the BAT team has decided to require a chi-square improvement of more than 6 for each extra dof.
Time averaged spectrum fit using the average DRM
Power-law model
Time interval is from   -2.848 sec. to  175.652 sec.

Spectral model in power-law:
------------------------------------------------------------
Parameters  : value       lower 90%   higher 90%
Photon index: -1.7537     ( -0.248393   0.237381 )
Norm@50keV  : 1.31706E-03    ( -0.000191791   0.000185893 )
------------------------------------------------------------
#Fit statistic : Chi-Squared =          81.59 using 59 PHA bins.
# Reduced chi-squared =          1.431 for     57 degrees of freedom
# Null hypothesis probability =   1.801042e-02

Photon flux (15-150 keV)    in 178.5 sec: 0.178341 ( -0.022392  0.022419 ) ph/cm2/s
Energy fluence (15-150 keV)             : 2.16919e-06 ( -3.22392e-07  3.28101e-07 ) ergs/cm2
Cutoff power-law model
Time interval is from   -2.848 sec. to  175.652 sec.
Spectral model in the cutoff power-law:
------------------------------------------------------------
Parameters  : value       lower 90%   higher 90%
Photon index: -2.56892     ( -0.213964   1.10212 )
Epeak [keV] : 193.252      (   )
Norm@50keV  : 5.11130E-04    (     )
------------------------------------------------------------
#Fit statistic : Chi-Squared =          80.23 using 59 PHA bins.
# Reduced chi-squared =          1.433 for     56 degrees of freedom
# Null hypothesis probability =   1.854977e-02

Photon flux (15-150 keV)    in 178.5 sec: 0.178649 ( -0.023029  0.022395 ) ph/cm2/s
Energy fluence (15-150 keV)             : 2.18791e-06 ( -4.59216e-07  1.4221e-07 ) ergs/cm2
1-s peak spectrum fit
Power-law model
Time interval is from    0.012 sec. to    1.012 sec.

Spectral model in power-law:
------------------------------------------------------------
Parameters  : value       lower 90%   higher 90%
Photon index: -1.25388     ( -0.223429   0.225241 )
Norm@50keV  : 4.77675E-02    ( -0.00619652   0.00618729 )
------------------------------------------------------------
#Fit statistic : Chi-Squared =          57.05 using 59 PHA bins.
# Reduced chi-squared =          1.001 for     57 degrees of freedom
# Null hypothesis probability =   4.731568e-01

Photon flux (15-150 keV)    in 1 sec: 5.65323 ( -0.74676  0.74787 ) ph/cm2/s
Energy fluence (15-150 keV)             : 4.77617e-07 ( -6.91754e-08  6.98148e-08 ) ergs/cm2
Cutoff power-law model
Time interval is from    0.012 sec. to    1.012 sec.
Spectral model in the cutoff power-law:
------------------------------------------------------------
Parameters  : value       lower 90%   higher 90%
Photon index: -0.984503     ( -0.469328   1.1018 )
Epeak [keV] : 199.050      ( -199.123 -199.123 )
Norm@50keV  : 6.46208E-02    ( -0.0624564   0.148884 )
------------------------------------------------------------
#Fit statistic : Chi-Squared =          56.81 using 59 PHA bins.
# Reduced chi-squared =          1.014 for     56 degrees of freedom
# Null hypothesis probability =   4.447578e-01

Photon flux (15-150 keV)    in 1 sec: 5.59812 ( -0.77509  0.77051 ) ph/cm2/s
Energy fluence (15-150 keV)             : 1.25254e-07 ( -6.71321e-08  3.31733e-08 ) ergs/cm2
Time-resolved spectra

Distribution
T90 vs. Hardness ratio plot
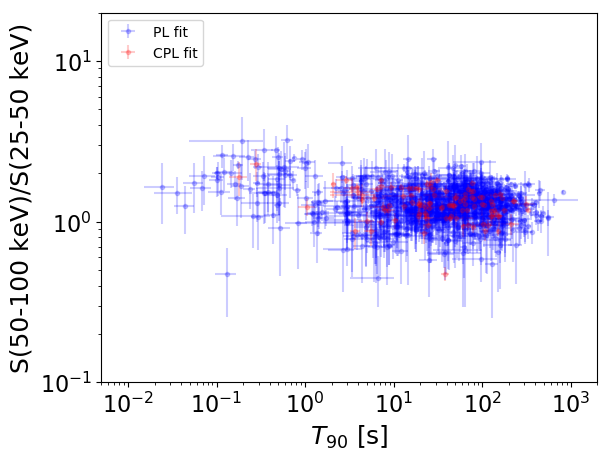
T90                                   = N/A sec.
Hardness ratio (energy fluence ratio) = N/A
S(15-50 keV) vs. S(50-150 keV) plot
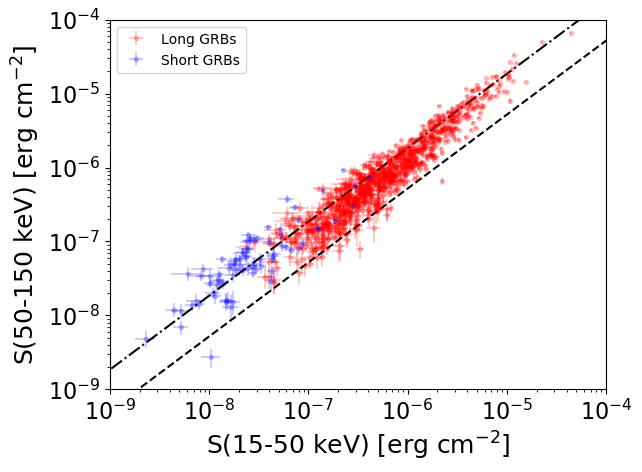
S(15-50 keV)  = N/A
S(50-150 keV) = N/A
The dash-dotted line and the dashed line traces the fluences calculated from the Band function with Epeak = 15 and 150 keV, respectively. Both lines assume a canonical values of alpha = -1 and beta = -2.5.
Mask shadow pattern
IMX = 8.720846365663342E-01, IMY = -5.385738319164157E-01
Spacecraft aspect plot

Bright source in the pre-burst/pre-slew/post-slew images
Pre-burst image of 15-350 keV band
Time interval of the image:
-239.120000 -2.848000

# RAcent  DECcent POSerr Theta    Phi  PeakCts   SNR AngSep     Name
#  [deg]    [deg]    ['] [deg]  [deg]                   [']
254.4162  35.2952    4.8  18.1 -174.7  -1.2544  -2.4    3.5	Her X-1
268.4469  -1.5420    9.6  33.2   88.7  -1.0691  -1.2    7.2	SW J1753.5-0127
288.6931  10.9263    3.7  23.5   41.5   1.7173   3.1    6.3	GRS 1915+105
299.6014  35.2068    0.9  20.6  -32.5   7.9547  13.5    0.6	Cyg X-1
308.1802  40.7617    5.7  28.1  -43.7  -1.4263  -2.0   11.9	Cyg X-3
326.3432  38.2743    7.9  42.0  -38.6   1.4626   1.5    8.6	Cyg X-2
240.0140  26.8018    2.1  31.2  167.2   3.7882   5.4 ------	UNKNOWN
331.7427   8.6370    2.7  56.8   -3.6   5.9998   4.3 ------	UNKNOWN
Pre-slew background subtracted image of 15-350 keV band
Time interval of the image:
-2.848000 12.380600

# RAcent  DECcent POSerr Theta    Phi  PeakCts   SNR AngSep     Name
#  [deg]    [deg]    ['] [deg]  [deg]                   [']
254.4821  35.1988   10.5  18.0 -175.0   0.0643   1.1    8.7	Her X-1
268.5236  -1.3326    0.0  33.0   88.6  -0.1323  -0.9   11.8	SW J1753.5-0127
288.7239  11.0362    5.8  23.4   41.3  -0.1463  -2.0    7.0	GRS 1915+105
299.8137  35.2404   10.8  20.8  -32.5   0.0681   1.1   11.2	Cyg X-1
308.2628  41.0423   18.4  28.2  -44.3   0.0409   0.6    8.8	Cyg X-3
326.1708  38.3200 1136.9  41.9  -38.6   0.0010   0.0    0.1	Cyg X-2
305.4370  -4.6521    1.0  45.7   31.7   2.0625  11.5 ------	UNKNOWN
Post-slew image of 15-350 keV band
Time interval of the image:
85.980600 962.922000

# RAcent  DECcent POSerr Theta    Phi  PeakCts   SNR AngSep     Name
#  [deg]    [deg]    ['] [deg]  [deg]                   [']
268.3648  -1.4402   39.1  37.1  122.0  -1.1550  -0.3    0.8	SW J1753.5-0127
270.3543 -25.0869    6.5  39.3   83.3   5.5277   1.8    3.8	GX 5-1
270.3413 -25.6117    7.1  39.6   82.6  -5.0591  -1.6    8.2	GRS 1758-258
274.0016 -14.1228    4.2  32.4   99.0   6.5128   2.7    5.2	GX 17+2
276.1352 -30.4198    8.4  37.7   71.7   4.0280   1.4   11.3	H1820-303
284.8916 -24.9900   12.8  28.3   70.3  -1.8726  -0.9    8.9	HT1900.1-2455
288.6617  10.9010    5.4  22.8  161.3   3.7781   2.1    8.5	GRS 1915+105
299.5763  35.1896    1.3  40.2 -159.2  28.2607   8.8    1.0	Cyg X-1
308.1719  40.9514    6.0  45.7 -148.9   8.3143   1.9    2.8	Cyg X-3
326.2894  38.2826    6.1  47.1 -129.4  17.2764   1.9    6.0	Cyg X-2
305.8205 -13.3250    2.5   8.7   25.6   8.7815   4.7 ------	UNKNOWN
339.3627 -44.3602    2.7  49.6   -3.4  13.5769   4.2 ------	UNKNOWN
341.3072  15.4164    2.3  40.8  -92.0  45.3781   5.0 ------	UNKNOWN