Analysis Summary
Notes:
- 1) No attempt has been made to eliminate the non-significant decimal places.
- 2) This batgrbproduct analysis is done using the HEASARC data.
- 3) This batgrbproduct analysis is using the flight position for the mask-weighting calculation.
======================================================================
                  BAT GRB EVENT DATA PROCESSING REPORT
    Process Script Ver: batgrbproduct v2.46
    Process Start Time: Mon Jul 15 18:28:16 EDT 2019
             Host Name: bat1
   Current Working Dir: /local/data/bat1/alien/Swift_3rdBATcatalog/event/batevent_reproc/trigger912239
======================================================================

  Trigger: 00912239      Segment: 000

  BAT Trigger Time: 583631602.688   [s; MET]
      Trigger Stop: 583631603.712   [s; MET]
               UTC: 2019-06-30T23:52:59.523940    [includes UTCF correction]
       Where From?: TDRSS position message

  BAT
    RA: 293.908248688796   Dec: -32.7512118392696  [deg; J2000]

     Catalogged Source?: NO
     Point Source?:      YES
     GRB Indicated?:     YES    [ by BAT flight software ]
     Image S/N Ratio:    9.75
     Image Trigger?:     NO
     Rate S/N Ratio:     16.0934769394311  [ if not an image trigger ]
     Image S/N Ratio:    9.75

  Analysis Position:   [ source = BAT ]
    RA: 293.908248688796   Dec: -32.7512118392696  [deg; J2000]

  Refined Position:   [ source = BAT pre-slew burst ]
    RA: 293.888887714276   Dec: -32.7586849844032  [deg; J2000]
        { 19h 35m 33.3s , -32d 45' 31.3" }
         +/- 1.09922420824592 [arcmin] (estimated 90% radius based on SNR)
         +/- 0.366849123646238 [arcmin] (formal 1-sigma fit error)
    SNR: 26.5719660035397

  Angular difference between the analysis and refined position is 1.074930 arcmin

  Partial Coding Fraction: 0.578125    [ including projection effects ]

  Duration
     T90: 38.3839999437332 +/- 9.30888533061143
        Measured from: -0.587999939918518
                   to: 37.7960000038147     [s; relative to TRIGTIME]
     T50: 16.0239999294281 +/- 2.74427771156556
        Measured from: 3.23600006103516
                   to: 19.2599999904633     [s; relative to TRIGTIME]


  Fluence
     Peak Flux  (peak 1 second)
        Measured from: -0.120000004768372
                   to: 0.879999995231628     [s; relative to TRIGTIME]
     Total Fluence
        Measured from: -1.91999995708466
                   to: 50.2319999933243     [s; relative to TRIGTIME]

             Band 1     Band 2     Band 3     Band 4
              15-25      25-50     50-100    100-350     keV
 Total     1.489289   1.730674   0.782925   0.256745
           0.081298   0.077880   0.067279   0.062098 [error]
 Peak      0.066898   0.084347   0.082374   0.029967
           0.011937   0.012314   0.011656   0.009949 [error]

     [ fluence units of on-axis counts / fully illuminated detector ]

======================================================================


====== Table of the duration information =============================

        Value   tstart    tstop
T100   52.152   -1.920   50.232
T90    38.384   -0.588   37.796
T50    16.024    3.236   19.260
Peak    1.000   -0.120    0.880


====== Spectral Analysis Summary =====================================

Model      : spectral model: simple power-law (PL) and cutoff power-law (CPL)
Ph_index   : photon index: E^{Ph_index}
Ph_90err   : 90% error of the photon index
Epeak      : Epeak in keV
Epeak_90err: 90% error of Epeak
Norm       : normalization at 50 keV in both the PL model and CPL model
Nomr_90err : 90% error of the normalization
chi2       : Chi-Squared
dof        : degree of freedo

=== Time-averaged spectral analysis ===
(Best model with acceptable fit: PL)

Model Ph_index Ph_90err_low Ph_90err_hi  Epeak  Epeak_90err_low  Epeak_90err_hi  Norm       Nomr_90err_low    Norm_90err_hi    chi2    dof
PL      -1.958    -0.113      0.110       -           -               -         4.77e-03     -3.28e-04          3.25e-04      58.130   57
CPL     -1.290    -0.518      0.611       44.591      -8.849        17.694      1.14e-02     -5.56e-03          1.41e-02      53.130   56


=== 1-s peak spectral analysis ===
(Best model with acceptable fit: PL)

Model Ph_index Ph_90err_low Ph_90err_hi  Epeak  Epeak_90err_low  Epeak_90err_hi  Norm       Nomr_90err_low    Norm_90err_hi    chi2    dof
PL      -1.314     -0.257     0.257       -           -               -         1.67e-02     -2.45e-03          2.44e-03      50.400   57
CPL     -1.151     -1.317     1.187      270.764    -270.764      -270.764      2.01e-02     -5.73e-03          5.33e-02      50.330   56


=== Fluence/Peak Flux Summary ===

              Model    Band1     Band2     Band3     Band4     Band5     Total
                       15-25     25-50    50-100    100-350    15-150    15-350    keV
Fluence         PL   4.89e-07  6.81e-07  7.01e-07  1.32e-06  2.29e-06  3.19e-06   erg/cm2
      90%_error_low -4.34e-08 -3.92e-08 -6.62e-08 -2.39e-07 -1.51e-07 -3.07e-07   erg/cm2
      90%_error_hi   4.43e-08  3.93e-08  6.70e-08  2.73e-07  1.53e-07  3.33e-07   erg/cm2
Peak flux       PL   5.74e-01  6.45e-01  5.19e-01  6.94e-01  1.99e+00  2.43e+00   ph/cm2/s
      90%_error_low -1.46e-01 -1.05e-01 -9.40e-02 -2.31e-01 -2.94e-01 -3.70e-01   ph/cm2/s
      90%_error_hi   1.58e-01  1.03e-01  9.24e-02  2.94e-01  2.95e-01  3.77e-01   ph/cm2/s

Fluence        CPL   4.57e-07  7.30e-07  6.74e-07  4.37e-07  2.12e-06  2.30e-06   erg/cm2
      90%_error_low -5.07e-08 -5.38e-08 -8.27e-08 -2.38e-07 -1.92e-07 -3.12e-07   erg/cm2
      90%_error_hi   5.09e-08  5.55e-08  7.71e-08  5.54e-07  1.98e-07  5.86e-07   erg/cm2
Peak flux      CPL   5.56e-01  6.55e-01  5.28e-01  5.72e-01  1.98e+00  2.31e+00   ph/cm2/s
      90%_error_low -1.83e-01 -1.13e-01 -1.01e-01 -5.72e-01 -3.06e-01 -5.25e-01   ph/cm2/s
      90%_error_hi   1.51e-01  1.23e-01  1.10e-01  2.60e-01  3.04e-01  4.72e-01   ph/cm2/s

======================================================================
Image
Pre-slew 15.0-350.0 keV image (Event data)
#   RAcent    DECcent   POSerr    Theta     Phi              Peak Cts       SNR   Name
  293.8889   -32.7587   0.0072    23.1833   136.1281         3.0209485     26.572 TRIG_00912239

Foreground time interval of the image:
 -1.920  17.613 (delta_t =  19.533 [sec])
Background time interval of the image:
-239.688  -1.920 (delta_t = 237.768 [sec])
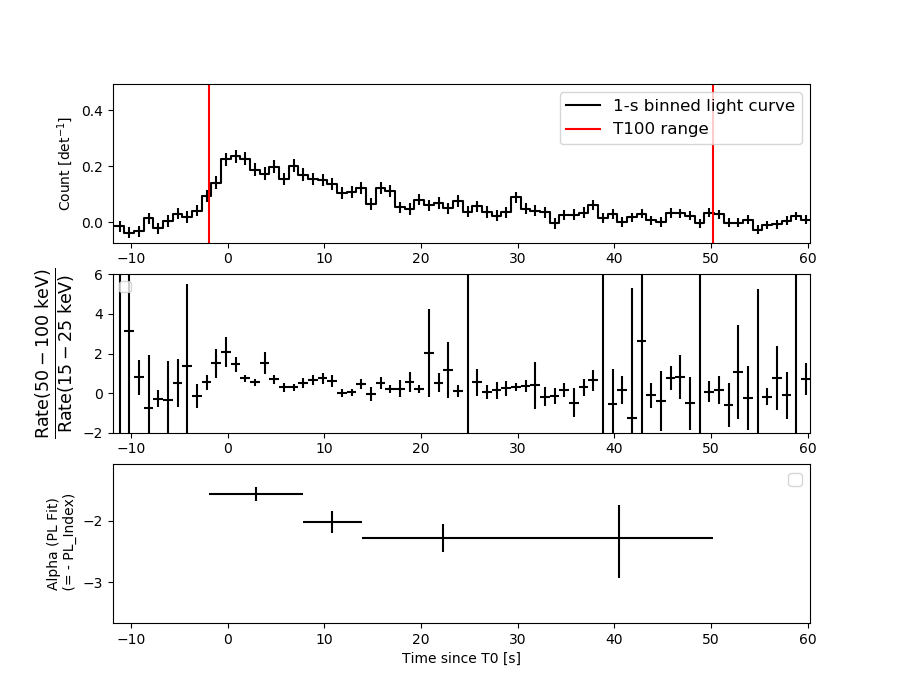
Light Curves
Note: The mask-weighted lightcurves have units of either count/det or counts/sec/det, where a det is 0.4 x 0.4 = 0.16 sq cm.
Full-time range; 1 s binning
Other quick-look light curves:
- 64 ms binning (zoomed)
- 16 ms binning (zoomed)
- 8 ms binning (zoomed)
- 2 ms binning (zoomed)
- SN=5 or 10 s binning (full-time range)
- Raw light curve
Spectra
- 64 ms binning (zoomed)
- 16 ms binning (zoomed)
- 8 ms binning (zoomed)
- 2 ms binning (zoomed)
- SN=5 or 10 s binning (full-time range)
- Raw light curve
Spectra
Notes:
- 1) The fitting includes the systematic errors.
- 2) When the burst includes telescope slew time periods, the fitting uses an average response file made from multiple 5-s response files through out the slew time plus single time preiod for the non-slew times, and weighted by the total counts in the corresponding time period using addrmf. An average response file is needed becuase a spectral fit using the pre-slew DRM will introduce some errors in both a spectral shape and a normalization if the PHA file contains a lot of the slew/post-slew time interval.
- 3) For fits to more complicated models (e.g. a power-law over a cutoff power-law), the BAT team has decided to require a chi-square improvement of more than 6 for each extra dof.
Time averaged spectrum fit using the average DRM
Power-law model
Time interval is from   -1.920 sec. to   50.232 sec.

Spectral model in power-law:
------------------------------------------------------------
Parameters  : value       lower 90%   higher 90%
Photon index: -1.95752     ( -0.112743   0.110399 )
Norm@50keV  : 4.77320E-03    ( -0.000328154   0.000324601 )
------------------------------------------------------------
#Fit statistic : Chi-Squared =          58.13 using 59 PHA bins.
# Reduced chi-squared =          1.020 for     57 degrees of freedom
# Null hypothesis probability =   4.334711e-01

Photon flux (15-150 keV)    in 52.15 sec: 0.702402 ( -0.041424  0.04148 ) ph/cm2/s
Energy fluence (15-150 keV)             : 2.29168e-06 ( -1.51233e-07  1.52957e-07 ) ergs/cm2
Cutoff power-law model
Time interval is from   -1.920 sec. to   50.232 sec.
Spectral model in the cutoff power-law:
------------------------------------------------------------
Parameters  : value       lower 90%   higher 90%
Photon index: -1.29008     ( -0.517742   0.610357 )
Epeak [keV] : 44.5909      ( -8.84666 17.6956 )
Norm@50keV  : 1.14390E-02    ( -0.00556304   0.0140927 )
------------------------------------------------------------
#Fit statistic : Chi-Squared =          53.13 using 59 PHA bins.
# Reduced chi-squared =         0.9487 for     56 degrees of freedom
# Null hypothesis probability =   5.842377e-01

Photon flux (15-150 keV)    in 52.15 sec: 0.677605 ( -0.045614  0.045461 ) ph/cm2/s
Energy fluence (15-150 keV)             : 2.11999e-06 ( -1.92137e-07  1.9812e-07 ) ergs/cm2
1-s peak spectrum fit
Power-law model
Time interval is from   -0.120 sec. to    0.880 sec.

Spectral model in power-law:
------------------------------------------------------------
Parameters  : value       lower 90%   higher 90%
Photon index: -1.31418     ( -0.257491   0.257131 )
Norm@50keV  : 1.66639E-02    ( -0.00244744   0.00243949 )
------------------------------------------------------------
#Fit statistic : Chi-Squared =          50.40 using 59 PHA bins.
# Reduced chi-squared =         0.8843 for     57 degrees of freedom
# Null hypothesis probability =   7.191400e-01

Photon flux (15-150 keV)    in 1 sec: 1.99335 ( -0.29428  0.29488 ) ph/cm2/s
Energy fluence (15-150 keV)             : 1.64127e-07 ( -2.71051e-08  2.74485e-08 ) ergs/cm2
Cutoff power-law model
Time interval is from   -0.120 sec. to    0.880 sec.
Spectral model in the cutoff power-law:
------------------------------------------------------------
Parameters  : value       lower 90%   higher 90%
Photon index: -1.15051     ( -1.31744   1.18721 )
Epeak [keV] : 270.764      ( -270.778 -270.778 )
Norm@50keV  : 2.00571E-02    ( -0.00572954   0.0533114 )
------------------------------------------------------------
#Fit statistic : Chi-Squared =          50.33 using 59 PHA bins.
# Reduced chi-squared =         0.8987 for     56 degrees of freedom
# Null hypothesis probability =   6.885154e-01

Photon flux (15-150 keV)    in 1 sec: 1.98024 ( -0.30616  0.30353 ) ph/cm2/s
Energy fluence (15-150 keV)             : 1.62301e-07 ( -2.97479e-08  2.88119e-08 ) ergs/cm2
Time-resolved spectra
Distribution
T90 vs. Hardness ratio plot
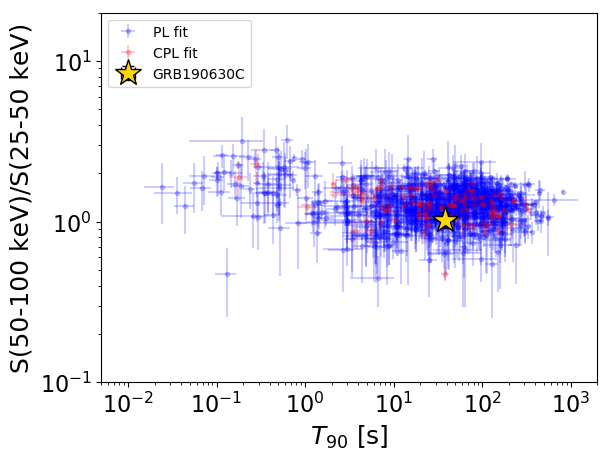
T90                                   = 38.384 sec.
Hardness ratio (energy fluence ratio) = 1.02991193648
S(15-50 keV) vs. S(50-150 keV) plot
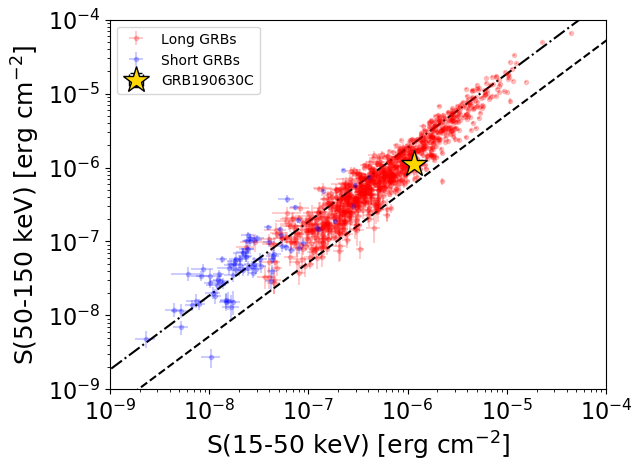
S(15-50 keV)  = 1.170319e-06
S(50-150 keV) = 1.12138e-06
The dash-dotted line and the dashed line traces the fluences calculated from the Band function with Epeak = 15 and 150 keV, respectively. Both lines assume a canonical values of alpha = -1 and beta = -2.5.
Mask shadow pattern
IMX = -3.087256181757651E-01, IMY = -2.968017969461657E-01
Spacecraft aspect plot
Bright source in the pre-burst/pre-slew/post-slew images
Pre-burst image of 15-350 keV band
Time interval of the image:
-239.688000 -1.920000

# RAcent  DECcent POSerr Theta    Phi  PeakCts   SNR AngSep     Name
#  [deg]    [deg]    ['] [deg]  [deg]                   [']
244.9983 -15.6615    1.0  26.4  -78.0   8.4416  12.1    1.7	Sco X-1
254.3554  35.3478    5.1  57.7   -9.8  -6.0254  -2.2    5.0	Her X-1
255.8835 -37.8600    6.2  23.1 -137.5   1.0255   1.9    5.0	4U 1700-377
256.2572 -36.4604    4.9  21.9 -135.6   1.2859   2.3    8.9	GX 349+2
262.8568 -24.9027    0.0  10.2 -114.5   0.4602   0.8   12.6	GX 1+4
264.6890 -44.4990    9.7  25.6 -159.6   0.6882   1.2    3.7	4U 1735-44
268.2117  -1.3241    6.9  18.9   -5.5   0.9117   1.7   12.1	SW J1753.5-0127
270.3006 -25.0795    3.2   5.7 -152.8   1.9544   3.6    0.9	GX 5-1
270.2923 -25.8592   21.8   6.4 -155.2   0.2931   0.5    7.0	GRS 1758-258
273.9717 -13.9981    4.4   5.9   22.5   1.4277   2.6    3.0	GX 17+2
275.8360 -30.5314    7.2  11.2  172.3  -0.7935  -1.6   10.9	H1820-303
285.1798 -24.8169   10.8  12.9  123.2   0.6372   1.1   10.0	HT1900.1-2455
288.6779  10.8694   17.4  34.5   36.6   0.5911   0.7    8.4	GRS 1915+105
263.0778 -33.9799    6.5  16.5 -144.1   0.8891   1.8    9.8	GX 354-0
285.3274  23.2084    2.9  44.7   24.6   4.2917   4.1 ------	UNKNOWN
311.3981 -58.6919    2.3  48.0  161.5  14.3286   5.1 ------	UNKNOWN
Pre-slew background subtracted image of 15-350 keV band
Time interval of the image:
-1.920000 17.612590

# RAcent  DECcent POSerr Theta    Phi  PeakCts   SNR AngSep     Name
#  [deg]    [deg]    ['] [deg]  [deg]                   [']
244.9173 -15.5564    6.8  26.5  -77.8   0.1699   1.7    6.2	Sco X-1
254.5630  35.2753    6.6  57.5   -9.6  -0.7252  -1.8    6.5	Her X-1
255.7997 -37.7254   10.4  23.1 -137.2   0.1008   1.1   11.4	4U 1700-377
256.3269 -36.2748   12.6  21.7 -135.3  -0.0828  -0.9   10.3	GX 349+2
263.1400 -24.6293    3.9   9.9 -113.8   0.2308   2.9   10.0	GX 1+4
264.6709 -44.5709    4.0  25.7 -159.6   0.2488   2.9    7.9	4U 1735-44
268.5058  -1.4069    3.5  18.7   -4.6   0.2566   3.3    8.7	SW J1753.5-0127
270.2864 -25.0813  233.1   5.7 -152.7   0.0039   0.0    0.2	GX 5-1
270.3144 -25.7526 2493.9   6.3 -155.0   0.0003   0.0    0.9	GRS 1758-258
274.0496 -14.1818   12.0   5.8   23.7   0.0792   1.0    9.1	GX 17+2
275.9083 -30.3887   28.3  11.1  171.7  -0.0311  -0.4    1.6	H1820-303
284.9091 -25.0986    0.0  12.7  124.8  -0.0889  -1.0   12.7	HT1900.1-2455
288.6855  10.8398    7.8  34.5   36.7   0.2169   1.5    9.2	GRS 1915+105
262.8097 -33.8025   11.9  16.5 -143.1   0.0793   1.0    9.1	GX 354-0
293.8889 -32.7587    0.4  23.2  136.1   3.0206  26.6 ------	UNKNOWN
226.0174 -37.5606    2.4  43.9 -116.5   1.5244   4.7 ------	UNKNOWN
Post-slew image of 15-350 keV band
Time interval of the image:
135.012600 414.312600

# RAcent  DECcent POSerr Theta    Phi  PeakCts   SNR AngSep     Name
#  [deg]    [deg]    ['] [deg]  [deg]                   [']
255.9796 -37.8133    6.6  31.1   36.1  -1.3937  -1.7    1.9	4U 1700-377
256.5407 -36.5314    5.5  30.7   38.7  -1.7226  -2.1    8.3	GX 349+2
262.9747 -24.5720   45.7  28.2   65.2   0.2420   0.3   10.6	GX 1+4
264.7047 -44.2941    3.6  25.3   20.8  -2.1988  -3.2    9.5	4U 1735-44
270.1521 -25.1567    6.0  22.0   70.4  -1.6004  -2.1    8.6	GX 5-1
270.2946 -25.5366    7.4  21.7   69.6  -1.2865  -1.7   12.4	GRS 1758-258
274.0483 -13.8935    8.5  26.1   97.9   1.3331   1.4    8.9	GX 17+2
276.0282 -30.4901    5.2  15.3   60.1   1.2183   2.2    9.1	H1820-303
285.0380 -24.9136   67.1  11.0   99.7   0.1026   0.2    0.4	HT1900.1-2455
288.9592  10.9618    7.5  44.0  139.3  -5.4862  -1.5    9.5	GRS 1915+105
263.0161 -33.9907  186.6  25.7   45.0  -0.0453  -0.1    9.5	GX 354-0
273.9622 -37.6430    2.7  16.9   34.0   2.3479   4.3 ------	UNKNOWN
247.9395 -54.4475    2.9  38.7    8.2   3.1149   4.0 ------	UNKNOWN
313.8512   0.8332    3.2  38.6  179.5   3.2303   3.6 ------	UNKNOWN
327.0265 -75.1647    2.1  45.3  -45.1   7.2195   5.6 ------	UNKNOWN