Analysis Summary
Notes:
- 1) No attempt has been made to eliminate the non-significant decimal places.
- 2) This batgrbproduct analysis is done using the HEASARC data.
- 3) This batgrbproduct analysis is using the flight position for the mask-weighting calculation.
======================================================================
BAT GRB EVENT DATA PROCESSING REPORT
Process Script Ver: batgrbproduct v2.46
Process Start Time: Tue Jul 30 17:44:39 EDT 2019
Host Name: bat3
Current Working Dir: /local/data/bat1/alien/Swift_3rdBATcatalog/event/batevent_reproc/trigger913302
======================================================================
Trigger: 00913302 Segment: 000
BAT Trigger Time: 584109673.28 [s; MET]
Trigger Stop: 584109674.304 [s; MET]
UTC: 2019-07-06T12:40:50.085380 [includes UTCF correction]
Where From?: TDRSS position message
BAT
RA: 107.448619293976 Dec: -29.584171873363 [deg; J2000]
Catalogged Source?: NO
Point Source?: YES
GRB Indicated?: YES [ by BAT flight software ]
Image S/N Ratio: 9.14
Image Trigger?: NO
Rate S/N Ratio: 12.328828005938 [ if not an image trigger ]
Image S/N Ratio: 9.14
Analysis Position: [ source = BAT ]
RA: 107.448619293976 Dec: -29.584171873363 [deg; J2000]
Refined Position: [ source = BAT pre-slew burst ]
RA: 107.450265280143 Dec: -29.5739805974466 [deg; J2000]
{ 07h 09m 48.1s , -29d 34' 26.3" }
+/- 2.16083749792179 [arcmin] (estimated 90% radius based on SNR)
+/- 1.02570833824434 [arcmin] (formal 1-sigma fit error)
SNR: 10.1178164735136
Angular difference between the analysis and refined position is 0.617479 arcmin
Partial Coding Fraction: 0.6953125 [ including projection effects ]
Duration
T90: 43.5839998722076 +/- 14.7978463682327
Measured from: 0.328000068664551
to: 43.9119999408722 [s; relative to TRIGTIME]
T50: 18.8799999952316 +/- 10.4651252502674
Measured from: 1.92799997329712
to: 20.8079999685287 [s; relative to TRIGTIME]
Fluence
Peak Flux (peak 1 second)
Measured from: 0.180000066757202
to: 1.1800000667572 [s; relative to TRIGTIME]
Total Fluence
Measured from: -0.248000025749207
to: 51.336000084877 [s; relative to TRIGTIME]
Band 1 Band 2 Band 3 Band 4
15-25 25-50 50-100 100-350 keV
Total 0.351747 0.484052 0.248225 -0.016946
0.060244 0.062124 0.053413 0.045769 [error]
Peak 0.046943 0.062112 0.045952 0.011018
0.009942 0.010653 0.009014 0.007101 [error]
[ fluence units of on-axis counts / fully illuminated detector ]
======================================================================
====== Table of the duration information =============================
Value tstart tstop
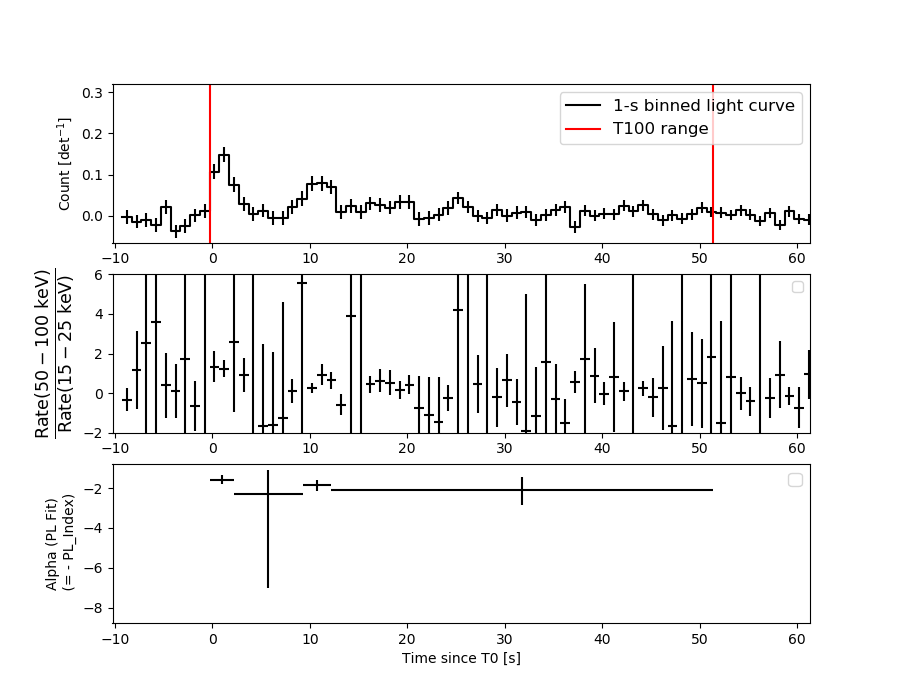
T100 51.584 -0.248 51.336
T90 43.584 0.328 43.912
T50 18.880 1.928 20.808
Peak 1.000 0.180 1.180
====== Spectral Analysis Summary =====================================
Model : spectral model: simple power-law (PL) and cutoff power-law (CPL)
Ph_index : photon index: E^{Ph_index}
Ph_90err : 90% error of the photon index
Epeak : Epeak in keV
Epeak_90err: 90% error of Epeak
Norm : normalization at 50 keV in both the PL model and CPL model
Nomr_90err : 90% error of the normalization
chi2 : Chi-Squared
dof : degree of freedo
=== Time-averaged spectral analysis ===
(Best model with acceptable fit: PL)
Model Ph_index Ph_90err_low Ph_90err_hi Epeak Epeak_90err_low Epeak_90err_hi Norm Nomr_90err_low Norm_90err_hi chi2 dof
PL -1.868 -0.281 0.264 - - - 1.37e-03 -2.53e-04 2.46e-04 59.360 57
CPL -0.918 -1.247 1.925 46.607 -46.491 -46.607 4.95e-03 -4.95e-03 6.57e-02 57.980 56
=== 1-s peak spectral analysis ===
(Best model with acceptable fit: N/A)
Model Ph_index Ph_90err_low Ph_90err_hi Epeak Epeak_90err_low Epeak_90err_hi Norm Nomr_90err_low Norm_90err_hi chi2 dof
PL -1.696 -0.295 0.283 - - - 9.99e-03 -2.02e-03 1.99e-03 73.590 57
CPL 0.185 -1.483 2.190 51.691 -10.890 34.051 1.10e-01 -1.10e-01 1.65e+00 68.560 56
=== Fluence/Peak Flux Summary ===
Model Band1 Band2 Band3 Band4 Band5 Total
15-25 25-50 50-100 100-350 15-150 15-350 keV
Fluence PL 1.28e-07 1.88e-07 2.06e-07 4.23e-07 6.51e-07 9.44e-07 erg/cm2
90%_error_low -2.72e-08 -2.86e-08 -5.00e-08 -1.74e-07 -1.17e-07 -2.35e-07 erg/cm2
90%_error_hi 2.82e-08 2.85e-08 5.10e-08 2.39e-07 1.20e-07 2.86e-07 erg/cm2
Peak flux PL 4.96e-01 4.45e-01 2.75e-01 2.58e-01 1.32e+00 1.47e+00 ph/cm2/s
90%_error_low -1.32e-01 -8.45e-02 -6.79e-02 -1.04e-01 -2.49e-01 -2.77e-01 ph/cm2/s
90%_error_hi 1.39e-01 8.42e-02 6.79e-02 1.35e-01 2.50e-01 2.78e-01 ph/cm2/s
Fluence CPL 1.19e-07 2.11e-07 1.94e-07 9.35e-08 5.88e-07 6.18e-07 erg/cm2
90%_error_low -3.15e-08 -3.71e-08 -7.23e-08 -8.38e-08 -1.32e-07 -1.60e-07 erg/cm2
90%_error_hi 3.12e-08 4.63e-08 6.02e-08 3.93e-07 1.49e-07 3.96e-07 erg/cm2
Peak flux CPL 3.99e-01 5.52e-01 2.90e-01 4.43e-02 1.28e+00 1.29e+00 ph/cm2/s
90%_error_low -1.57e-01 -1.20e-01 -9.41e-02 -4.43e-02 -2.53e-01 -2.57e-01 ph/cm2/s
90%_error_hi 1.61e-01 1.27e-01 8.75e-02 1.26e-01 2.53e-01 2.63e-01 ph/cm2/s
======================================================================
Image
Pre-slew 15.0-350.0 keV image (Event data)
#   RAcent    DECcent   POSerr    Theta     Phi              Peak Cts       SNR   Name
  107.4503   -29.5740   0.0190    34.5525  -164.1312         0.5856009     10.118 TRIG_00913302

Foreground time interval of the image:
 -0.248  10.821 (delta_t =  11.069 [sec])
Background time interval of the image:
-215.779  -0.248 (delta_t = 215.531 [sec])
Light Curves
Note: The mask-weighted lightcurves have units of either count/det or counts/sec/det, where a det is 0.4 x 0.4 = 0.16 sq cm.
Full-time range; 1 s binning
Other quick-look light curves:
- 64 ms binning (zoomed)
- 16 ms binning (zoomed)
- 8 ms binning (zoomed)
- 2 ms binning (zoomed)
- SN=5 or 10 s binning (full-time range)
- Raw light curve
Spectra
- 64 ms binning (zoomed)
- 16 ms binning (zoomed)
- 8 ms binning (zoomed)
- 2 ms binning (zoomed)
- SN=5 or 10 s binning (full-time range)
- Raw light curve
Spectra
Notes:
- 1) The fitting includes the systematic errors.
- 2) When the burst includes telescope slew time periods, the fitting uses an average response file made from multiple 5-s response files through out the slew time plus single time preiod for the non-slew times, and weighted by the total counts in the corresponding time period using addrmf. An average response file is needed becuase a spectral fit using the pre-slew DRM will introduce some errors in both a spectral shape and a normalization if the PHA file contains a lot of the slew/post-slew time interval.
- 3) For fits to more complicated models (e.g. a power-law over a cutoff power-law), the BAT team has decided to require a chi-square improvement of more than 6 for each extra dof.
Time averaged spectrum fit using the average DRM
Power-law model
Time interval is from   -0.248 sec. to   51.336 sec.

Spectral model in power-law:
------------------------------------------------------------
Parameters  : value       lower 90%   higher 90%
Photon index: -1.86849     ( -0.280983   0.263763 )
Norm@50keV  : 1.37171E-03    ( -0.000252899   0.000245787 )
------------------------------------------------------------
#Fit statistic : Chi-Squared =          59.36 using 59 PHA bins.
# Reduced chi-squared =          1.041 for     57 degrees of freedom
# Null hypothesis probability =   3.896744e-01

Photon flux (15-150 keV)    in 51.58 sec: 0.194284 ( -0.029609  0.029617 ) ph/cm2/s
Energy fluence (15-150 keV)             : 6.50537e-07 ( -1.16906e-07  1.19836e-07 ) ergs/cm2
Cutoff power-law model
Time interval is from   -0.248 sec. to   51.336 sec.
Spectral model in the cutoff power-law:
------------------------------------------------------------
Parameters  : value       lower 90%   higher 90%
Photon index: -0.917838     ( -1.24774   1.92465 )
Epeak [keV] : 46.6070      ( -46.4794 -46.5957 )
Norm@50keV  : 4.94506E-03    ( -0.00495416   0.0656984 )
------------------------------------------------------------
#Fit statistic : Chi-Squared =          57.98 using 59 PHA bins.
# Reduced chi-squared =          1.035 for     56 degrees of freedom
# Null hypothesis probability =   4.020457e-01

Photon flux (15-150 keV)    in 51.58 sec: 0.188319 ( -0.030987  0.030939 ) ph/cm2/s
Energy fluence (15-150 keV)             : 5.88058e-07 ( -1.31589e-07  1.48694e-07 ) ergs/cm2
1-s peak spectrum fit
Power-law model
Time interval is from    0.180 sec. to    1.180 sec.

Spectral model in power-law:
------------------------------------------------------------
Parameters  : value       lower 90%   higher 90%
Photon index: -1.69628     ( -0.294901   0.282413 )
Norm@50keV  : 9.98872E-03    ( -0.0020183   0.00198816 )
------------------------------------------------------------
#Fit statistic : Chi-Squared =          73.59 using 59 PHA bins.
# Reduced chi-squared =          1.291 for     57 degrees of freedom
# Null hypothesis probability =   6.865436e-02

Photon flux (15-150 keV)    in 1 sec: 1.32493 ( -0.2494  0.24966 ) ph/cm2/s
Energy fluence (15-150 keV)             : 9.25316e-08 ( -1.92154e-08  1.95024e-08 ) ergs/cm2
Cutoff power-law model
Time interval is from    0.180 sec. to    1.180 sec.
Spectral model in the cutoff power-law:
------------------------------------------------------------
Parameters  : value       lower 90%   higher 90%
Photon index: 0.185383     ( -1.49178   2.18072 )
Epeak [keV] : 51.6907      ( -10.8152 34.1253 )
Norm@50keV  : 0.109865    ( -0.111754   1.64987 )
------------------------------------------------------------
#Fit statistic : Chi-Squared =          68.56 using 59 PHA bins.
# Reduced chi-squared =          1.224 for     56 degrees of freedom
# Null hypothesis probability =   1.209515e-01

Photon flux (15-150 keV)    in 1 sec: 1.28016 ( -0.25254  0.25307 ) ph/cm2/s
Energy fluence (15-150 keV)             : 8.26266e-08 ( -1.88135e-08  2.07066e-08 ) ergs/cm2
Time-resolved spectra
Distribution
T90 vs. Hardness ratio plot
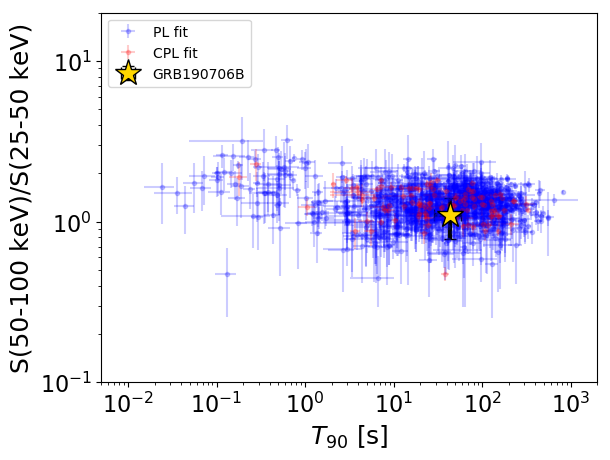
T90                                   = 43.584 sec.
Hardness ratio (energy fluence ratio) = 1.09546866961
S(15-50 keV) vs. S(50-150 keV) plot
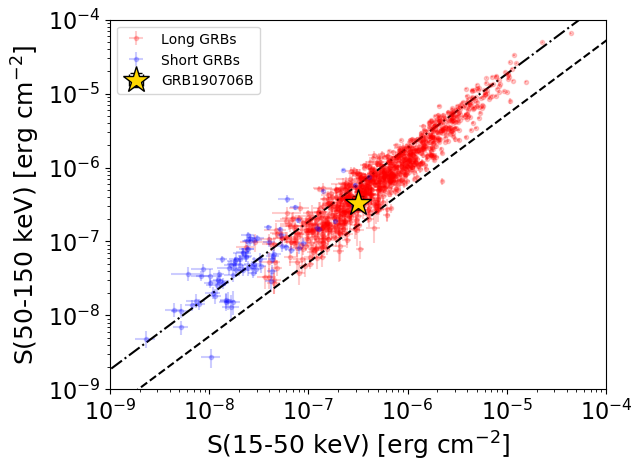
S(15-50 keV)  = 3.155772e-07
S(50-150 keV) = 3.349668e-07
The dash-dotted line and the dashed line traces the fluences calculated from the Band function with Epeak = 15 and 150 keV, respectively. Both lines assume a canonical values of alpha = -1 and beta = -2.5.
Mask shadow pattern
IMX = -6.623863088535271E-01, IMY = 1.882954361481715E-01
Spacecraft aspect plot
Bright source in the pre-burst/pre-slew/post-slew images
Pre-burst image of 15-350 keV band
Time interval of the image:
-215.779410 -0.248000

# RAcent  DECcent POSerr Theta    Phi  PeakCts   SNR AngSep     Name
#  [deg]    [deg]    ['] [deg]  [deg]                   [']
135.5574 -40.6329    5.3  28.8  147.6   1.3706   2.2    4.9	Vela X-1
182.3933  20.4387    2.3  53.2   14.1   6.4735   5.0 ------	UNKNOWN
105.1712 -27.8982    2.2  35.8 -160.2   2.8584   5.3 ------	UNKNOWN
 91.1874 -26.4370    2.3  47.6 -153.6   4.4584   5.0 ------	UNKNOWN
Pre-slew background subtracted image of 15-350 keV band
Time interval of the image:
-0.248000 10.820610

# RAcent  DECcent POSerr Theta    Phi  PeakCts   SNR AngSep     Name
#  [deg]    [deg]    ['] [deg]  [deg]                   [']
135.6880 -40.6267    9.6  28.8  147.4   0.0859   1.2    8.5	Vela X-1
107.4503 -29.5740    1.1  34.6 -164.1   0.5856  10.1 ------	UNKNOWN
Post-slew image of 15-350 keV band
Time interval of the image:
77.820590 962.785000

# RAcent  DECcent POSerr Theta    Phi  PeakCts   SNR AngSep     Name
#  [deg]    [deg]    ['] [deg]  [deg]                   [']
135.4877 -40.6043    2.6  25.3   35.9   8.0473   4.4    3.5	Vela X-1
157.3504 -35.5111    2.4  42.0   24.1  12.6426   4.7 ------	UNKNOWN
 72.1978 -14.4857    2.5  35.8 -160.2   9.1156   4.5 ------	UNKNOWN
101.7251  -3.7281    3.0  26.4 -100.4   7.6397   3.9 ------	UNKNOWN
 71.7644   8.0150    2.7  50.9 -135.5  29.5244   4.2 ------	UNKNOWN