Analysis Summary
Notes:
- 1) No attempt has been made to eliminate the non-significant decimal places.
- 2) This batgrbproduct analysis is done using the HEASARC data.
- 3) This batgrbproduct analysis is using the flight position for the mask-weighting calculation.
======================================================================
                  BAT GRB EVENT DATA PROCESSING REPORT
    Process Script Ver: batgrbproduct v2.46
    Process Start Time: Thu Aug 15 13:49:24 EDT 2019
             Host Name: bat1
   Current Working Dir: /local/data/bat1/alien/Swift_3rdBATcatalog/event/batevent_reproc/trigger915091
======================================================================

  Trigger: 00915091      Segment: 000

  BAT Trigger Time: 585117698.432   [s; MET]
      Trigger Stop: 585117698.944   [s; MET]
               UTC: 2019-07-18T04:41:15.172960    [includes UTCF correction]
       Where From?: TDRSS position message

  BAT
    RA: 336.531055639195   Dec: -41.2205538392556  [deg; J2000]

     Catalogged Source?: NO
     Point Source?:      YES
     GRB Indicated?:     YES    [ by BAT flight software ]
     Image S/N Ratio:    6.69
     Image Trigger?:     NO
     Rate S/N Ratio:     18.1383571472171  [ if not an image trigger ]
     Image S/N Ratio:    6.69

  Analysis Position:   [ source = BAT ]
    RA: 336.531055639195   Dec: -41.2205538392556  [deg; J2000]

  Refined Position:   [ source = BAT pre-slew burst ]
    RA: 336.604594815907   Dec: -41.1846234934104  [deg; J2000]
        { 22h 26m 25.1s , -41d 11' 04.6" }
         +/- 2.37820103716609 [arcmin] (estimated 90% radius based on SNR)
         +/- 1.74004162179059 [arcmin] (formal 1-sigma fit error)
    SNR: 8.82308434990661

  Angular difference between the analysis and refined position is 3.958352 arcmin

  Partial Coding Fraction: 1.015625    [ including projection effects ]

  Duration
     T90: 704 +/- 995.606347910659
        Measured from: 0.567999958992004
                   to: 704.567999958992     [s; relative to TRIGTIME]
     T50: 720 +/- 526.847226432863
        Measured from: 0.567999958992004
                   to: 720.567999958992     [s; relative to TRIGTIME]


  Fluence
     Peak Flux  (peak 1 second)
        Measured from: 8.067999958992
                   to: 9.067999958992     [s; relative to TRIGTIME]
     Total Fluence
        Measured from: 0.567999958992004
                   to: 720.567999958992     [s; relative to TRIGTIME]

             Band 1     Band 2     Band 3     Band 4
              15-25      25-50     50-100    100-350     keV
 Total    -0.098545   0.293496  -0.115436  -0.268469
           0.186895   0.192186   0.167241   0.145606 [error]
 Peak      0.009677   0.004320   0.017487   0.001762
           0.007032   0.007311   0.006346   0.005256 [error]

     [ fluence units of on-axis counts / fully illuminated detector ]

======================================================================


====== Table of the duration information =============================

        Value   tstart    tstop
T100  720.000    0.568  720.568
T90   704.000    0.568  704.568
T50   720.000    0.568  720.568
Peak    1.000    8.068    9.068


====== Spectral Analysis Summary =====================================

Model      : spectral model: simple power-law (PL) and cutoff power-law (CPL)
Ph_index   : photon index: E^{Ph_index}
Ph_90err   : 90% error of the photon index
Epeak      : Epeak in keV
Epeak_90err: 90% error of Epeak
Norm       : normalization at 50 keV in both the PL model and CPL model
Nomr_90err : 90% error of the normalization
chi2       : Chi-Squared
dof        : degree of freedo

=== Time-averaged spectral analysis ===
(Best model with acceptable fit: N/A)

Model Ph_index Ph_90err_low Ph_90err_hi  Epeak  Epeak_90err_low  Epeak_90err_hi  Norm       Nomr_90err_low    Norm_90err_hi    chi2    dof
PL      -1.500     1.500      1.500       -           -               -         0.00e+00     0.00e+00          4.26e-05      70.390   57
CPL      6.328     N/A        N/A          44.522      N/A           N/A         6.55e-01        N/A               N/A         68.680   56


=== 1-s peak spectral analysis ===
(Best model with acceptable fit: N/A)

Model Ph_index Ph_90err_low Ph_90err_hi  Epeak  Epeak_90err_low  Epeak_90err_hi  Norm       Nomr_90err_low    Norm_90err_hi    chi2    dof
PL      -0.349     -1.308     0.349       -           -               -         1.93e-03     -1.93e-03          1.45e-03      57.990   57
CPL     -0.325      N/A       N/A        9971.570      N/A           N/A         1.93e-03        N/A               N/A         57.990   56


=== Fluence/Peak Flux Summary ===

              Model    Band1     Band2     Band3     Band4     Band5     Total
                       15-25     25-50    50-100    100-350    15-150    15-350    keV
Fluence         PL   7.20e-28  7.20e-28  7.21e-28  7.21e-28  7.21e-28  8.03e-28   erg/cm2
      90%_error_low 7.20e+02 7.20e+02 7.20e+02 7.20e+02 7.20e+02 7.20e+02   erg/cm2
      90%_error_hi   -1.66e-31  0.00e+00  -8.30e-31  3.03e-06  -6.64e-31  3.03e-06   erg/cm2
Peak flux       PL   2.67e-02  5.37e-02  8.44e-02  2.93e-01  2.35e-01  4.57e-01   ph/cm2/s
      90%_error_low -2.67e-02 -5.37e-02 -8.44e-02 -2.93e-01 -2.35e-01 -2.73e-01   ph/cm2/s
      90%_error_hi   7.92e-02  6.41e-02  4.65e-02  1.01e+00  1.53e-01  8.81e-01   ph/cm2/s

Fluence        CPL   7.15e-09  1.01e-07  3.95e-08  7.14e-11  1.44e-07  1.43e-07   erg/cm2
      90%_error_low 7.20e+02 7.20e+02    N/A       N/A    7.20e+02 7.20e+02   erg/cm2
      90%_error_hi   5.32e-08  1.25e-07    N/A       N/A     2.07e-07  2.08e-07   erg/cm2
Peak flux      CPL   1.96e-02  4.93e-02  1.15e-01  2.46e-01  2.27e-01  4.04e-01   ph/cm2/s
      90%_error_low -1.96e-02 -4.93e-02 -7.28e-02 -2.46e-01 -2.27e-01     N/A     ph/cm2/s
      90%_error_hi   5.94e-02  5.32e-02  6.74e-02  2.11e-01  1.55e-01     N/A     ph/cm2/s

======================================================================
Image
Pre-slew 15.0-350.0 keV image (Event data)
#   RAcent    DECcent   POSerr    Theta     Phi              Peak Cts       SNR   Name
  336.6046   -41.1846   0.0218    10.1330    25.6601         0.5484048      8.823 TRIG_00915091

Foreground time interval of the image:
  0.568  17.669 (delta_t =  17.101 [sec])
Background time interval of the image:
-58.331   0.568 (delta_t =  58.899 [sec])
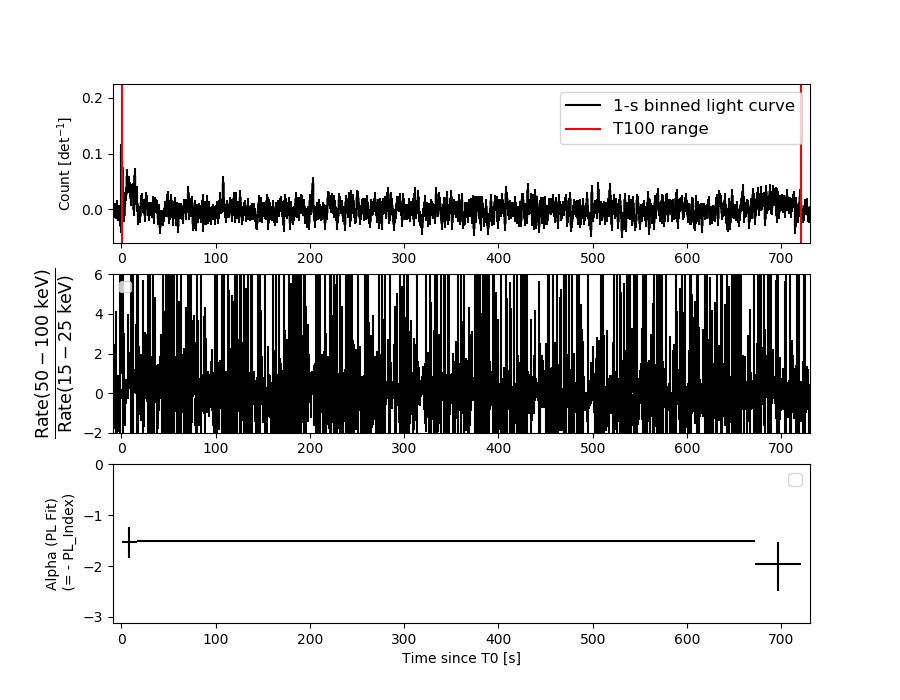
Light Curves
Note: The mask-weighted lightcurves have units of either count/det or counts/sec/det, where a det is 0.4 x 0.4 = 0.16 sq cm.
Full-time range; 1 s binning
Other quick-look light curves:
- 64 ms binning (zoomed)
- 16 ms binning (zoomed)
- 8 ms binning (zoomed)
- 2 ms binning (zoomed)
- SN=5 or 10 s binning (full-time range)
- Raw light curve
Spectra
- 64 ms binning (zoomed)
- 16 ms binning (zoomed)
- 8 ms binning (zoomed)
- 2 ms binning (zoomed)
- SN=5 or 10 s binning (full-time range)
- Raw light curve
Spectra
Notes:
- 1) The fitting includes the systematic errors.
- 2) When the burst includes telescope slew time periods, the fitting uses an average response file made from multiple 5-s response files through out the slew time plus single time preiod for the non-slew times, and weighted by the total counts in the corresponding time period using addrmf. An average response file is needed becuase a spectral fit using the pre-slew DRM will introduce some errors in both a spectral shape and a normalization if the PHA file contains a lot of the slew/post-slew time interval.
- 3) For fits to more complicated models (e.g. a power-law over a cutoff power-law), the BAT team has decided to require a chi-square improvement of more than 6 for each extra dof.
Time averaged spectrum fit using the average DRM
Power-law model
Time interval is from    0.568 sec. to  720.568 sec.

Spectral model in power-law:
------------------------------------------------------------
Parameters  : value       lower 90%   higher 90%
Photon index: -1.5     ( 1.5   1.5 )
Norm@50keV  : 0.0    ( 0   4.25539e-05 )
------------------------------------------------------------
#Fit statistic : Chi-Squared =          70.39 using 59 PHA bins.
# Reduced chi-squared =          1.235 for     57 degrees of freedom
# Null hypothesis probability =   1.095918e-01

Photon flux (15-150 keV)    in 720 sec: 4.29911E-12 ( -4.29911e-12  0.00363074 ) ph/cm2/s
Energy fluence (15-150 keV)             : 7.20828e-28 ( 720  -6.62195e-31 ) ergs/cm2
Cutoff power-law model
Time interval is from    0.568 sec. to  720.568 sec.
Spectral model in the cutoff power-law:
------------------------------------------------------------
Parameters  : value       lower 90%   higher 90%
Photon index: 9.94279     (       )
Epeak [keV] : 44.5214      (   )
Norm@50keV  : 43.4657    (     )
------------------------------------------------------------
#Fit statistic : Chi-Squared =          68.50 using 59 PHA bins.
# Reduced chi-squared =          1.223 for     56 degrees of freedom
# Null hypothesis probability =   1.219986e-01

Photon flux (15-150 keV)    in 720 sec: 3.05994E-03 ( -0.00305994  0.00465684 ) ph/cm2/s
Energy fluence (15-150 keV)             : 1.43963e-07 ( 720  2.073e-07 ) ergs/cm2
1-s peak spectrum fit
Power-law model
Time interval is from    8.068 sec. to    9.068 sec.

Spectral model in power-law:
------------------------------------------------------------
Parameters  : value       lower 90%   higher 90%
Photon index: -0.349481     ( -1.30807   0.349445 )
Norm@50keV  : 1.92630E-03    ( -0.00192626   0.00145322 )
------------------------------------------------------------
#Fit statistic : Chi-Squared =          57.99 using 59 PHA bins.
# Reduced chi-squared =          1.017 for     57 degrees of freedom
# Null hypothesis probability =   4.387097e-01

Photon flux (15-150 keV)    in 1 sec: 0.234900 ( -0.2349  0.152951 ) ph/cm2/s
Energy fluence (15-150 keV)             : 2.80175e-08 ( -1.53928e-08  1.53845e-08 ) ergs/cm2
Cutoff power-law model
Time interval is from    8.068 sec. to    9.068 sec.
Spectral model in the cutoff power-law:
------------------------------------------------------------
Parameters  : value       lower 90%   higher 90%
Photon index: -0.32465     (       )
Epeak [keV] : 9971.57      (   )
Norm@50keV  : 1.93272E-03    (     )
------------------------------------------------------------
#Fit statistic : Chi-Squared =          57.99 using 59 PHA bins.
# Reduced chi-squared =          1.035 for     56 degrees of freedom
# Null hypothesis probability =   4.019434e-01

Photon flux (15-150 keV)    in 1 sec: 0.226563 ( -0.226563  0.155392 ) ph/cm2/s
Energy fluence (15-150 keV)             : 2.50738e-08 ( -1.30926e-08  1.7271e-08 ) ergs/cm2
Time-resolved spectra
Distribution
T90 vs. Hardness ratio plot
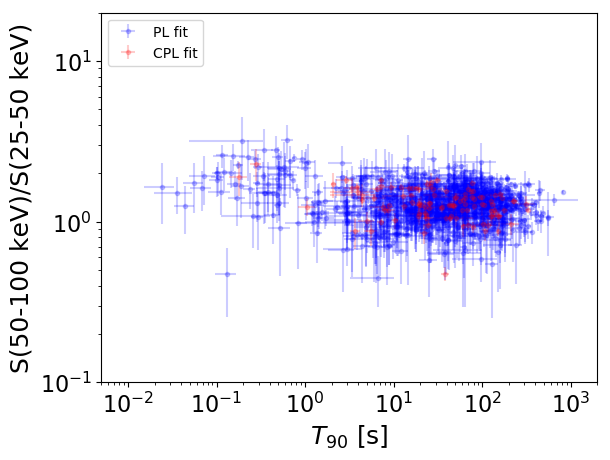
T90                                   = N/A sec.
Hardness ratio (energy fluence ratio) = N/A
S(15-50 keV) vs. S(50-150 keV) plot
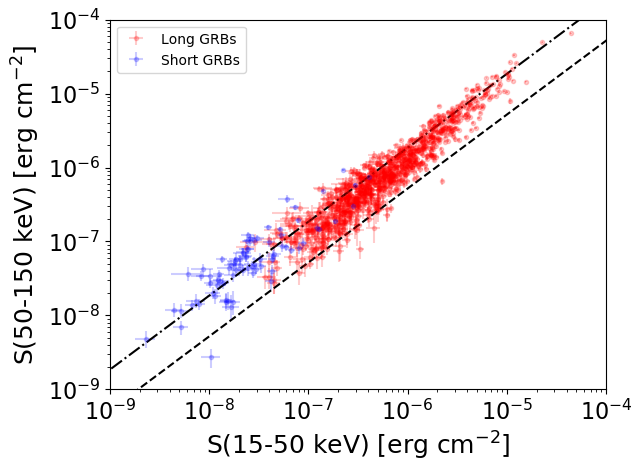
S(15-50 keV)  = N/A
S(50-150 keV) = N/A
The dash-dotted line and the dashed line traces the fluences calculated from the Band function with Epeak = 15 and 150 keV, respectively. Both lines assume a canonical values of alpha = -1 and beta = -2.5.
Mask shadow pattern
IMX = 1.610953789587414E-01, IMY = -7.739188991114443E-02
Spacecraft aspect plot
Bright source in the pre-burst/pre-slew/post-slew images
Pre-burst image of 15-350 keV band
Time interval of the image:
-58.331410 0.568000

# RAcent  DECcent POSerr Theta    Phi  PeakCts   SNR AngSep     Name
#  [deg]    [deg]    ['] [deg]  [deg]                   [']
265.8008 -81.3761    2.4  55.8    2.9   2.8084   4.9 ------	UNKNOWN
352.5788 -38.2587    2.5   8.9  -57.5   0.6270   4.6 ------	UNKNOWN
354.0227  -1.1510    2.9  33.1 -168.6   0.6939   4.1  365.2	UNKNOWN
  7.9273  20.5100    2.4  58.1 -160.6   4.1824   4.8 ------	UNKNOWN
Pre-slew background subtracted image of 15-350 keV band
Time interval of the image:
0.568000 17.668600

# RAcent  DECcent POSerr Theta    Phi  PeakCts   SNR AngSep     Name
#  [deg]    [deg]    ['] [deg]  [deg]                   [']
310.2743  -7.4639    2.0  40.2  114.4   1.5260   5.8 ------	UNKNOWN
312.8573 -12.4551    1.9  35.0  111.1   0.9284   5.9 ------	UNKNOWN
314.3789 -65.8334    1.8  37.4   12.1   0.6154   6.5 ------	UNKNOWN
336.6042 -41.1847    1.3  10.1   25.7   0.5497   8.8 ------	UNKNOWN
Post-slew image of 15-350 keV band
Time interval of the image:
50.268600 962.687700
1244.568000 1385.944700

# RAcent  DECcent POSerr Theta    Phi  PeakCts   SNR AngSep     Name
#  [deg]    [deg]    ['] [deg]  [deg]                   [']
347.5151  14.1702    2.7  56.3  173.8  55.4093   4.2 ------	UNKNOWN
348.6581  10.7127    2.6  53.1  175.9  46.1055   4.5 ------	UNKNOWN