Analysis Summary
Notes:
- 1) No attempt has been made to eliminate the non-significant decimal places.
- 2) This batgrbproduct analysis is done using the HEASARC data.
- 3) This batgrbproduct analysis is using the flight position for the mask-weighting calculation.
======================================================================
BAT GRB EVENT DATA PROCESSING REPORT
Process Script Ver: batgrbproduct v2.46
Process Start Time: Thu Aug 15 13:43:55 EDT 2019
Host Name: bat1
Current Working Dir: /local/data/bat1/alien/Swift_3rdBATcatalog/event/batevent_reproc/trigger915381
======================================================================
Trigger: 00915381 Segment: 000
BAT Trigger Time: 585241137.664 [s; MET]
Trigger Stop: 585241138.688 [s; MET]
UTC: 2019-07-19T14:58:34.397080 [includes UTCF correction]
Where From?: TDRSS position message
BAT
RA: 240.210492923109 Dec: 12.9774518761248 [deg; J2000]
Catalogged Source?: NO
Point Source?: YES
GRB Indicated?: YES [ by BAT flight software ]
Image S/N Ratio: 18.62
Image Trigger?: NO
Rate S/N Ratio: 62.3377895020348 [ if not an image trigger ]
Image S/N Ratio: 18.62
Analysis Position: [ source = BAT ]
RA: 240.210492923109 Dec: 12.9774518761248 [deg; J2000]
Refined Position: [ source = BAT pre-slew burst ]
RA: 240.207178641202 Dec: 13.0080713243865 [deg; J2000]
{ 16h 00m 49.7s , +13d 00' 29.1" }
+/- 1.2820748256695 [arcmin] (estimated 90% radius based on SNR)
+/- 0.481934229010554 [arcmin] (formal 1-sigma fit error)
SNR: 21.3283087547231
Angular difference between the analysis and refined position is 1.847357 arcmin
Partial Coding Fraction: 1.015625 [ including projection effects ]
Duration
T90: 185.827999949455 +/- 9.59720388569659
Measured from: 0.620000004768372
to: 186.447999954224 [s; relative to TRIGTIME]
T50: 99.5199999809265 +/- 6.17293445866476
Measured from: 58.8359999656677
to: 158.355999946594 [s; relative to TRIGTIME]
Fluence
Peak Flux (peak 1 second)
Measured from: 0.26800000667572
to: 1.26800000667572 [s; relative to TRIGTIME]
Total Fluence
Measured from: -0.28000009059906
to: 202.12399995327 [s; relative to TRIGTIME]
Band 1 Band 2 Band 3 Band 4
15-25 25-50 50-100 100-350 keV
Total 2.871185 3.333348 2.269811 0.422877
0.119784 0.122823 0.116945 0.126196 [error]
Peak 0.180957 0.273823 0.207818 0.056207
0.011438 0.012980 0.012113 0.010000 [error]
[ fluence units of on-axis counts / fully illuminated detector ]
======================================================================
====== Table of the duration information =============================
Value tstart tstop
T100 202.404 -0.280 202.124
T90 185.828 0.620 186.448
T50 99.520 58.836 158.356
Peak 1.000 0.268 1.268
====== Spectral Analysis Summary =====================================
Model : spectral model: simple power-law (PL) and cutoff power-law (CPL)
Ph_index : photon index: E^{Ph_index}
Ph_90err : 90% error of the photon index
Epeak : Epeak in keV
Epeak_90err: 90% error of Epeak
Norm : normalization at 50 keV in both the PL model and CPL model
Nomr_90err : 90% error of the normalization
chi2 : Chi-Squared
dof : degree of freedo
=== Time-averaged spectral analysis ===
(Best model with acceptable fit: PL)
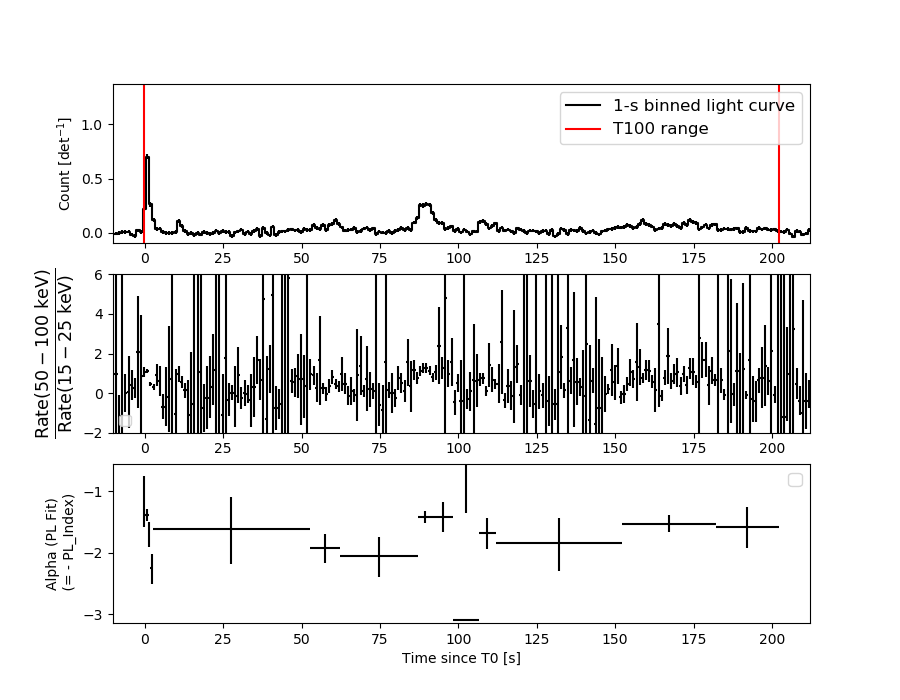
Model Ph_index Ph_90err_low Ph_90err_hi Epeak Epeak_90err_low Epeak_90err_hi Norm Nomr_90err_low Norm_90err_hi chi2 dof
PL -1.665 -0.089 0.088 - - - 2.71e-03 -1.31e-04 1.30e-04 62.500 57
CPL -1.459 -0.272 0.359 123.346 -51.024 -123.346 3.47e-03 -8.57e-04 1.82e-03 61.390 56
=== 1-s peak spectral analysis ===
(Best model with acceptable fit: PL)
Model Ph_index Ph_90err_low Ph_90err_hi Epeak Epeak_90err_low Epeak_90err_hi Norm Nomr_90err_low Norm_90err_hi chi2 dof
PL -1.389 -0.098 0.097 - - - 4.53e-02 -2.55e-03 2.54e-03 46.380 57
CPL -1.063 -0.359 0.405 142.814 -53.968 -142.814 6.63e-02 -2.18e-02 3.92e-02 44.120 56
=== Fluence/Peak Flux Summary ===
Model Band1 Band2 Band3 Band4 Band5 Total
15-25 25-50 50-100 100-350 15-150 15-350 keV
Fluence PL 8.18e-07 1.36e-06 1.71e-06 4.31e-06 5.09e-06 8.20e-06 erg/cm2
90%_error_low -6.27e-08 -6.16e-08 -1.16e-07 -6.00e-07 -2.64e-07 -6.95e-07 erg/cm2
90%_error_hi 6.44e-08 6.16e-08 1.16e-07 6.67e-07 2.67e-07 7.51e-07 erg/cm2
Peak flux PL 1.67e+00 1.80e+00 1.37e+00 1.71e+00 5.50e+00 6.56e+00 ph/cm2/s
90%_error_low -1.60e-01 -1.06e-01 -9.78e-02 -2.40e-01 -3.04e-01 -3.78e-01 ph/cm2/s
90%_error_hi 1.64e-01 1.06e-01 9.74e-02 2.64e-01 3.04e-01 3.81e-01 ph/cm2/s
Fluence CPL 7.91e-07 1.38e-06 1.72e-06 3.02e-06 4.97e-06 6.91e-06 erg/cm2
90%_error_low -7.54e-08 -7.33e-08 -1.19e-07 -1.26e-06 -3.27e-07 -1.31e-06 erg/cm2
90%_error_hi 7.66e-08 7.45e-08 1.20e-07 1.46e-06 3.29e-07 1.55e-06 erg/cm2
Peak flux CPL 1.58e+00 1.86e+00 1.41e+00 1.15e+00 5.41e+00 6.00e+00 ph/cm2/s
90%_error_low -1.90e-01 -1.24e-01 -1.06e-01 -4.08e-01 -3.18e-01 -5.29e-01 ph/cm2/s
90%_error_hi 1.93e-01 1.27e-01 1.08e-01 6.45e-01 3.18e-01 7.20e-01 ph/cm2/s
======================================================================
Image
Pre-slew 15.0-350.0 keV image (Event data)
#   RAcent    DECcent   POSerr    Theta     Phi              Peak Cts       SNR   Name
  240.2072    13.0081   0.0090    12.2229   -34.0132         1.6588231     21.328 TRIG_00915381

Foreground time interval of the image:
 -0.280  17.037 (delta_t =  17.317 [sec])
Background time interval of the image:
-102.363  -0.280 (delta_t = 102.083 [sec])
Light Curves
Note: The mask-weighted lightcurves have units of either count/det or counts/sec/det, where a det is 0.4 x 0.4 = 0.16 sq cm.
Full-time range; 1 s binning
Other quick-look light curves:
- 64 ms binning (zoomed)
- 16 ms binning (zoomed)
- 8 ms binning (zoomed)
- 2 ms binning (zoomed)
- SN=5 or 10 s binning (full-time range)
- Raw light curve
Spectra
- 64 ms binning (zoomed)
- 16 ms binning (zoomed)
- 8 ms binning (zoomed)
- 2 ms binning (zoomed)
- SN=5 or 10 s binning (full-time range)
- Raw light curve
Spectra
Notes:
- 1) The fitting includes the systematic errors.
- 2) When the burst includes telescope slew time periods, the fitting uses an average response file made from multiple 5-s response files through out the slew time plus single time preiod for the non-slew times, and weighted by the total counts in the corresponding time period using addrmf. An average response file is needed becuase a spectral fit using the pre-slew DRM will introduce some errors in both a spectral shape and a normalization if the PHA file contains a lot of the slew/post-slew time interval.
- 3) For fits to more complicated models (e.g. a power-law over a cutoff power-law), the BAT team has decided to require a chi-square improvement of more than 6 for each extra dof.
Time averaged spectrum fit using the average DRM
Power-law model
Time interval is from   -0.280 sec. to  202.124 sec.

Spectral model in power-law:
------------------------------------------------------------
Parameters  : value       lower 90%   higher 90%
Photon index: -1.66537     ( -0.0890782   0.0881746 )
Norm@50keV  : 2.70810E-03    ( -0.000131142   0.000130313 )
------------------------------------------------------------
#Fit statistic : Chi-Squared =          62.50 using 59 PHA bins.
# Reduced chi-squared =          1.097 for     57 degrees of freedom
# Null hypothesis probability =   2.871130e-01

Photon flux (15-150 keV)    in 202.4 sec: 0.355438 ( -0.016128  0.01615 ) ph/cm2/s
Energy fluence (15-150 keV)             : 5.09085e-06 ( -2.64033e-07  2.66757e-07 ) ergs/cm2
Cutoff power-law model
Time interval is from   -0.280 sec. to  202.124 sec.
Spectral model in the cutoff power-law:
------------------------------------------------------------
Parameters  : value       lower 90%   higher 90%
Photon index: -1.45876     ( -0.271551   0.35865 )
Epeak [keV] : 123.346      ( -51.0243 -123.346 )
Norm@50keV  : 3.46925E-03    ( -0.000857486   0.00181768 )
------------------------------------------------------------
#Fit statistic : Chi-Squared =          61.39 using 59 PHA bins.
# Reduced chi-squared =          1.096 for     56 degrees of freedom
# Null hypothesis probability =   2.889028e-01

Photon flux (15-150 keV)    in 202.4 sec: 0.350236 ( -0.018091  0.01808 ) ph/cm2/s
Energy fluence (15-150 keV)             : 4.96764e-06 ( -3.2719e-07  3.28631e-07 ) ergs/cm2
1-s peak spectrum fit
Power-law model
Time interval is from    0.268 sec. to    1.268 sec.

Spectral model in power-law:
------------------------------------------------------------
Parameters  : value       lower 90%   higher 90%
Photon index: -1.38902     ( -0.0976764   0.0971697 )
Norm@50keV  : 4.52520E-02    ( -0.00254767   0.00254035 )
------------------------------------------------------------
#Fit statistic : Chi-Squared =          46.38 using 59 PHA bins.
# Reduced chi-squared =         0.8136 for     57 degrees of freedom
# Null hypothesis probability =   8.415539e-01

Photon flux (15-150 keV)    in 1 sec: 5.49736 ( -0.30398  0.30412 ) ph/cm2/s
Energy fluence (15-150 keV)             : 4.38299e-07 ( -2.79532e-08  2.81777e-08 ) ergs/cm2
Cutoff power-law model
Time interval is from    0.268 sec. to    1.268 sec.
Spectral model in the cutoff power-law:
------------------------------------------------------------
Parameters  : value       lower 90%   higher 90%
Photon index: -1.06335     ( -0.359254   0.405416 )
Epeak [keV] : 142.814      ( -53.9698 -142.816 )
Norm@50keV  : 6.62738E-02    ( -0.0218284   0.039179 )
------------------------------------------------------------
#Fit statistic : Chi-Squared =          44.12 using 59 PHA bins.
# Reduced chi-squared =         0.7879 for     56 degrees of freedom
# Null hypothesis probability =   8.747406e-01

Photon flux (15-150 keV)    in 1 sec: 5.41428 ( -0.31834  0.31796 ) ph/cm2/s
Energy fluence (15-150 keV)             : 0 ( 0  0 ) ergs/cm2
Time-resolved spectra
Distribution
T90 vs. Hardness ratio plot
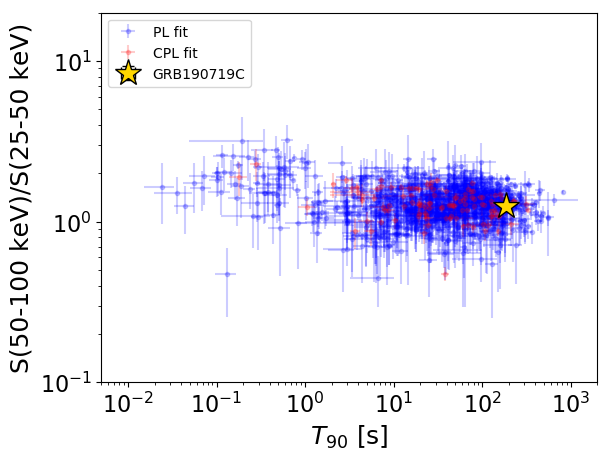
T90                                   = 185.828 sec.
Hardness ratio (energy fluence ratio) = 1.26110117141
S(15-50 keV) vs. S(50-150 keV) plot

S(15-50 keV)  = 2.1757328e-06
S(50-150 keV) = 2.915136e-06
The dash-dotted line and the dashed line traces the fluences calculated from the Band function with Epeak = 15 and 150 keV, respectively. Both lines assume a canonical values of alpha = -1 and beta = -2.5.
Mask shadow pattern
IMX = 1.795632528918745E-01, IMY = 1.211770814712049E-01
Spacecraft aspect plot
Bright source in the pre-burst/pre-slew/post-slew images
Pre-burst image of 15-350 keV band
Time interval of the image:
-102.363410 -0.280000

# RAcent  DECcent POSerr Theta    Phi  PeakCts   SNR AngSep     Name
#  [deg]    [deg]    ['] [deg]  [deg]                   [']
244.9662 -15.6911    2.0  16.9  144.8   2.3842   5.9    3.2	Sco X-1
254.4938  35.1576    0.0  36.1   -8.1   0.2004   0.4   11.2	Her X-1
256.1951 -37.7462   43.3  40.8  137.3  -0.4732  -0.3   11.5	4U 1700-377
256.3632 -36.5098  100.5  39.7  136.4  -0.1867  -0.1    6.3	GX 349+2
262.9637 -24.8117    4.6  32.7  117.8   2.0664   2.5    4.7	GX 1+4
268.4502  -1.6363   40.5  26.5   70.1   0.1697   0.3   12.1	SW J1753.5-0127
270.3529 -24.9685    7.5  37.7  109.9   2.1471   1.5    7.6	GX 5-1
270.4686 -25.7654   11.0  38.3  110.8   1.6594   1.0    9.1	GRS 1758-258
273.8147 -14.0957    0.0  34.9   91.2   2.3792   2.3   11.7	GX 17+2
263.1578 -33.7322    2.6  39.9  126.7   8.0963   4.4   10.4	GX 354-0
227.4820 -47.6256    2.4  50.2  167.3   8.6383   4.8 ------	UNKNOWN
Pre-slew background subtracted image of 15-350 keV band
Time interval of the image:
-0.280000 17.036600

# RAcent  DECcent POSerr Theta    Phi  PeakCts   SNR AngSep     Name
#  [deg]    [deg]    ['] [deg]  [deg]                   [']
244.8056 -15.6502   10.9  16.8  145.3  -0.0948  -1.1   10.1	Sco X-1
254.4278  35.4497    4.0  36.4   -8.4   0.3091   2.9    6.6	Her X-1
256.1785 -37.8408    6.4  40.9  137.4   0.5706   1.8    9.1	4U 1700-377
256.2465 -36.5147    3.8  39.7  136.6   0.8814   3.1   10.6	GX 349+2
263.0700 -24.7479   13.1  32.8  117.5  -0.1525  -0.9    3.3	GX 1+4
268.3067  -1.5743   12.0  26.4   70.0  -0.1331  -1.0    8.2	SW J1753.5-0127
270.3427 -24.9661   12.8  37.7  109.9  -0.2486  -0.9    7.5	GX 5-1
270.1275 -25.7392    9.8  38.0  111.1   0.3498   1.2    9.5	GRS 1758-258
274.0471 -13.9201    5.1  35.0   90.8  -0.5331  -2.3    7.4	GX 17+2
263.2280 -33.7442    0.0  40.0  126.7  -0.4359  -1.3   13.1	GX 354-0
285.8752  31.0084    2.6  51.2   24.1   1.5806   4.4 ------	UNKNOWN
231.8768 -46.9741    2.3  48.7  163.8   1.5114   5.0 ------	UNKNOWN
243.6319   9.1884    2.2   8.4  -14.8   0.4002   5.2 ------	UNKNOWN
240.2072  13.0081    0.5  12.2  -34.0   1.6588  21.3 ------	UNKNOWN
193.0182 -15.1886    2.4  51.1 -135.9   1.8048   4.8 ------	UNKNOWN
Post-slew image of 15-350 keV band
Time interval of the image:
49.836600 856.336600

# RAcent  DECcent POSerr Theta    Phi  PeakCts   SNR AngSep     Name
#  [deg]    [deg]    ['] [deg]  [deg]                   [']
244.9743 -15.6571    1.7  29.0  140.9  25.9920   6.5    1.1	Sco X-1
254.4577  35.3426 2700.0  25.8   -2.1   0.0078   0.0    0.0	Her X-1
268.3360  -1.4888    5.1  31.4   85.8 -12.1491  -2.3    2.9	SW J1753.5-0127
273.1820  -5.7975    3.5  37.7   88.2  26.3682   3.3 ------	UNKNOWN
213.6771  20.1050    2.6  26.4 -100.4  12.6919   4.5 ------	UNKNOWN
196.7136  17.8213    2.3  42.1 -107.3  52.2074   5.1 ------	UNKNOWN