Analysis Summary
Notes:
- 1) No attempt has been made to eliminate the non-significant decimal places.
- 2) This batgrbproduct analysis is done using the HEASARC data.
- 3) This batgrbproduct analysis is using the flight position for the mask-weighting calculation.
======================================================================
                  BAT GRB EVENT DATA PROCESSING REPORT
    Process Script Ver: batgrbproduct v2.46
    Process Start Time: Thu Aug 15 13:40:54 EDT 2019
             Host Name: bat1
   Current Working Dir: /local/data/bat1/alien/Swift_3rdBATcatalog/event/batevent_reproc/trigger916733
======================================================================

  Trigger: 00916733      Segment: 000

  BAT Trigger Time: 585951520.332   [s; MET]
      Trigger Stop: 585951520.396   [s; MET]
               UTC: 2019-07-27T20:18:17.019680    [includes UTCF correction]
       Where From?: (*SHORT BURST*) TDRSS scaled map message

  BAT
    RA: 126.480723836389   Dec: -13.2677573048208  [deg; J2000]

     Catalogged Source?: NO
     Point Source?:      YES
     GRB Indicated?:     YES    [ by BAT flight software ]
     Image S/N Ratio:    7.74
     Image Trigger?:     NO
     Rate S/N Ratio:     11.7046999107196  [ if not an image trigger ]
     Image S/N Ratio:    7.74

  Analysis Position:   [ source = BAT ]
    RA: 126.480723836389   Dec: -13.2677573048208  [deg; J2000]

  Refined Position:   [ source = BAT pre-slew burst ]
    RA: 126.499429134113   Dec: -13.2722450683654  [deg; J2000]
        { 08h 25m 59.9s , -13d 16' 20.1" }
         +/- 0.654543533499944 [arcmin] (estimated 90% radius based on SNR)
         +/- 0.174941812807845 [arcmin] (formal 1-sigma fit error)
    SNR: 55.7267002158184

  Angular difference between the analysis and refined position is 1.125049 arcmin

  Partial Coding Fraction: 0.703125    [ including projection effects ]

  Duration
     T90: 39.1959999799728 +/- 1.31134127710442
        Measured from: -17.7640000581741
                   to: 21.4319999217987     [s; relative to TRIGTIME]
     T50: 12.8399999141693 +/- 0.175727075310714
        Measured from: 0.636000037193298
                   to: 13.4759999513626     [s; relative to TRIGTIME]


  Fluence
     Peak Flux  (peak 1 second)
        Measured from: 1.13199996948242
                   to: 2.13199996948242     [s; relative to TRIGTIME]
     Total Fluence
        Measured from: -21.4880000352859
                   to: 38.9559999704361     [s; relative to TRIGTIME]

             Band 1     Band 2     Band 3     Band 4
              15-25      25-50     50-100    100-350     keV
 Total     7.174098  10.107455   8.227209   2.341905
           0.094058   0.105640   0.097163   0.073177 [error]
 Peak      0.556972   0.959297   0.889451   0.273219
           0.020702   0.025931   0.026721   0.020442 [error]

     [ fluence units of on-axis counts / fully illuminated detector ]

======================================================================


====== Table of the duration information =============================

        Value   tstart    tstop
T100   60.444  -21.488   38.956
T90    39.196  -17.764   21.432
T50    12.840    0.636   13.476
Peak    1.000    1.132    2.132


====== Spectral Analysis Summary =====================================

Model      : spectral model: simple power-law (PL) and cutoff power-law (CPL)
Ph_index   : photon index: E^{Ph_index}
Ph_90err   : 90% error of the photon index
Epeak      : Epeak in keV
Epeak_90err: 90% error of Epeak
Norm       : normalization at 50 keV in both the PL model and CPL model
Nomr_90err : 90% error of the normalization
chi2       : Chi-Squared
dof        : degree of freedo

=== Time-averaged spectral analysis ===
(Best model with acceptable fit: PL)

Model Ph_index Ph_90err_low Ph_90err_hi  Epeak  Epeak_90err_low  Epeak_90err_hi  Norm       Nomr_90err_low    Norm_90err_hi    chi2    dof
PL      -1.413    -0.032      0.032       -           -               -         3.08e-02     -5.11e-04          5.10e-04      45.570   57
CPL     -1.373    -0.052      0.089      946.008    -946.008      -946.008      3.21e-02     -1.61e-03          2.46e-03      45.930   56


=== 1-s peak spectral analysis ===
(Best model with acceptable fit: N/A)

Model Ph_index Ph_90err_low Ph_90err_hi  Epeak  Epeak_90err_low  Epeak_90err_hi  Norm       Nomr_90err_low    Norm_90err_hi    chi2    dof
PL      -1.195     -0.058     0.058       -           -               -         1.81e-01     -5.78e-03          5.78e-03      60.410   57
CPL     -1.033     -0.185     0.225      330.700    -330.700      -330.700      2.15e-01     -3.72e-02          5.60e-02      58.750   56


=== Fluence/Peak Flux Summary ===

              Model    Band1     Band2     Band3     Band4     Band5     Total
                       15-25     25-50    50-100    100-350    15-150    15-350    keV
Fluence         PL   2.20e-06  4.25e-06  6.39e-06  2.08e-05  1.80e-05  3.36e-05   erg/cm2
      90%_error_low -8.11e-08 -9.11e-08 -1.15e-07 -8.94e-07 -2.93e-07 -9.24e-07   erg/cm2
      90%_error_hi   8.25e-08  9.10e-08  1.15e-07  9.23e-07  2.93e-07  9.46e-07   erg/cm2
Peak flux       PL   1.48e-03  1.76e-02  1.90e-01  2.32e+01  1.18e+00  2.26e+01   ph/cm2/s
      90%_error_low     N/A       N/A       N/A       N/A       N/A       N/A     ph/cm2/s
      90%_error_hi      N/A       N/A       N/A       N/A       N/A       N/A     ph/cm2/s

Fluence        CPL   2.11e-06  2.78e-06  2.81e-06  6.40e-06  9.16e-06  1.34e-05   erg/cm2
      90%_error_low -1.40e-07 -1.15e-07 -1.29e-07 -2.81e-07 -4.34e-07 -6.16e-07   erg/cm2
      90%_error_hi   8.24e-08  7.27e-08  9.64e-07  3.45e-07  3.36e-07  9.76e-07   erg/cm2
Peak flux      CPL   5.36e+00  6.79e+00  5.98e+00  7.38e+00  2.11e+01  2.55e+01   ph/cm2/s
      90%_error_low -4.42e-01 -2.71e-01 -2.58e-01 -1.53e+00 -7.34e-01 -1.73e+00   ph/cm2/s
      90%_error_hi   4.49e-01  2.73e-01  2.60e-01  1.31e+00  7.34e-01  1.94e+00   ph/cm2/s

======================================================================
Image
Pre-slew 15.0-350.0 keV image (Event data)
#   RAcent    DECcent   POSerr    Theta     Phi              Peak Cts       SNR   Name
  126.4994   -13.2722   0.0034    25.5290  -112.3006        27.7263436     55.727 TRIG_00916733

Foreground time interval of the image:
-12.231  38.956 (delta_t =  51.187 [sec])
Background time interval of the image:
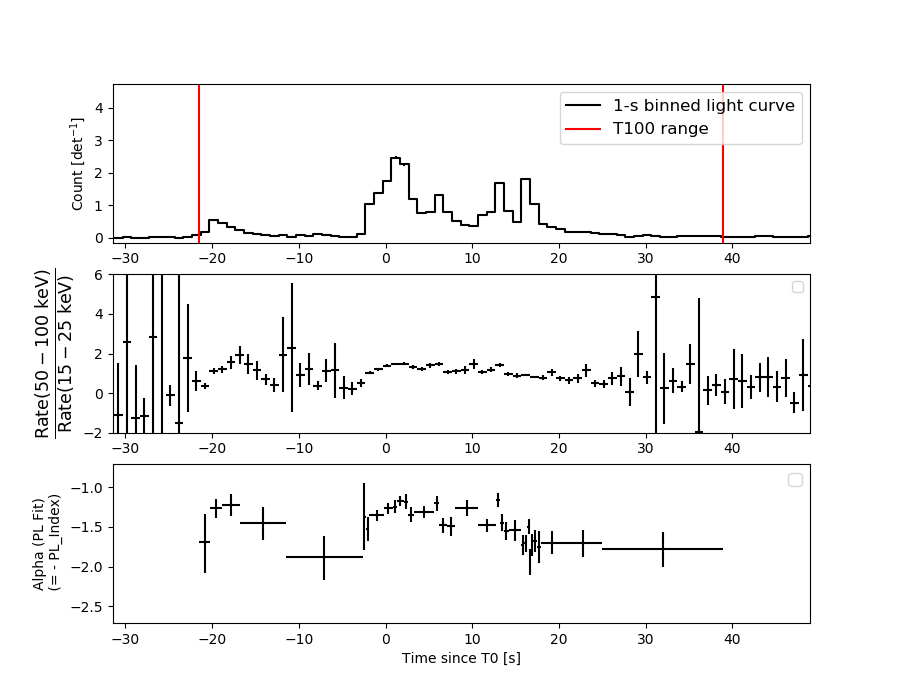
Light Curves
Note: The mask-weighted lightcurves have units of either count/det or counts/sec/det, where a det is 0.4 x 0.4 = 0.16 sq cm.
Full-time range; 1 s binning
Other quick-look light curves:
- 64 ms binning (zoomed)
- 16 ms binning (zoomed)
- 8 ms binning (zoomed)
- 2 ms binning (zoomed)
- SN=5 or 10 s binning (full-time range)
- Raw light curve
Spectra
- 64 ms binning (zoomed)
- 16 ms binning (zoomed)
- 8 ms binning (zoomed)
- 2 ms binning (zoomed)
- SN=5 or 10 s binning (full-time range)
- Raw light curve
Spectra
Notes:
- 1) The fitting includes the systematic errors.
- 2) When the burst includes telescope slew time periods, the fitting uses an average response file made from multiple 5-s response files through out the slew time plus single time preiod for the non-slew times, and weighted by the total counts in the corresponding time period using addrmf. An average response file is needed becuase a spectral fit using the pre-slew DRM will introduce some errors in both a spectral shape and a normalization if the PHA file contains a lot of the slew/post-slew time interval.
- 3) For fits to more complicated models (e.g. a power-law over a cutoff power-law), the BAT team has decided to require a chi-square improvement of more than 6 for each extra dof.
Time averaged spectrum fit using the average DRM
Power-law model
Time interval is from  -21.488 sec. to   38.956 sec.

Spectral model in power-law:
------------------------------------------------------------
Parameters  : value       lower 90%   higher 90%
Photon index: -1.41327     ( -0.0318548   0.0319564 )
Norm@50keV  : 3.08494E-02    ( -0.000510722   0.000510004 )
------------------------------------------------------------
#Fit statistic : Chi-Squared =          45.57 using 59 PHA bins.
# Reduced chi-squared =         0.7995 for     57 degrees of freedom
# Null hypothesis probability =   8.616884e-01

Photon flux (15-150 keV)    in 60.44 sec: 3.76843 ( -0.07377  0.07405 ) ph/cm2/s
Energy fluence (15-150 keV)             : 1.79703e-05 ( -2.92615e-07  2.93256e-07 ) ergs/cm2
Cutoff power-law model
Time interval is from  -21.488 sec. to   38.956 sec.
Spectral model in the cutoff power-law:
------------------------------------------------------------
Parameters  : value       lower 90%   higher 90%
Photon index: -1.40969     ( -0.0141818   0.126688 )
Epeak [keV] : 9999.09      ( -9999.1 -9999.1 )
Norm@50keV  : 3.09563E-02    ( -0.000504379   0.00355817 )
------------------------------------------------------------
#Fit statistic : Chi-Squared =          45.58 using 59 PHA bins.
# Reduced chi-squared =         0.8139 for     56 degrees of freedom
# Null hypothesis probability =   8.387393e-01

Photon flux (15-150 keV)    in 60.44 sec: 2.53015 ( -0.10746  0.06527 ) ph/cm2/s
Energy fluence (15-150 keV)             : 9.15575e-06 ( -4.34388e-07  3.36175e-07 ) ergs/cm2
1-s peak spectrum fit
Power-law model
Time interval is from    1.132 sec. to    2.132 sec.

Spectral model in power-law:
------------------------------------------------------------
Parameters  : value       lower 90%   higher 90%
Photon index: -1.19458     ( -0.0582187   0.0582622 )
Norm@50keV  : 0.181311    ( -0.00578164   0.00578162 )
------------------------------------------------------------
#Fit statistic : Chi-Squared =          60.41 using 59 PHA bins.
# Reduced chi-squared =          1.060 for     57 degrees of freedom
# Null hypothesis probability =   3.535866e-01

Photon flux (15-150 keV)    in 1 sec: 1.17631 (    ) ph/cm2/s
Energy fluence (15-150 keV)             : 1.84251e-06 ( -6.62358e-08  6.642e-08 ) ergs/cm2
Cutoff power-law model
Time interval is from    1.132 sec. to    2.132 sec.
Spectral model in the cutoff power-law:
------------------------------------------------------------
Parameters  : value       lower 90%   higher 90%
Photon index: -1.03275     ( -0.184718   0.224545 )
Epeak [keV] : 330.700      ( -330.7 -330.7 )
Norm@50keV  : 0.215302    ( -0.0371914   0.0559716 )
------------------------------------------------------------
#Fit statistic : Chi-Squared =          58.75 using 59 PHA bins.
# Reduced chi-squared =          1.049 for     56 degrees of freedom
# Null hypothesis probability =   3.750459e-01

Photon flux (15-150 keV)    in 1 sec: 21.0901 ( -0.7338  0.7342 ) ph/cm2/s
Energy fluence (15-150 keV)             : 1.82402e-06 ( -7.11085e-08  7.08525e-08 ) ergs/cm2
Time-resolved spectra
Distribution
T90 vs. Hardness ratio plot
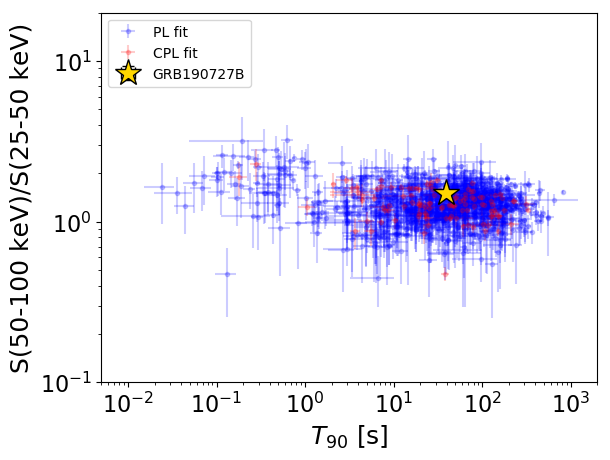
T90                                   = 39.196 sec.
Hardness ratio (energy fluence ratio) = 1.50186244279
S(15-50 keV) vs. S(50-150 keV) plot
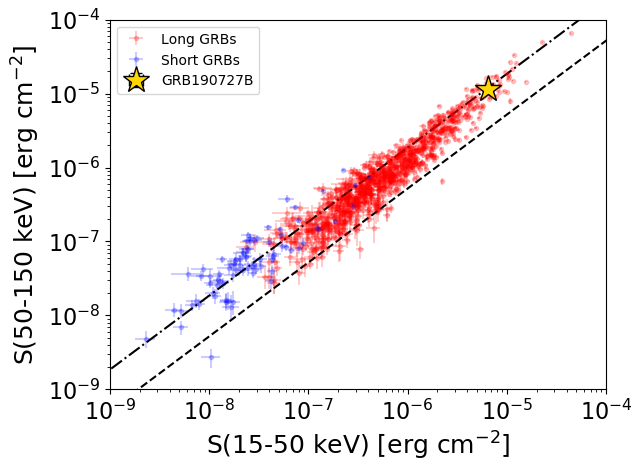
S(15-50 keV)  = 6.448335e-06
S(50-150 keV) = 1.1522069e-05
The dash-dotted line and the dashed line traces the fluences calculated from the Band function with Epeak = 15 and 150 keV, respectively. Both lines assume a canonical values of alpha = -1 and beta = -2.5.
Mask shadow pattern
IMX = -1.812319746569528E-01, IMY = 4.418762016894605E-01
Spacecraft aspect plot
Bright source in the pre-burst/pre-slew/post-slew images
Pre-burst image of 15-350 keV band
Time interval of the image:
Pre-slew background subtracted image of 15-350 keV band
Time interval of the image:
-12.231400 38.956000

# RAcent  DECcent POSerr Theta    Phi  PeakCts   SNR AngSep     Name
#  [deg]    [deg]    ['] [deg]  [deg]                   [']
135.5025 -40.5220   36.9  17.9  166.9   0.1371   0.3    2.3	Vela X-1
170.2151 -60.4526  100.5  36.4  112.9   0.1356   0.1   10.6	Cen X-3
114.6940 -67.3287    3.1  45.6  147.9   6.2873   3.7 ------	UNKNOWN
 99.6584 -40.0894    2.2  43.1 -171.0   3.5685   5.2 ------	UNKNOWN
126.4994 -13.2722    0.2  25.5 -112.3  27.7262  55.7 ------	UNKNOWN
Post-slew image of 15-350 keV band
Time interval of the image:
-239.332000 711.105000
720.668000 839.564300
840.668000 962.801100

# RAcent  DECcent POSerr Theta    Phi  PeakCts   SNR AngSep     Name
#  [deg]    [deg]    ['] [deg]  [deg]                   [']
135.2950 -40.4954    4.9  18.0  167.3   6.1040   2.3   11.2	Vela X-1
170.2525 -60.6069   11.7  36.5  113.0  -7.2970  -1.0    2.1	Cen X-3
178.3583 -62.0048    2.8  40.0  109.4  44.6135   4.2 ------	UNKNOWN
139.1349 -69.3552    4.1  42.9  135.3  40.1508   2.9 ------	UNKNOWN
126.5008 -13.2676    1.2  25.5 -112.3  29.8704   9.6 ------	UNKNOWN
154.3573   6.9904    2.8  34.2  -41.6  13.6824   4.1 ------	UNKNOWN
123.3578  -7.2384    2.3  31.7 -106.5  18.1941   4.9 ------	UNKNOWN