Analysis Summary
Notes:
- 1) No attempt has been made to eliminate the non-significant decimal places.
- 2) This batgrbproduct analysis is done using the HEASARC data.
- 3) This batgrbproduct analysis is using the flight position for the mask-weighting calculation.
======================================================================
BAT GRB EVENT DATA PROCESSING REPORT
Process Script Ver: batgrbproduct v2.46
Process Start Time: Tue Oct 8 22:34:15 EDT 2019
Host Name: bat1
Current Working Dir: /local/data/bat1/alien/Swift_3rdBATcatalog/event/batevent_reproc/trigger920783
======================================================================
Trigger: 00920783 Segment: 000
BAT Trigger Time: 587659368 [s; MET]
Trigger Stop: 587659448 [s; MET]
UTC: 2019-08-16T14:42:24.578600 [includes UTCF correction]
Where From?: TDRSS position message
BAT
RA: 341.193592693739 Dec: -29.7399634001357 [deg; J2000]
Catalogged Source?: NO
Point Source?: YES
GRB Indicated?: YES [ by BAT flight software ]
Image S/N Ratio: 8.26
Image Trigger?: YES
Rate S/N Ratio: 0 [ if not an image trigger ]
Image S/N Ratio: 8.26
Analysis Position: [ source = BAT ]
RA: 341.193592693739 Dec: -29.7399634001357 [deg; J2000]
Refined Position: [ source = BAT pre-slew burst ]
RA: 341.181560239531 Dec: -29.7446124365791 [deg; J2000]
{ 22h 44m 43.6s , -29d 44' 40.6" }
+/- 1.66865306377129 [arcmin] (estimated 90% radius based on SNR)
+/- 0.543288707815764 [arcmin] (formal 1-sigma fit error)
SNR: 14.6370175649813
Angular difference between the analysis and refined position is 0.686105 arcmin
Partial Coding Fraction: 0.3085938 [ including projection effects ]
Duration
T90: 375.759999990463 +/- 92.2201941781066
Measured from: -118.447999954224
to: 257.31200003624 [s; relative to TRIGTIME]
T50: 150.447999954224 +/- 10.7873257921812
Measured from: 10.0800000429153
to: 160.527999997139 [s; relative to TRIGTIME]
Fluence
Peak Flux (peak 1 second)
Measured from: 151.572000026703
to: 152.572000026703 [s; relative to TRIGTIME]
Total Fluence
Measured from: -206.480000019073
to: 341.552000045776 [s; relative to TRIGTIME]
Band 1 Band 2 Band 3 Band 4
15-25 25-50 50-100 100-350 keV
Total 4.884625 5.586613 4.365112 1.478426
0.282218 0.293387 0.256139 0.215530 [error]
Peak 0.051310 0.060884 0.046232 0.007398
0.012464 0.014083 0.011942 0.009179 [error]
[ fluence units of on-axis counts / fully illuminated detector ]
======================================================================
====== Table of the duration information =============================
Value tstart tstop
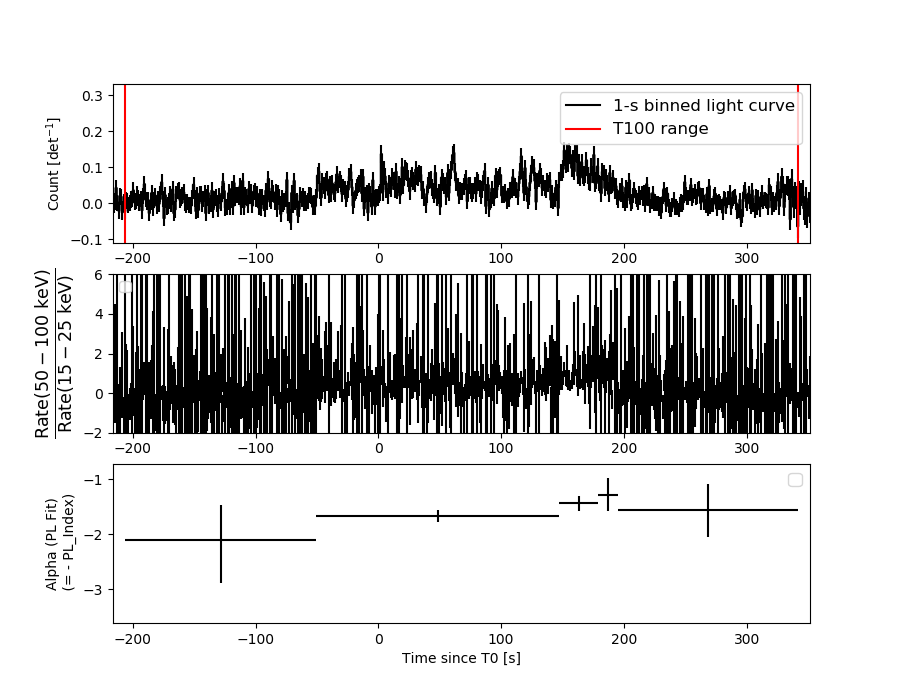
T100 548.032 -206.480 341.552
T90 375.760 -118.448 257.312
T50 150.448 10.080 160.528
Peak 1.000 151.572 152.572
====== Spectral Analysis Summary =====================================
Model : spectral model: simple power-law (PL) and cutoff power-law (CPL)
Ph_index : photon index: E^{Ph_index}
Ph_90err : 90% error of the photon index
Epeak : Epeak in keV
Epeak_90err: 90% error of Epeak
Norm : normalization at 50 keV in both the PL model and CPL model
Nomr_90err : 90% error of the normalization
chi2 : Chi-Squared
dof : degree of freedo
=== Time-averaged spectral analysis ===
(Best model with acceptable fit: PL)
Model Ph_index Ph_90err_low Ph_90err_hi Epeak Epeak_90err_low Epeak_90err_hi Norm Nomr_90err_low Norm_90err_hi chi2 dof
PL -1.619 -0.107 0.106 - - - 1.91e-03 -1.12e-04 1.12e-04 44.330 57
CPL -1.620 -0.104 0.109 9999.360 -9999.360 -9999.360 1.91e-03 -3.40e-04 8.91e-04 44.340 56
=== 1-s peak spectral analysis ===
(Best model with acceptable fit: N/A)
Model Ph_index Ph_90err_low Ph_90err_hi Epeak Epeak_90err_low Epeak_90err_hi Norm Nomr_90err_low Norm_90err_hi chi2 dof
PL -1.917 -0.446 0.386 - - - 8.87e-03 -2.75e-03 2.65e-03 73.170 57
CPL -0.429 -1.566 2.422 47.860 N/A N/A 5.91e-02 N/A N/A 70.530 56
=== Fluence/Peak Flux Summary ===
Model Band1 Band2 Band3 Band4 Band5 Total
15-25 25-50 50-100 100-350 15-150 15-350 keV
Fluence PL 1.49e-06 2.55e-06 3.32e-06 8.77e-06 9.76e-06 1.61e-05 erg/cm2
90%_error_low -1.47e-07 -1.51e-07 -2.62e-07 -1.42e-06 -6.15e-07 -1.63e-06 erg/cm2
90%_error_hi 1.52e-07 1.51e-07 2.61e-07 1.59e-06 6.20e-07 1.77e-06 erg/cm2
Peak flux PL 5.46e-01 4.30e-01 2.27e-01 1.75e-01 1.28e+00 1.38e+00 ph/cm2/s
90%_error_low -1.78e-01 -1.09e-01 -8.65e-02 -1.17e-01 -3.25e-01 -3.54e-01 ph/cm2/s
90%_error_hi 1.89e-01 1.09e-01 8.80e-02 1.47e-01 3.25e-01 3.56e-01 ph/cm2/s
Fluence CPL 1.50e-06 2.54e-06 3.32e-06 9.19e-06 9.79e-06 1.62e-05 erg/cm2
90%_error_low N/A -1.53e-07 -2.87e-07 N/A -7.10e-07 -3.64e-06 erg/cm2
90%_error_hi N/A 1.85e-07 3.08e-07 N/A 5.01e-07 8.79e-07 erg/cm2
Peak flux CPL 4.62e-01 5.18e-01 2.49e-01 4.56e-02 1.27e+00 1.27e+00 ph/cm2/s
90%_error_low -2.06e-01 -1.44e-01 N/A -4.56e-02 -3.23e-01 -3.26e-01 ph/cm2/s
90%_error_hi 2.12e-01 1.55e-01 N/A 1.59e-01 3.24e-01 3.37e-01 ph/cm2/s
======================================================================
Image
Pre-slew 15.0-350.0 keV image (Event data)
#   RAcent    DECcent   POSerr    Theta     Phi              Peak Cts       SNR   Name
  341.1816   -29.7446   0.0132    29.6778    55.4667         4.8690528     14.637 TRIG_00920783

Foreground time interval of the image:
-12.499  83.701 (delta_t =  96.200 [sec])
Background time interval of the image:
Light Curves
Note: The mask-weighted lightcurves have units of either count/det or counts/sec/det, where a det is 0.4 x 0.4 = 0.16 sq cm.
Full-time range; 1 s binning
Other quick-look light curves:
- 64 ms binning (zoomed)
- 16 ms binning (zoomed)
- 8 ms binning (zoomed)
- 2 ms binning (zoomed)
- SN=5 or 10 s binning (full-time range)
- Raw light curve
Spectra
- 64 ms binning (zoomed)
- 16 ms binning (zoomed)
- 8 ms binning (zoomed)
- 2 ms binning (zoomed)
- SN=5 or 10 s binning (full-time range)
- Raw light curve
Spectra
Notes:
- 1) The fitting includes the systematic errors.
- 2) When the burst includes telescope slew time periods, the fitting uses an average response file made from multiple 5-s response files through out the slew time plus single time preiod for the non-slew times, and weighted by the total counts in the corresponding time period using addrmf. An average response file is needed becuase a spectral fit using the pre-slew DRM will introduce some errors in both a spectral shape and a normalization if the PHA file contains a lot of the slew/post-slew time interval.
- 3) For fits to more complicated models (e.g. a power-law over a cutoff power-law), the BAT team has decided to require a chi-square improvement of more than 6 for each extra dof.
Time averaged spectrum fit using the average DRM
Power-law model

Time interval is from -206.480 sec. to  341.552 sec.

Spectral model in power-law:
------------------------------------------------------------
Parameters  : value       lower 90%   higher 90%
Photon index: -1.61867     ( -0.10657   0.105697 )
Norm@50keV  : 1.90910E-03    ( -0.000112469   0.000111916 )
------------------------------------------------------------
#Fit statistic : Chi-Squared =          44.33 using 59 PHA bins.
# Reduced chi-squared =         0.7778 for     57 degrees of freedom
# Null hypothesis probability =   8.895547e-01

Photon flux (15-150 keV)    in 548 sec: 0.246776 ( -0.014475  0.014512 ) ph/cm2/s
Energy fluence (15-150 keV)             : 9.76383e-06 ( -6.15311e-07  6.19596e-07 ) ergs/cm2
Cutoff power-law model
Time interval is from -206.480 sec. to  341.552 sec.
Spectral model in the cutoff power-law:
------------------------------------------------------------
Parameters  : value       lower 90%   higher 90%
Photon index: -1.61978     ( -0.10545   0.108336 )
Epeak [keV] : 9999.36      ( -9999.36 -9999.36 )
Norm@50keV  : 1.90717E-03    ( -0.000345459   0.000885329 )
------------------------------------------------------------
#Fit statistic : Chi-Squared =          44.34 using 59 PHA bins.
# Reduced chi-squared =         0.7919 for     56 degrees of freedom
# Null hypothesis probability =   8.695895e-01

Photon flux (15-150 keV)    in 548 sec: 0.247419 ( -0.017141  0.01528 ) ph/cm2/s
Energy fluence (15-150 keV)             : 9.79402e-06 ( -7.10159e-07  5.00605e-07 ) ergs/cm2
1-s peak spectrum fit
Power-law model
Time interval is from  151.572 sec. to  152.572 sec.

Spectral model in power-law:
------------------------------------------------------------
Parameters  : value       lower 90%   higher 90%
Photon index: -1.9173     ( -0.446182   0.386008 )
Norm@50keV  : 8.86763E-03    ( -0.00275317   0.002649 )
------------------------------------------------------------
#Fit statistic : Chi-Squared =          73.17 using 59 PHA bins.
# Reduced chi-squared =          1.284 for     57 degrees of freedom
# Null hypothesis probability =   7.320159e-02

Photon flux (15-150 keV)    in 1 sec: 1.28213 ( -0.324947  0.32498 ) ph/cm2/s
Energy fluence (15-150 keV)             : 8.15511e-08 ( -2.39846e-08  2.47824e-08 ) ergs/cm2
Cutoff power-law model
Time interval is from  151.572 sec. to  152.572 sec.
Spectral model in the cutoff power-law:
------------------------------------------------------------
Parameters  : value       lower 90%   higher 90%
Photon index: -0.428527     ( -1.56307   2.42453 )
Epeak [keV] : 47.8596      (   )
Norm@50keV  : 5.91427E-02    (     )
------------------------------------------------------------
#Fit statistic : Chi-Squared =          70.53 using 59 PHA bins.
# Reduced chi-squared =          1.259 for     56 degrees of freedom
# Null hypothesis probability =   9.157560e-02

Photon flux (15-150 keV)    in 1 sec: 1.26699 ( -0.323326  0.32398 ) ph/cm2/s
Energy fluence (15-150 keV)             : 7.7707e-08 ( -2.30948e-08  2.48724e-08 ) ergs/cm2
Time-resolved spectra
Distribution
T90 vs. Hardness ratio plot
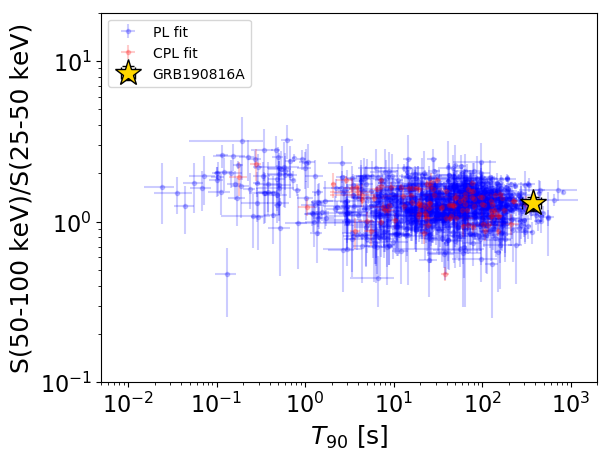
T90                                   = 375.76 sec.
Hardness ratio (energy fluence ratio) = 1.30256704391
S(15-50 keV) vs. S(50-150 keV) plot
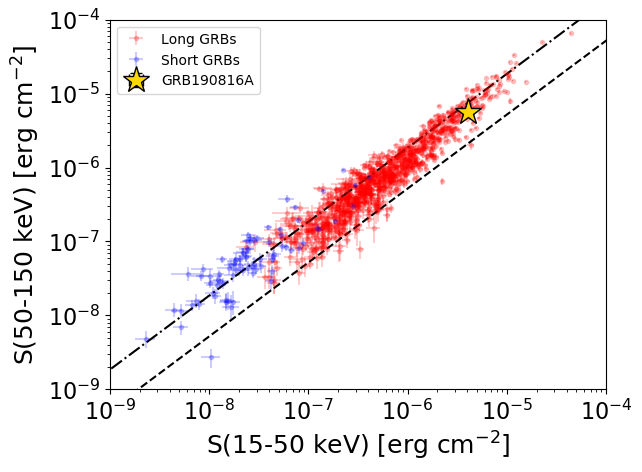
S(15-50 keV)  = 4.045816e-06
S(50-150 keV) = 5.718136e-06
The dash-dotted line and the dashed line traces the fluences calculated from the Band function with Epeak = 15 and 150 keV, respectively. Both lines assume a canonical values of alpha = -1 and beta = -2.5.
Mask shadow pattern
IMX = 3.230544599709423E-01, IMY = -4.694627845241600E-01
Spacecraft aspect plot
Bright source in the pre-burst/pre-slew/post-slew images
Pre-burst image of 15-350 keV band
Time interval of the image:
Pre-slew background subtracted image of 15-350 keV band
Time interval of the image:
-12.499380 83.700610

# RAcent  DECcent POSerr Theta    Phi  PeakCts   SNR AngSep     Name
#  [deg]    [deg]    ['] [deg]  [deg]                   [']
326.2914 -28.0396    3.4  42.8   57.5   2.3256   3.4 ------	UNKNOWN
354.7226  15.3589    2.7  44.1  135.7   4.4944   4.3 ------	UNKNOWN
316.8564 -45.0342    2.6  50.1   33.8   3.1599   4.5 ------	UNKNOWN
341.1816 -29.7446    0.8  29.7   55.5   4.8692  14.6 ------	UNKNOWN
 29.6782 -16.4251    2.3  16.6 -132.7   0.9628   5.1 ------	UNKNOWN
 40.1332  23.3534    1.8  54.1 -167.0   4.2461   6.4 ------	UNKNOWN
 45.6648   2.9771    2.5  41.1 -144.2   1.4731   4.6 ------	UNKNOWN
 48.8767 -25.4627    2.7  31.5  -97.5   1.2209   4.3 ------	UNKNOWN
Post-slew image of 15-350 keV band
Time interval of the image:
97.900600 196.700610

# RAcent  DECcent POSerr Theta    Phi  PeakCts   SNR AngSep     Name
#  [deg]    [deg]    ['] [deg]  [deg]                   [']
343.9737   6.4639    2.8  40.8  115.5   2.9633   4.1 ------	UNKNOWN
341.1671 -29.7336    0.7  29.6   52.7   6.5193  17.5 ------	UNKNOWN
358.2333  -1.3642    2.3  25.7  127.0   1.5574   5.1  133.9	UNKNOWN
 18.3420 -63.6454    2.0  41.2  -19.9   1.8194   5.8 ------	UNKNOWN
 56.3678   4.7862    2.9  50.3 -134.0   4.3543   4.0 ------	UNKNOWN