Analysis Summary
Notes:
- 1) No attempt has been made to eliminate the non-significant decimal places.
- 2) This batgrbproduct analysis is done using the HEASARC data.
- 3) This batgrbproduct analysis is using the flight position for the mask-weighting calculation.
======================================================================
                  BAT GRB EVENT DATA PROCESSING REPORT
    Process Script Ver: batgrbproduct v2.46
    Process Start Time: Tue Oct  8 22:25:46 EDT 2019
             Host Name: bat1
   Current Working Dir: /local/data/bat1/alien/Swift_3rdBATcatalog/event/batevent_reproc/trigger922107
======================================================================

  Trigger: 00922107      Segment: 000

  BAT Trigger Time: 588350823.04   [s; MET]
      Trigger Stop: 588350824.064   [s; MET]
               UTC: 2019-08-24T14:46:39.574480    [includes UTCF correction]
       Where From?: TDRSS position message

  BAT
    RA: 215.328919318933   Dec: -41.9023481012554  [deg; J2000]

     Catalogged Source?: NO
     Point Source?:      YES
     GRB Indicated?:     YES    [ by BAT flight software ]
     Image S/N Ratio:    11.41
     Image Trigger?:     NO
     Rate S/N Ratio:     28.2488937836511  [ if not an image trigger ]
     Image S/N Ratio:    11.41

  Analysis Position:   [ source = BAT ]
    RA: 215.328919318933   Dec: -41.9023481012554  [deg; J2000]

  Refined Position:   [ source = BAT pre-slew burst ]
    RA: 215.323416226394   Dec: -41.8998596577854  [deg; J2000]
        { 14h 21m 17.6s , -41d 53' 59.5" }
         +/- 1.70962728486775 [arcmin] (estimated 90% radius based on SNR)
         +/- 0.445502614746175 [arcmin] (formal 1-sigma fit error)
    SNR: 14.1384576931672

  Angular difference between the analysis and refined position is 0.287557 arcmin

  Partial Coding Fraction: 0.2851562    [ including projection effects ]

  Duration
     T90: 169.360000014305 +/- 5.85471026588723
        Measured from: -62.9759999513626
                   to: 106.384000062943     [s; relative to TRIGTIME]
     T50: 51.824000120163 +/- 9.75651090526973
        Measured from: -1.75999999046326
                   to: 50.0640001296997     [s; relative to TRIGTIME]


  Fluence
     Peak Flux  (peak 1 second)
        Measured from: 0.116000056266785
                   to: 1.11600005626678     [s; relative to TRIGTIME]
     Total Fluence
        Measured from: -71.8880000114441
                   to: 114.639999985695     [s; relative to TRIGTIME]

             Band 1     Band 2     Band 3     Band 4
              15-25      25-50     50-100    100-350     keV
 Total     3.830383   5.236525   3.673192   0.678148
           0.172943   0.181765   0.164206   0.150069 [error]
 Peak      0.117337   0.225224   0.232519   0.076721
           0.018196   0.022222   0.021387   0.017627 [error]

     [ fluence units of on-axis counts / fully illuminated detector ]

======================================================================


====== Table of the duration information =============================

        Value   tstart    tstop
T100  186.528  -71.888  114.640
T90   169.360  -62.976  106.384
T50    51.824   -1.760   50.064
Peak    1.000    0.116    1.116


====== Spectral Analysis Summary =====================================

Model      : spectral model: simple power-law (PL) and cutoff power-law (CPL)
Ph_index   : photon index: E^{Ph_index}
Ph_90err   : 90% error of the photon index
Epeak      : Epeak in keV
Epeak_90err: 90% error of Epeak
Norm       : normalization at 50 keV in both the PL model and CPL model
Nomr_90err : 90% error of the normalization
chi2       : Chi-Squared
dof        : degree of freedo

=== Time-averaged spectral analysis ===
(Best model with acceptable fit: PL)

Model Ph_index Ph_90err_low Ph_90err_hi  Epeak  Epeak_90err_low  Epeak_90err_hi  Norm       Nomr_90err_low    Norm_90err_hi    chi2    dof
PL      -1.600    -0.079      0.078       -           -               -         4.79e-03     -2.09e-04          2.08e-04      34.810   57
CPL     -1.251    -0.308      0.332      106.870     -29.951       339.851      7.16e-03     -2.10e-03          3.25e-03      31.050   56


=== 1-s peak spectral analysis ===
(Best model with acceptable fit: PL)

Model Ph_index Ph_90err_low Ph_90err_hi  Epeak  Epeak_90err_low  Epeak_90err_hi  Norm       Nomr_90err_low    Norm_90err_hi    chi2    dof
PL      -1.058     -0.171     0.174       -           -               -         4.36e-02     -4.45e-03          4.45e-03      61.080   57
CPL     -0.601     -0.614     0.860      171.718     -82.089      -171.718      7.08e-02     -3.03e-02          9.96e-02      59.960   56


=== Fluence/Peak Flux Summary ===

              Model    Band1     Band2     Band3     Band4     Band5     Total
                       15-25     25-50    50-100    100-350    15-150    15-350    keV
Fluence         PL   1.25e-06  2.17e-06  2.86e-06  7.68e-06  8.36e-06  1.40e-05   erg/cm2
      90%_error_low -9.24e-08 -9.58e-08 -1.66e-07 -9.31e-07 -3.92e-07 -1.06e-06   erg/cm2
      90%_error_hi   9.47e-08  9.56e-08  1.66e-07  1.02e-06  3.94e-07  1.13e-06   erg/cm2
Peak flux       PL   1.18e+00  1.54e+00  1.48e+00  2.53e+00  5.04e+00  6.73e+00   ph/cm2/s
      90%_error_low -2.28e-01 -1.91e-01 -1.68e-01 -5.60e-01 -5.24e-01 -7.42e-01   ph/cm2/s
      90%_error_hi   2.42e-01  1.88e-01  1.67e-01  6.52e-01  5.25e-01  7.61e-01   ph/cm2/s

Fluence        CPL   1.18e-06  2.23e-06  2.90e-06  4.57e-06  8.10e-06  1.09e-05   erg/cm2
      90%_error_low -1.13e-07 -1.13e-07 -1.76e-07 -1.58e-06 -4.51e-07 -1.64e-06   erg/cm2
      90%_error_hi   1.15e-07  1.14e-07  1.78e-07  2.63e-06  4.51e-07  2.64e-06   erg/cm2
Peak flux      CPL   1.06e+00  1.59e+00  1.57e+00  1.61e+00  4.97e+00  5.83e+00   ph/cm2/s
      90%_error_low -2.90e-01 -2.11e-01 -2.13e-01 -7.87e-01 -5.40e-01 -9.77e-01   ph/cm2/s
      90%_error_hi   2.90e-01  2.17e-01  2.19e-01  1.12e+00  5.38e-01  1.31e+00   ph/cm2/s

======================================================================
Image
Pre-slew 15.0-350.0 keV image (Event data)
#   RAcent    DECcent   POSerr    Theta     Phi              Peak Cts       SNR   Name
  215.3234   -41.8999   0.0136    30.5032    55.1511         9.1324193     14.138 TRIG_00922107

Foreground time interval of the image:
-71.888  15.261 (delta_t =  87.149 [sec])
Background time interval of the image:
-239.040 -71.888 (delta_t = 167.152 [sec])
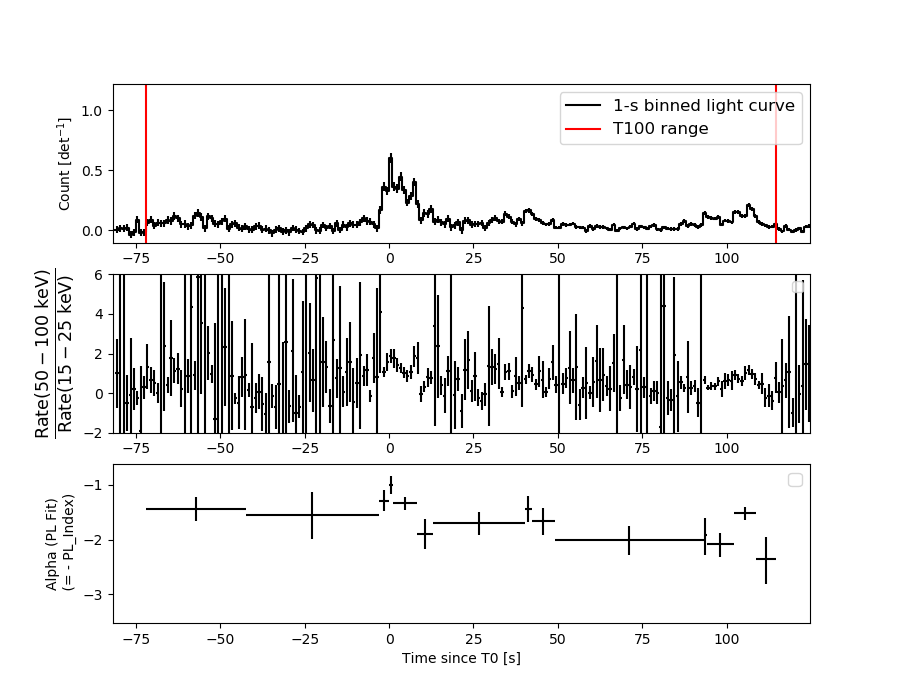
Light Curves
Note: The mask-weighted lightcurves have units of either count/det or counts/sec/det, where a det is 0.4 x 0.4 = 0.16 sq cm.
Full-time range; 1 s binning
Other quick-look light curves:
- 64 ms binning (zoomed)
- 16 ms binning (zoomed)
- 8 ms binning (zoomed)
- 2 ms binning (zoomed)
- SN=5 or 10 s binning (full-time range)
- Raw light curve
Spectra
- 64 ms binning (zoomed)
- 16 ms binning (zoomed)
- 8 ms binning (zoomed)
- 2 ms binning (zoomed)
- SN=5 or 10 s binning (full-time range)
- Raw light curve
Spectra
Notes:
- 1) The fitting includes the systematic errors.
- 2) When the burst includes telescope slew time periods, the fitting uses an average response file made from multiple 5-s response files through out the slew time plus single time preiod for the non-slew times, and weighted by the total counts in the corresponding time period using addrmf. An average response file is needed becuase a spectral fit using the pre-slew DRM will introduce some errors in both a spectral shape and a normalization if the PHA file contains a lot of the slew/post-slew time interval.
- 3) For fits to more complicated models (e.g. a power-law over a cutoff power-law), the BAT team has decided to require a chi-square improvement of more than 6 for each extra dof.
Time averaged spectrum fit using the average DRM
Power-law model
Time interval is from  -71.888 sec. to  114.640 sec.

Spectral model in power-law:
------------------------------------------------------------
Parameters  : value       lower 90%   higher 90%
Photon index: -1.59997     ( -0.0788261   0.0782758 )
Norm@50keV  : 4.79086E-03    ( -0.000209009   0.000208382 )
------------------------------------------------------------
#Fit statistic : Chi-Squared =          34.81 using 59 PHA bins.
# Reduced chi-squared =         0.6107 for     57 degrees of freedom
# Null hypothesis probability =   9.910572e-01

Photon flux (15-150 keV)    in 186.5 sec: 0.615661 ( -0.026866  0.026912 ) ph/cm2/s
Energy fluence (15-150 keV)             : 8.35716e-06 ( -3.92101e-07  3.9447e-07 ) ergs/cm2
Cutoff power-law model
Time interval is from  -71.888 sec. to  114.640 sec.
Spectral model in the cutoff power-law:
------------------------------------------------------------
Parameters  : value       lower 90%   higher 90%
Photon index: -1.25127     ( -0.308355   0.331569 )
Epeak [keV] : 106.870      ( -29.9508 339.851 )
Norm@50keV  : 7.16476E-03    ( -0.00209778   0.00325425 )
------------------------------------------------------------
#Fit statistic : Chi-Squared =          31.05 using 59 PHA bins.
# Reduced chi-squared =         0.5545 for     56 degrees of freedom
# Null hypothesis probability =   9.972468e-01

Photon flux (15-150 keV)    in 186.5 sec: 0.602427 ( -0.029156  0.029183 ) ph/cm2/s
Energy fluence (15-150 keV)             : 8.1038e-06 ( -4.51201e-07  4.51377e-07 ) ergs/cm2
1-s peak spectrum fit
Power-law model
Time interval is from    0.116 sec. to    1.116 sec.

Spectral model in power-law:
------------------------------------------------------------
Parameters  : value       lower 90%   higher 90%
Photon index: -1.0577     ( -0.170926   0.174206 )
Norm@50keV  : 4.36262E-02    ( -0.00445449   0.00444642 )
------------------------------------------------------------
#Fit statistic : Chi-Squared =          61.08 using 59 PHA bins.
# Reduced chi-squared =          1.072 for     57 degrees of freedom
# Null hypothesis probability =   3.315314e-01

Photon flux (15-150 keV)    in 1 sec: 5.04163 ( -0.52422  0.52487 ) ph/cm2/s
Energy fluence (15-150 keV)             : 4.62519e-07 ( -5.17951e-08  5.20576e-08 ) ergs/cm2
Cutoff power-law model
Time interval is from    0.116 sec. to    1.116 sec.
Spectral model in the cutoff power-law:
------------------------------------------------------------
Parameters  : value       lower 90%   higher 90%
Photon index: -0.60146     ( -0.613635   0.860024 )
Epeak [keV] : 171.718      ( -82.0804 -171.71 )
Norm@50keV  : 7.07890E-02    ( -0.030321   0.0995995 )
------------------------------------------------------------
#Fit statistic : Chi-Squared =          59.96 using 59 PHA bins.
# Reduced chi-squared =          1.071 for     56 degrees of freedom
# Null hypothesis probability =   3.340220e-01

Photon flux (15-150 keV)    in 1 sec: 4.96962 ( -0.54001  0.53832 ) ph/cm2/s
Energy fluence (15-150 keV)             : 0 ( 0  0 ) ergs/cm2
Time-resolved spectra
Distribution
T90 vs. Hardness ratio plot
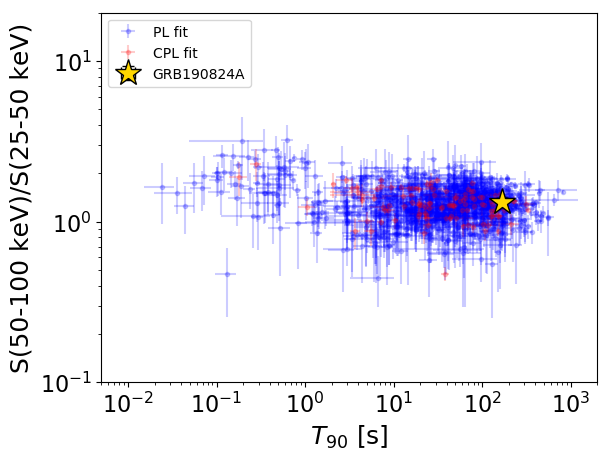
T90                                   = 169.36 sec.
Hardness ratio (energy fluence ratio) = 1.31959319643
S(15-50 keV) vs. S(50-150 keV) plot
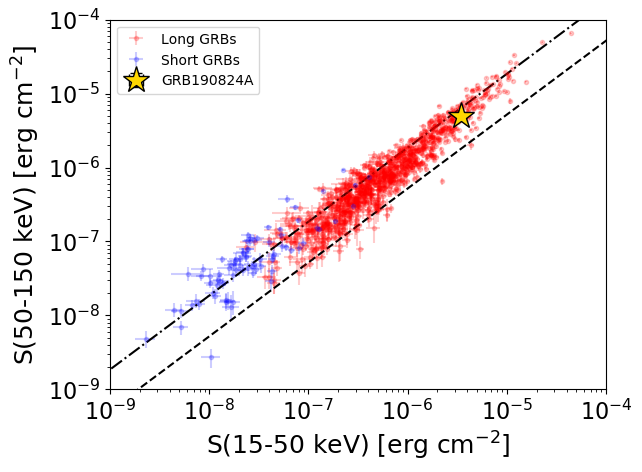
S(15-50 keV)  = 3.419618e-06
S(50-150 keV) = 4.937664e-06
The dash-dotted line and the dashed line traces the fluences calculated from the Band function with Epeak = 15 and 150 keV, respectively. Both lines assume a canonical values of alpha = -1 and beta = -2.5.
Mask shadow pattern
IMX = 3.366317756269722E-01, IMY = -4.834678728119247E-01
Spacecraft aspect plot
Bright source in the pre-burst/pre-slew/post-slew images
Pre-burst image of 15-350 keV band
Time interval of the image:
-239.040000 -71.888000

# RAcent  DECcent POSerr Theta    Phi  PeakCts   SNR AngSep     Name
#  [deg]    [deg]    ['] [deg]  [deg]                   [']
135.3701 -40.6084    3.8  33.1 -172.1  -3.2419  -3.0    7.9	Vela X-1
170.3382 -60.6279    7.2  26.1  127.9   1.8652   1.6    0.7	Cen X-3
187.0535 -62.7758    7.5  28.5  110.8   2.1747   1.5   10.9	GX 301-2
107.2808 -46.3839    3.0  52.4  175.2  16.5856   3.8 ------	UNKNOWN
195.3794 -12.5901    2.8  27.8  -18.6   4.1286   4.1 ------	UNKNOWN
Pre-slew background subtracted image of 15-350 keV band
Time interval of the image:
-71.888000 15.260590

# RAcent  DECcent POSerr Theta    Phi  PeakCts   SNR AngSep     Name
#  [deg]    [deg]    ['] [deg]  [deg]                   [']
135.4736 -40.5946    6.2  33.1 -172.1   0.7933   1.9    3.5	Vela X-1
170.0478 -60.5953    4.3  26.1  128.2  -1.2977  -2.7    8.1	Cen X-3
186.8791 -62.6828   10.1  28.4  110.9   0.7118   1.1    8.1	GX 301-2
228.0001 -29.0598    3.4  43.1   37.3   3.0039   3.4 ------	UNKNOWN
215.3234 -41.8999    0.8  30.5   55.2   9.1324  14.2 ------	UNKNOWN
147.0570 -14.9123    2.3  33.6 -120.6   2.6526   4.9 ------	UNKNOWN
175.5360   9.8903    2.3  44.9  -61.8   6.2074   5.0 ------	UNKNOWN
Post-slew image of 15-350 keV band
Time interval of the image:
66.860600 963.042300

# RAcent  DECcent POSerr Theta    Phi  PeakCts   SNR AngSep     Name
#  [deg]    [deg]    ['] [deg]  [deg]                   [']
170.1279 -60.6673   20.4  33.0 -167.5   1.5753   0.6    6.1	Cen X-3
186.5526 -62.7280    4.1  26.8 -178.0   7.2657   2.8    3.8	GX 301-2
244.9963 -15.6379    0.5  36.6   25.9  75.8285  21.9    1.0	Sco X-1
256.1667 -37.7217    0.0  31.4   69.0   6.9877   1.7   11.3	4U 1700-377
256.4352 -36.4167   27.0  32.1   66.8  -1.9238  -0.4    0.4	GX 349+2
263.0129 -24.7488   29.0  42.7   54.6  -2.7840  -0.4    0.3	GX 1+4
264.6023 -44.5797    5.1  35.5   84.3 -11.6448  -2.3    9.8	4U 1735-44
263.1443 -33.9630    4.7  38.1   66.9 -16.7813  -2.4   10.9	GX 354-0
216.8616 -85.3530    3.3  43.5  152.6  22.9014   3.5 ------	UNKNOWN
209.0642   8.9016    2.8  51.1  -35.1  28.5490   4.2 ------	UNKNOWN