Analysis Summary
Notes:
- 1) No attempt has been made to eliminate the non-significant decimal places.
- 2) This batgrbproduct analysis is done using the HEASARC data.
- 3) This batgrbproduct analysis is using the flight position for the mask-weighting calculation.
======================================================================
                  BAT GRB EVENT DATA PROCESSING REPORT
    Process Script Ver: batgrbproduct v2.46
    Process Start Time: Tue Oct  8 22:21:28 EDT 2019
             Host Name: bat1
   Current Working Dir: /local/data/bat1/alien/Swift_3rdBATcatalog/event/batevent_reproc/trigger922808
======================================================================

  Trigger: 00922808      Segment: 000

  BAT Trigger Time: 588690022.912   [s; MET]
      Trigger Stop: 588690023.936   [s; MET]
               UTC: 2019-08-28T12:59:59.424820    [includes UTCF correction]
       Where From?: TDRSS position message

  BAT
    RA: 251.818484637617   Dec: 27.2367605883349  [deg; J2000]

     Catalogged Source?: NO
     Point Source?:      YES
     GRB Indicated?:     YES    [ by BAT flight software ]
     Image S/N Ratio:    10.03
     Image Trigger?:     NO
     Rate S/N Ratio:     23.8537208837531  [ if not an image trigger ]
     Image S/N Ratio:    10.03

  Analysis Position:   [ source = BAT ]
    RA: 251.818484637617   Dec: 27.2367605883349  [deg; J2000]

  Refined Position:   [ source = BAT pre-slew burst ]
    RA: 251.83879365898   Dec: 27.2873737686881  [deg; J2000]
        { 16h 47m 21.3s , +27d 17' 14.5" }
         +/- 0.976653754306827 [arcmin] (estimated 90% radius based on SNR)
         +/- 0.282679763818496 [arcmin] (formal 1-sigma fit error)
    SNR: 31.4611527723104

  Angular difference between the analysis and refined position is 3.224188 arcmin

  Partial Coding Fraction: 1.015625    [ including projection effects ]

  Duration
     T90: 715.856000065804 +/- 451.971925576952
        Measured from: -28.0239999294281
                   to: 687.832000136375     [s; relative to TRIGTIME]
     T50: 29.7120000123978 +/- 4.12042716372911
        Measured from: 1.92800009250641
                   to: 31.6400001049042     [s; relative to TRIGTIME]


  Fluence
     Peak Flux  (peak 1 second)
        Measured from: 10.7960000038147
                   to: 11.7960000038147     [s; relative to TRIGTIME]
     Total Fluence
        Measured from: -42.3599998950958
                   to: 898.360000014305     [s; relative to TRIGTIME]

             Band 1     Band 2     Band 3     Band 4
              15-25      25-50     50-100    100-350     keV
 Total     1.766398   2.671623   2.089097   0.594960
           0.216751   0.216868   0.188473   0.163426 [error]
 Peak      0.069659   0.108446   0.108280   0.032659
           0.008510   0.009509   0.009424   0.007219 [error]

     [ fluence units of on-axis counts / fully illuminated detector ]

======================================================================


====== Table of the duration information =============================

        Value   tstart    tstop
T100  940.720  -42.360  898.360
T90   715.856  -28.024  687.832
T50    29.712    1.928   31.640
Peak    1.000   10.796   11.796


====== Spectral Analysis Summary =====================================

Model      : spectral model: simple power-law (PL) and cutoff power-law (CPL)
Ph_index   : photon index: E^{Ph_index}
Ph_90err   : 90% error of the photon index
Epeak      : Epeak in keV
Epeak_90err: 90% error of Epeak
Norm       : normalization at 50 keV in both the PL model and CPL model
Nomr_90err : 90% error of the normalization
chi2       : Chi-Squared
dof        : degree of freedo

=== Time-averaged spectral analysis ===
(Best model with acceptable fit: PL)

Model Ph_index Ph_90err_low Ph_90err_hi  Epeak  Epeak_90err_low  Epeak_90err_hi  Norm       Nomr_90err_low    Norm_90err_hi    chi2    dof
PL      -1.343    -0.160      0.161       -           -               -         4.86e-04     -4.31e-05          4.29e-05      50.470   57
CPL     -1.337    -0.164      0.558     9991.630    -9991.630      -9991.630      4.88e-04     -4.88e-04          4.15e-04      50.470   56


=== 1-s peak spectral analysis ===
(Best model with acceptable fit: PL)

Model Ph_index Ph_90err_low Ph_90err_hi  Epeak  Epeak_90err_low  Epeak_90err_hi  Norm       Nomr_90err_low    Norm_90err_hi    chi2    dof
PL      -1.150     -0.157     0.158       -           -               -         2.02e-02     -1.83e-03          1.83e-03      50.530   57
CPL     -0.949     -0.338     0.645      276.246    -276.246      -276.246      2.53e-02     -6.70e-03          2.56e-02      50.170   56


=== Fluence/Peak Flux Summary ===

              Model    Band1     Band2     Band3     Band4     Band5     Total
                       15-25     25-50    50-100    100-350    15-150    15-350    keV
Fluence         PL   5.04e-07  1.02e-06  1.61e-06  5.61e-06  4.47e-06  8.75e-06   erg/cm2
      90%_error_low -8.08e-08 -9.92e-08 -1.82e-07 -1.29e-06 -4.43e-07 -1.43e-06   erg/cm2
      90%_error_hi   8.45e-08  9.80e-08  1.80e-07  1.54e-06  4.47e-07  1.64e-06   erg/cm2
Peak flux       PL   5.95e-01  7.38e-01  6.66e-01  1.04e+00  2.36e+00  3.04e+00   ph/cm2/s
      90%_error_low -9.82e-02 -7.65e-02 -7.25e-02 -2.21e-01 -2.15e-01 -3.03e-01   ph/cm2/s
      90%_error_hi   1.03e-01  7.56e-02  7.17e-02  2.57e-01  2.15e-01  3.11e-01   ph/cm2/s

Fluence        CPL   5.08e-07  1.02e-06  1.60e-06  5.92e-06  4.49e-06  9.11e-06   erg/cm2
      90%_error_low -9.12e-08 -1.00e-07 -1.90e-07 -3.47e-06 -5.31e-07 -3.57e-06   erg/cm2
      90%_error_hi   8.80e-08  1.08e-07  2.12e-07  5.05e-07  3.62e-07  1.72e-08   erg/cm2
Peak flux      CPL   5.72e-01  7.52e-01  6.80e-01  8.19e-01  2.34e+00  2.82e+00   ph/cm2/s
      90%_error_low -1.19e-01 -8.46e-02 -8.10e-02 -3.95e-01 -2.22e-01 -4.61e-01   ph/cm2/s
      90%_error_hi   6.09e-02  8.73e-02  8.40e-02  2.81e-01  2.21e-01  3.86e-01   ph/cm2/s

======================================================================
Image
Pre-slew 15.0-350.0 keV image (Event data)
#   RAcent    DECcent   POSerr    Theta     Phi              Peak Cts       SNR   Name
  251.8388    27.2874   0.0061     2.9674   -20.3943         4.3387417     31.461 TRIG_00922808

Foreground time interval of the image:
-42.360  17.789 (delta_t =  60.149 [sec])
Background time interval of the image:
-447.611 -433.221 (delta_t =  14.390 [sec])
-239.912 -42.360 (delta_t = 197.552 [sec])
Light Curves
Note: The mask-weighted lightcurves have units of either count/det or counts/sec/det, where a det is 0.4 x 0.4 = 0.16 sq cm.
Full-time range; 1 s binning
Other quick-look light curves:
- 64 ms binning (zoomed)
- 16 ms binning (zoomed)
- 8 ms binning (zoomed)
- 2 ms binning (zoomed)
- SN=5 or 10 s binning (full-time range)
- Raw light curve
Spectra
- 64 ms binning (zoomed)
- 16 ms binning (zoomed)
- 8 ms binning (zoomed)
- 2 ms binning (zoomed)
- SN=5 or 10 s binning (full-time range)
- Raw light curve
Spectra
Notes:
- 1) The fitting includes the systematic errors.
- 2) When the burst includes telescope slew time periods, the fitting uses an average response file made from multiple 5-s response files through out the slew time plus single time preiod for the non-slew times, and weighted by the total counts in the corresponding time period using addrmf. An average response file is needed becuase a spectral fit using the pre-slew DRM will introduce some errors in both a spectral shape and a normalization if the PHA file contains a lot of the slew/post-slew time interval.
- 3) For fits to more complicated models (e.g. a power-law over a cutoff power-law), the BAT team has decided to require a chi-square improvement of more than 6 for each extra dof.
Time averaged spectrum fit using the average DRM
Power-law model
Time interval is from  -42.360 sec. to  898.360 sec.

Spectral model in power-law:
------------------------------------------------------------
Parameters  : value       lower 90%   higher 90%
Photon index: -1.34321     ( -0.160123   0.160937 )
Norm@50keV  : 4.86136E-04    ( -4.30633e-05   4.2942e-05 )
------------------------------------------------------------
#Fit statistic : Chi-Squared =          50.47 using 59 PHA bins.
# Reduced chi-squared =         0.8854 for     57 degrees of freedom
# Null hypothesis probability =   7.169395e-01

Photon flux (15-150 keV)    in 940.7 sec: 5.84850E-02 ( -0.0052806  0.0052928 ) ph/cm2/s
Energy fluence (15-150 keV)             : 4.47385e-06 ( -4.42583e-07  4.47128e-07 ) ergs/cm2
Cutoff power-law model

Time interval is from  -42.360 sec. to  898.360 sec.
Spectral model in the cutoff power-law:
------------------------------------------------------------
Parameters  : value       lower 90%   higher 90%
Photon index: -1.33706     ( -0.162387   0.559668 )
Epeak [keV] : 9991.63      ( -9999.08 -9999.08 )
Norm@50keV  : 4.88188E-04    ( -0.000488054   0.000415078 )
------------------------------------------------------------
#Fit statistic : Chi-Squared =          50.47 using 59 PHA bins.
# Reduced chi-squared =         0.9013 for     56 degrees of freedom
# Null hypothesis probability =   6.833295e-01

Photon flux (15-150 keV)    in 940.7 sec: 5.86258E-02 ( -0.005853  0.0054238 ) ph/cm2/s
Energy fluence (15-150 keV)             : 4.49098e-06 ( -5.31379e-07  3.6248e-07 ) ergs/cm2
1-s peak spectrum fit
Power-law model
Time interval is from   10.796 sec. to   11.796 sec.

Spectral model in power-law:
------------------------------------------------------------
Parameters  : value       lower 90%   higher 90%
Photon index: -1.14991     ( -0.157076   0.158197 )
Norm@50keV  : 2.02176E-02    ( -0.00183406   0.00183247 )
------------------------------------------------------------
#Fit statistic : Chi-Squared =          50.53 using 59 PHA bins.
# Reduced chi-squared =         0.8864 for     57 degrees of freedom
# Null hypothesis probability =   7.149204e-01

Photon flux (15-150 keV)    in 1 sec: 2.35776 ( -0.21521  0.21532 ) ph/cm2/s
Energy fluence (15-150 keV)             : 2.08157e-07 ( -2.17595e-08  2.19501e-08 ) ergs/cm2
Cutoff power-law model
Time interval is from   10.796 sec. to   11.796 sec.
Spectral model in the cutoff power-law:
------------------------------------------------------------
Parameters  : value       lower 90%   higher 90%
Photon index: -0.948592     ( -0.337955   0.644996 )
Epeak [keV] : 276.246      ( -276.247 -276.247 )
Norm@50keV  : 2.53275E-02    ( -0.00670485   0.0255659 )
------------------------------------------------------------
#Fit statistic : Chi-Squared =          50.17 using 59 PHA bins.
# Reduced chi-squared =         0.8960 for     56 degrees of freedom
# Null hypothesis probability =   6.939793e-01

Photon flux (15-150 keV)    in 1 sec: 2.33994 ( -0.22187  0.22106 ) ph/cm2/s
Energy fluence (15-150 keV)             : 2.05215e-07 ( -2.37052e-08  2.33607e-08 ) ergs/cm2
Time-resolved spectra

Distribution
T90 vs. Hardness ratio plot

T90                                   = 715.856 sec.
Hardness ratio (energy fluence ratio) = 1.5765948873
S(15-50 keV) vs. S(50-150 keV) plot
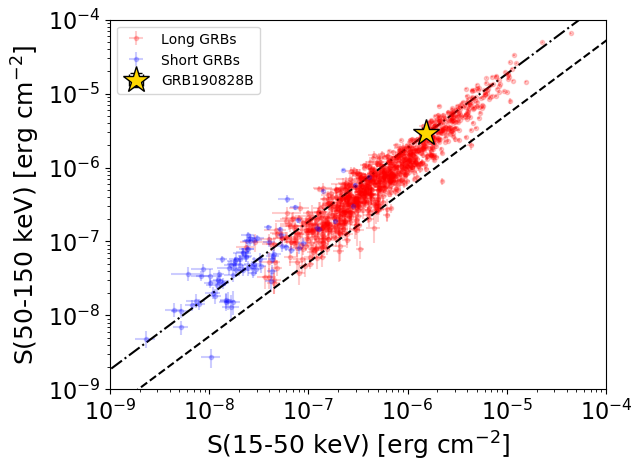
S(15-50 keV)  = 1.5241522e-06
S(50-150 keV) = 2.949643e-06
The dash-dotted line and the dashed line traces the fluences calculated from the Band function with Epeak = 15 and 150 keV, respectively. Both lines assume a canonical values of alpha = -1 and beta = -2.5.
Mask shadow pattern

IMX = 4.858860036242880E-02, IMY = 1.806440290452787E-02
Spacecraft aspect plot

Bright source in the pre-burst/pre-slew/post-slew images
Pre-burst image of 15-350 keV band
Time interval of the image:
-447.611410 -433.221300
-239.912000 -42.360000

# RAcent  DECcent POSerr Theta    Phi  PeakCts   SNR AngSep     Name
#  [deg]    [deg]    ['] [deg]  [deg]                   [']
244.9990 -15.6352    1.9  40.5  172.5   5.0825   6.1    1.2	Sco X-1
254.2698  35.3502    6.2  11.2   -8.2   0.8183   1.9    9.2	Her X-1
268.3700  -1.3167    4.0  30.2  128.0  -2.4041  -2.9    8.2	SW J1753.5-0127
288.8216  10.9213   59.8  37.4   86.5   0.2732   0.2    2.0	GRS 1915+105
299.6793  35.2066    2.1  42.4   45.8   5.9845   5.4    4.4	Cyg X-1
307.9849  41.0272   10.6  49.1   38.0  -1.6589  -1.1    7.2	Cyg X-3
244.6953 -21.6761    2.9  46.5  171.5   4.6869   4.0 ------	UNKNOWN
230.6772  35.5008    2.5  21.5  -71.6   2.4118   4.6 ------	UNKNOWN
Pre-slew background subtracted image of 15-350 keV band
Time interval of the image:
-42.360000 17.788590

# RAcent  DECcent POSerr Theta    Phi  PeakCts   SNR AngSep     Name
#  [deg]    [deg]    ['] [deg]  [deg]                   [']
244.9703 -15.7249    5.3  40.6  172.5   0.5263   2.2    5.1	Sco X-1
254.6315  35.3023    5.1  11.2   -6.7  -0.3177  -2.3    8.8	Her X-1
268.4232  -1.3255   12.5  30.2  127.9  -0.2447  -0.9    8.3	SW J1753.5-0127
288.9876  10.9727    7.1  37.6   86.3  -0.8832  -1.6   11.3	GRS 1915+105
299.5972  35.3340    6.7  42.3   45.6  -0.7072  -1.7    8.0	Cyg X-1
308.0832  41.0931    5.6  49.2   37.9  -1.2819  -2.0    8.5	Cyg X-3
251.8388  27.2874    0.4   3.0  -20.4   4.3386  31.5 ------	UNKNOWN
226.9891  43.0471    2.4  27.8  -59.4   0.7439   4.8 ------	UNKNOWN
Post-slew image of 15-350 keV band
Time interval of the image:
41.988600 962.219300
1771.088000 1918.863800

# RAcent  DECcent POSerr Theta    Phi  PeakCts   SNR AngSep     Name
#  [deg]    [deg]    ['] [deg]  [deg]                   [']
244.9881 -15.6424    1.7  43.4  178.8  28.2691   6.9    0.5	Sco X-1
254.2828  35.3855    6.5   8.4    3.1  -3.3202  -1.8    8.9	Her X-1
268.2276  -1.4371    7.0  32.7  137.8  -6.1198  -1.6    8.5	SW J1753.5-0127
288.7897  10.9463   66.2  38.3   97.1   1.1109   0.2    0.5	GRS 1915+105
299.6331  35.1123    3.9  41.3   56.0  16.9162   2.9    5.8	Cyg X-1
250.0808 -19.2709    3.0  46.5  171.5  19.8038   3.9 ------	UNKNOWN
261.7136  64.1732    2.4  37.5   -3.7  11.5139   4.8 ------	UNKNOWN
253.5336  77.2370    2.5  50.0  -10.2  15.6220   4.5 ------	UNKNOWN