Analysis Summary
Notes:
- 1) No attempt has been made to eliminate the non-significant decimal places.
- 2) This batgrbproduct analysis is done using the HEASARC data.
- 3) This batgrbproduct analysis is using the flight position for the mask-weighting calculation.
======================================================================
BAT GRB EVENT DATA PROCESSING REPORT
Process Script Ver: batgrbproduct v2.46
Process Start Time: Tue Oct 8 22:17:34 EDT 2019
Host Name: bat1
Current Working Dir: /local/data/bat1/alien/Swift_3rdBATcatalog/event/batevent_reproc/trigger922968
======================================================================
Trigger: 00922968 Segment: 000
BAT Trigger Time: 588801428.096 [s; MET]
Trigger Stop: 588801429.12 [s; MET]
UTC: 2019-08-29T19:56:44.601720 [includes UTCF correction]
Where From?: TDRSS position message
BAT
RA: 44.5397196710187 Dec: -8.96781199714715 [deg; J2000]
Catalogged Source?: NO
Point Source?: YES
GRB Indicated?: YES [ by BAT flight software ]
Image S/N Ratio: 8.51
Image Trigger?: NO
Rate S/N Ratio: 23.7065391822594 [ if not an image trigger ]
Image S/N Ratio: 8.51
Analysis Position: [ source = BAT ]
RA: 44.5397196710187 Dec: -8.96781199714715 [deg; J2000]
Refined Position: [ source = BAT pre-slew burst ]
RA: 44.5418653954335 Dec: -8.95789022098407 [deg; J2000]
{ 02h 58m 10.0s , -08d 57' 28.4" }
+/- 1.9303553917174 [arcmin] (estimated 90% radius based on SNR)
+/- 0.968985195904689 [arcmin] (formal 1-sigma fit error)
SNR: 11.886804852414
Angular difference between the analysis and refined position is 0.61 arcmin
Partial Coding Fraction: 0.04248047 [ including projection effects ]
Duration
T90: 56.8959999084473 +/- 47.0011049601117
Measured from: -50.5519999265671
to: 6.34399998188019 [s; relative to TRIGTIME]
T50: 4.28799986839294 +/- 1.31784066564192
Measured from: -1.71999990940094
to: 2.567999958992 [s; relative to TRIGTIME]
Fluence
Peak Flux (peak 1 second)
Measured from: -0.0119999647140503
to: 0.98800003528595 [s; relative to TRIGTIME]
Total Fluence
Measured from: -51.8959999084473
to: 7.24000000953674 [s; relative to TRIGTIME]
Band 1 Band 2 Band 3 Band 4
15-25 25-50 50-100 100-350 keV
Total 4.596365 4.613677 1.547082 -0.122486
0.382614 0.391842 0.333390 0.318171 [error]
Peak 0.816761 0.588829 0.174093 0.033045
0.088826 0.082323 0.054750 0.043576 [error]
[ fluence units of on-axis counts / fully illuminated detector ]
======================================================================
====== Table of the duration information =============================
Value tstart tstop
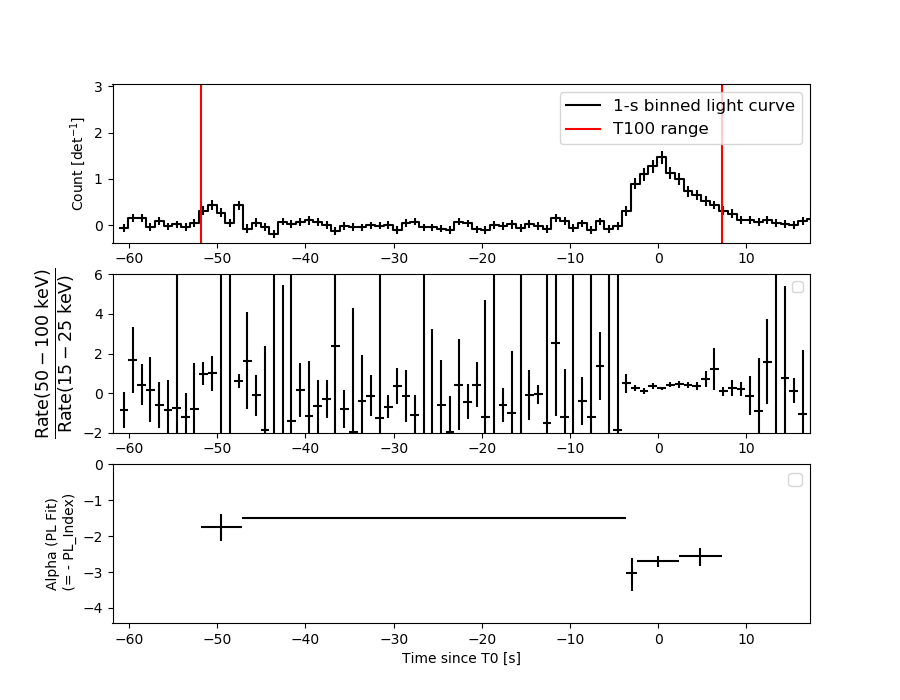
T100 59.136 -51.896 7.240
T90 56.896 -50.552 6.344
T50 4.288 -1.720 2.568
Peak 1.000 -0.012 0.988
====== Spectral Analysis Summary =====================================
Model : spectral model: simple power-law (PL) and cutoff power-law (CPL)
Ph_index : photon index: E^{Ph_index}
Ph_90err : 90% error of the photon index
Epeak : Epeak in keV
Epeak_90err: 90% error of Epeak
Norm : normalization at 50 keV in both the PL model and CPL model
Nomr_90err : 90% error of the normalization
chi2 : Chi-Squared
dof : degree of freedo
=== Time-averaged spectral analysis ===
(Best model with acceptable fit: PL)
Model Ph_index Ph_90err_low Ph_90err_hi Epeak Epeak_90err_low Epeak_90err_hi Norm Nomr_90err_low Norm_90err_hi chi2 dof
PL -2.564 -0.222 0.205 - - - 1.06e-02 -1.64e-03 1.62e-03 52.980 57
CPL -1.370 -0.641 1.577 18.898 N/A N/A 5.95e-02 N/A N/A 49.250 56
=== 1-s peak spectral analysis ===
(Best model with acceptable fit: PL)
Model Ph_index Ph_90err_low Ph_90err_hi Epeak Epeak_90err_low Epeak_90err_hi Norm Nomr_90err_low Norm_90err_hi chi2 dof
PL -3.232 -0.360 0.302 - - - 5.50e-02 -1.49e-02 1.48e-02 58.280 57
CPL -1.000 N/A N/A 80.000 N/A N/A 1.07e-01 N/A N/A 131.660 56
=== Fluence/Peak Flux Summary ===
Model Band1 Band2 Band3 Band4 Band5 Total
15-25 25-50 50-100 100-350 15-150 15-350 keV
Fluence PL 2.19e-06 2.12e-06 1.44e-06 1.52e-06 6.37e-06 7.28e-06 erg/cm2
90%_error_low -2.85e-07 -2.28e-07 -2.95e-07 -5.24e-07 -7.16e-07 -9.91e-07 erg/cm2
90%_error_hi 2.91e-07 2.26e-07 3.10e-07 6.86e-07 7.29e-07 1.09e-06 erg/cm2
Peak flux PL 1.23e+01 4.56e+00 9.70e-01 2.46e-01 1.80e+01 1.81e+01 ph/cm2/s
90%_error_low -2.18e+00 -7.99e-01 -3.20e-01 -1.21e-01 -2.72e+00 -2.73e+00 ph/cm2/s
90%_error_hi 2.23e+00 7.75e-01 3.44e-01 1.72e-01 2.73e+00 2.73e+00 ph/cm2/s
Fluence CPL N/A N/A N/A N/A N/A N/A erg/cm2
90%_error_low -2.85e-07 -2.28e-07 -2.95e-07 -5.24e-07 -7.16e-07 -9.91e-07 erg/cm2
90%_error_hi 2.91e-07 2.26e-07 3.10e-07 6.86e-07 7.29e-07 1.09e-06 erg/cm2
Peak flux CPL N/A N/A N/A N/A N/A N/A ph/cm2/s
90%_error_low -2.18e+00 -7.99e-01 -3.20e-01 -1.21e-01 -2.72e+00 -2.73e+00 ph/cm2/s
90%_error_hi 2.23e+00 7.75e-01 3.44e-01 1.72e-01 2.73e+00 2.73e+00 ph/cm2/s
======================================================================
Image
Pre-slew 15.0-350.0 keV image (Event data)
#   RAcent    DECcent   POSerr    Theta     Phi              Peak Cts       SNR   Name
   44.5419    -8.9579   0.0161    53.0564   169.5545        11.4549532     11.887 TRIG_00922968

Foreground time interval of the image:
-51.896  12.005 (delta_t =  63.901 [sec])
Background time interval of the image:
-153.795 -51.896 (delta_t = 101.899 [sec])
Light Curves
Note: The mask-weighted lightcurves have units of either count/det or counts/sec/det, where a det is 0.4 x 0.4 = 0.16 sq cm.
Full-time range; 1 s binning
Other quick-look light curves:
- 64 ms binning (zoomed)
- 16 ms binning (zoomed)
- 8 ms binning (zoomed)
- 2 ms binning (zoomed)
- SN=5 or 10 s binning (full-time range)
- Raw light curve
Spectra
- 64 ms binning (zoomed)
- 16 ms binning (zoomed)
- 8 ms binning (zoomed)
- 2 ms binning (zoomed)
- SN=5 or 10 s binning (full-time range)
- Raw light curve
Spectra
Notes:
- 1) The fitting includes the systematic errors.
- 2) When the burst includes telescope slew time periods, the fitting uses an average response file made from multiple 5-s response files through out the slew time plus single time preiod for the non-slew times, and weighted by the total counts in the corresponding time period using addrmf. An average response file is needed becuase a spectral fit using the pre-slew DRM will introduce some errors in both a spectral shape and a normalization if the PHA file contains a lot of the slew/post-slew time interval.
- 3) For fits to more complicated models (e.g. a power-law over a cutoff power-law), the BAT team has decided to require a chi-square improvement of more than 6 for each extra dof.
Time averaged spectrum fit using the average DRM
Power-law model
Time interval is from  -51.896 sec. to    7.240 sec.

Spectral model in power-law:
------------------------------------------------------------
Parameters  : value       lower 90%   higher 90%
Photon index: -2.56418     ( -0.221602   0.205265 )
Norm@50keV  : 1.05722E-02    ( -0.00163808   0.00161571 )
------------------------------------------------------------
#Fit statistic : Chi-Squared =          52.98 using 59 PHA bins.
# Reduced chi-squared =         0.9295 for     57 degrees of freedom
# Null hypothesis probability =   6.265477e-01

Photon flux (15-150 keV)    in 59.14 sec: 2.16162 ( -0.21713  0.21736 ) ph/cm2/s
Energy fluence (15-150 keV)             : 6.36796e-06 ( -7.16233e-07  7.29149e-07 ) ergs/cm2
Cutoff power-law model
Time interval is from  -51.896 sec. to    7.240 sec.
Spectral model in the cutoff power-law:
------------------------------------------------------------
Parameters  : value       lower 90%   higher 90%
Photon index: -1.36963     ( -0.642839   1.57487 )
Epeak [keV] : 18.8978      (   )
Norm@50keV  : 5.94836E-02    (     )
------------------------------------------------------------
#Fit statistic : Chi-Squared =          49.25 using 59 PHA bins.
# Reduced chi-squared =         0.8794 for     56 degrees of freedom
# Null hypothesis probability =   7.264320e-01

Photon flux (15-150 keV)    in 59.14 sec:  (    ) ph/cm2/s
Energy fluence (15-150 keV)             : 0 ( 0  0 ) ergs/cm2
1-s peak spectrum fit
Power-law model
Time interval is from   -0.012 sec. to    0.988 sec.

Spectral model in power-law:
------------------------------------------------------------
Parameters  : value       lower 90%   higher 90%
Photon index: -3.23166     ( -0.360041   0.301917 )
Norm@50keV  : 5.50036E-02    ( -0.0149091   0.0147579 )
------------------------------------------------------------
#Fit statistic : Chi-Squared =          58.28 using 59 PHA bins.
# Reduced chi-squared =          1.022 for     57 degrees of freedom
# Null hypothesis probability =   4.281806e-01

Photon flux (15-150 keV)    in 1 sec: 17.9964 ( -2.7245  2.7275 ) ph/cm2/s
Energy fluence (15-150 keV)             : 7.42027e-07 ( -1.16926e-07  1.17659e-07 ) ergs/cm2
Cutoff power-law model
Time interval is from   -0.012 sec. to    0.988 sec.
Spectral model in the cutoff power-law:
------------------------------------------------------------
Parameters  : value       lower 90%   higher 90%
Photon index: -1     (       )
Epeak [keV] : 80.0000      (   )
Norm@50keV  : 0.106818    (     )
------------------------------------------------------------
#Fit statistic : Chi-Squared =         131.66 using 59 PHA bins.
# Reduced chi-squared =         2.3510 for     56 degrees of freedom
# Null hypothesis probability =   4.936829e-08

Photon flux (15-150 keV)    in 1 sec:  (    ) ph/cm2/s
Energy fluence (15-150 keV)             : 0 ( 0  0 ) ergs/cm2
Time-resolved spectra
Distribution
T90 vs. Hardness ratio plot
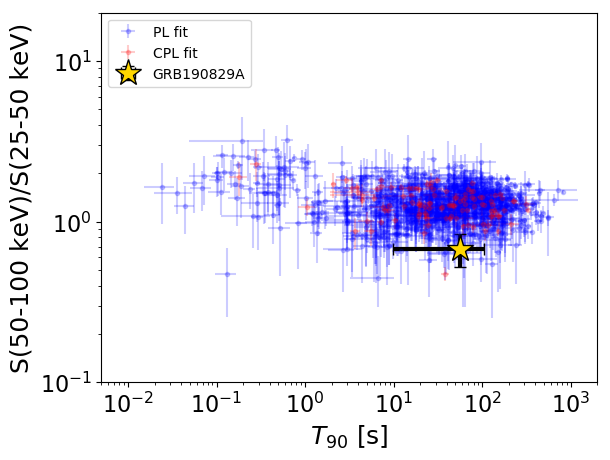
T90                                   = 56.896 sec.
Hardness ratio (energy fluence ratio) = 0.676394318463
S(15-50 keV) vs. S(50-150 keV) plot
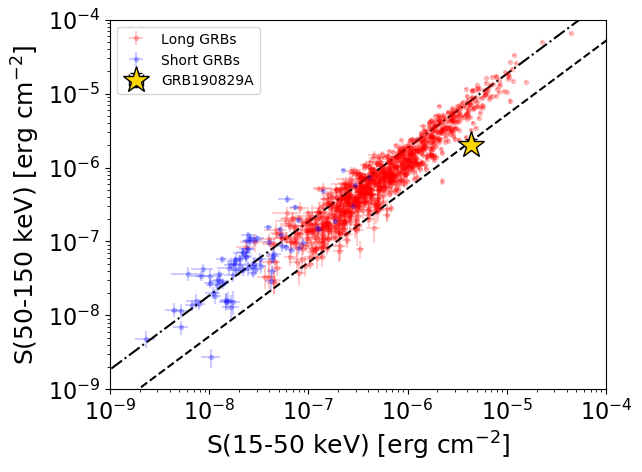
S(15-50 keV)  = 4.317136e-06
S(50-150 keV) = 2.0509393e-06
The dash-dotted line and the dashed line traces the fluences calculated from the Band function with Epeak = 15 and 150 keV, respectively. Both lines assume a canonical values of alpha = -1 and beta = -2.5.
Mask shadow pattern
IMX = -1.307727448355517E+00, IMY = -2.410857632435768E-01
Spacecraft aspect plot
Bright source in the pre-burst/pre-slew/post-slew images
Pre-burst image of 15-350 keV band
Time interval of the image:
-153.795410 -51.896000

# RAcent  DECcent POSerr Theta    Phi  PeakCts   SNR AngSep     Name
#  [deg]    [deg]    ['] [deg]  [deg]                   [']
342.9171 -29.1791    2.4  39.3   81.9   4.0342   4.8 ------	UNKNOWN
338.3553 -30.9460    2.4  39.9   75.2   4.5459   4.8 ------	UNKNOWN
 27.1653 -14.1734    2.4  44.9  148.5   4.4040   4.8 ------	UNKNOWN
303.6921 -50.3429    2.5  42.9   25.7   1.8258   4.6 ------	UNKNOWN
 16.5381 -48.7423    2.4  10.4  124.0   1.1339   4.9 ------	UNKNOWN
 65.4878 -32.7404    2.4  39.5 -151.7   1.6657   4.8 ------	UNKNOWN
 89.7463 -72.3481    2.8  29.3  -75.6   1.2521   4.1 ------	UNKNOWN
 86.3455 -61.0966    2.7  31.5  -97.7   1.4761   4.3 ------	UNKNOWN
Pre-slew background subtracted image of 15-350 keV band
Time interval of the image:
-51.896000 7.240000

# RAcent  DECcent POSerr Theta    Phi  PeakCts   SNR AngSep     Name
#  [deg]    [deg]    ['] [deg]  [deg]                   [']
 44.5426  -8.9549    1.1  53.1  169.6  11.3343  11.0 ------	UNKNOWN
Post-slew image of 15-350 keV band
Time interval of the image:
86.004600 662.984000
720.904000 963.024000

# RAcent  DECcent POSerr Theta    Phi  PeakCts   SNR AngSep     Name
#  [deg]    [deg]    ['] [deg]  [deg]                   [']
 23.7252  28.2696    3.0  42.3  158.7  14.8415   3.8 ------	UNKNOWN
 53.9167  29.3317    3.5  39.4 -160.7   7.8039   3.3 ------	UNKNOWN
 66.2059 -12.7564    2.3  21.6  -71.7   8.9953   4.9 ------	UNKNOWN
 74.6902  -9.1561    2.6  29.8  -80.9   9.6354   4.4 ------	UNKNOWN