Analysis Summary
Notes:
- 1) No attempt has been made to eliminate the non-significant decimal places.
- 2) This batgrbproduct analysis is done using the HEASARC data.
- 3) This batgrbproduct analysis is using the flight position for the mask-weighting calculation.
======================================================================
                  BAT GRB EVENT DATA PROCESSING REPORT
    Process Script Ver: batgrbproduct v2.46
    Process Start Time: Wed Nov 27 12:21:50 EST 2019
             Host Name: bat1
   Current Working Dir: /local/data/bat1/alien/Swift_3rdBATcatalog/event/batevent_reproc/trigger927825
======================================================================

  Trigger: 00927825      Segment: 000

  BAT Trigger Time: 591905246.556   [s; MET]
      Trigger Stop: 591905246.62   [s; MET]
               UTC: 2019-10-04T18:07:02.863100    [includes UTCF correction]
       Where From?: (*SHORT BURST*) TDRSS scaled map message

  BAT
    RA: 31.7210640523513   Dec: -36.9316566745842  [deg; J2000]

     Catalogged Source?: NO
     Point Source?:      YES
     GRB Indicated?:     YES    [ by BAT flight software ]
     Image S/N Ratio:    9.12
     Image Trigger?:     NO
     Rate S/N Ratio:     32.832910318764  [ if not an image trigger ]
     Image S/N Ratio:    9.12

  Analysis Position:   [ source = BAT ]
    RA: 31.7210640523513   Dec: -36.9316566745842  [deg; J2000]

  Refined Position:   [ source = BAT pre-slew burst ]
    RA: 31.7139802104934   Dec: -36.9309718663815  [deg; J2000]
        { 02h 06m 51.4s , -36d 55' 51.5" }
         +/- 1.07578999970331 [arcmin] (estimated 90% radius based on SNR)
         +/- 0.34475150531572 [arcmin] (formal 1-sigma fit error)
    SNR: 27.4027012457388

  Angular difference between the analysis and refined position is 0.342226 arcmin

  Partial Coding Fraction: 0.2617188    [ including projection effects ]

  Duration
     T90: 2.44399988651276 +/- 0.0823651038377751
        Measured from: -0.0119999647140503
                   to: 2.43199992179871     [s; relative to TRIGTIME]
     T50: 1.77599990367889 +/- 0.0651152861923527
        Measured from: 0.220000028610229
                   to: 1.99599993228912     [s; relative to TRIGTIME]


  Fluence
     Peak Flux  (peak 1 second)
        Measured from: -0.0920000076293945
                   to: 0.907999992370605     [s; relative to TRIGTIME]
     Total Fluence
        Measured from: -0.0920000076293945
                   to: 2.57599997520447     [s; relative to TRIGTIME]

             Band 1     Band 2     Band 3     Band 4
              15-25      25-50     50-100    100-350     keV
 Total     0.417915   0.642368   0.618592   0.148959
           0.026410   0.030320   0.028500   0.018947 [error]
 Peak      0.228848   0.328201   0.313187   0.062025
           0.017903   0.020629   0.019036   0.011697 [error]

     [ fluence units of on-axis counts / fully illuminated detector ]

======================================================================


====== Table of the duration information =============================

        Value   tstart    tstop
T100    2.668   -0.092    2.576
T90     2.444   -0.012    2.432
T50     1.776    0.220    1.996
Peak    1.000   -0.092    0.908


====== Spectral Analysis Summary =====================================

Model      : spectral model: simple power-law (PL) and cutoff power-law (CPL)
Ph_index   : photon index: E^{Ph_index}
Ph_90err   : 90% error of the photon index
Epeak      : Epeak in keV
Epeak_90err: 90% error of Epeak
Norm       : normalization at 50 keV in both the PL model and CPL model
Nomr_90err : 90% error of the normalization
chi2       : Chi-Squared
dof        : degree of freedo

=== Time-averaged spectral analysis ===
(Best model with acceptable fit: PL)

Model Ph_index Ph_90err_low Ph_90err_hi  Epeak  Epeak_90err_low  Epeak_90err_hi  Norm       Nomr_90err_low    Norm_90err_hi    chi2    dof
PL      -1.350    -0.084      0.084       -           -               -         4.83e-02     -2.38e-03          2.38e-03      56.430   57
CPL     -1.048    -0.323      0.341      174.070     -64.160      -174.070      6.69e-02     -1.89e-02          2.84e-02      53.780   56


=== 1-s peak spectral analysis ===
(Best model with acceptable fit: N/A)

Model Ph_index Ph_90err_low Ph_90err_hi  Epeak  Epeak_90err_low  Epeak_90err_hi  Norm       Nomr_90err_low    Norm_90err_hi    chi2    dof
PL      -1.481     -0.104     0.103       -           -               -         6.28e-02     -4.14e-03          4.14e-03      76.070   57
CPL     -0.807     -0.429     0.470       93.666     -19.250        68.545      1.34e-01     -5.04e-02          8.90e-02      68.530   56


=== Fluence/Peak Flux Summary ===

              Model    Band1     Band2     Band3     Band4     Band5     Total
                       15-25     25-50    50-100    100-350    15-150    15-350    keV
Fluence         PL   1.43e-07  2.88e-07  4.52e-07  1.57e-06  1.26e-06  2.45e-06   erg/cm2
      90%_error_low -1.28e-08 -1.60e-08 -2.68e-08 -1.93e-07 -6.69e-08 -2.13e-07   erg/cm2
      90%_error_hi   1.32e-08  1.59e-08  2.66e-08  2.10e-07  6.71e-08  2.26e-07   erg/cm2
Peak flux       PL   2.54e+00  2.58e+00  1.85e+00  2.12e+00  7.80e+00  9.09e+00   ph/cm2/s
      90%_error_low -2.76e-01 -1.83e-01 -1.46e-01 -3.14e-01 -5.24e-01 -5.97e-01   ph/cm2/s
      90%_error_hi   2.84e-01  1.82e-01  1.45e-01  3.42e-01  5.25e-01  5.98e-01   ph/cm2/s

Fluence        CPL   1.34e-07  2.96e-07  4.67e-07  1.06e-06  1.24e-06  1.95e-06   erg/cm2
      90%_error_low -1.58e-08 -1.80e-08 -3.13e-08 -3.42e-07 -6.96e-08 -3.42e-07   erg/cm2
      90%_error_hi   1.60e-08  1.82e-08  3.18e-08  5.16e-07  6.94e-08  5.36e-07   erg/cm2
Peak flux      CPL   2.23e+00  2.75e+00  2.01e+00  1.15e+00  7.67e+00  8.13e+00   ph/cm2/s
      90%_error_low -3.33e-01 -2.16e-01 -1.79e-01 -3.54e-01 -5.32e-01 -6.50e-01   ph/cm2/s
      90%_error_hi   3.41e-01  2.20e-01  1.82e-01  5.35e-01  5.32e-01  7.19e-01   ph/cm2/s

======================================================================
Image
Pre-slew 15.0-350.0 keV image (Event data)
#   RAcent    DECcent   POSerr    Theta     Phi              Peak Cts       SNR   Name
   31.7140   -36.9310   0.0070    35.9837   117.7876         1.9039448     27.403 TRIG_00927825

Foreground time interval of the image:
 -0.092   2.576 (delta_t =   2.668 [sec])
Background time interval of the image:
-239.556  -0.092 (delta_t = 239.464 [sec])
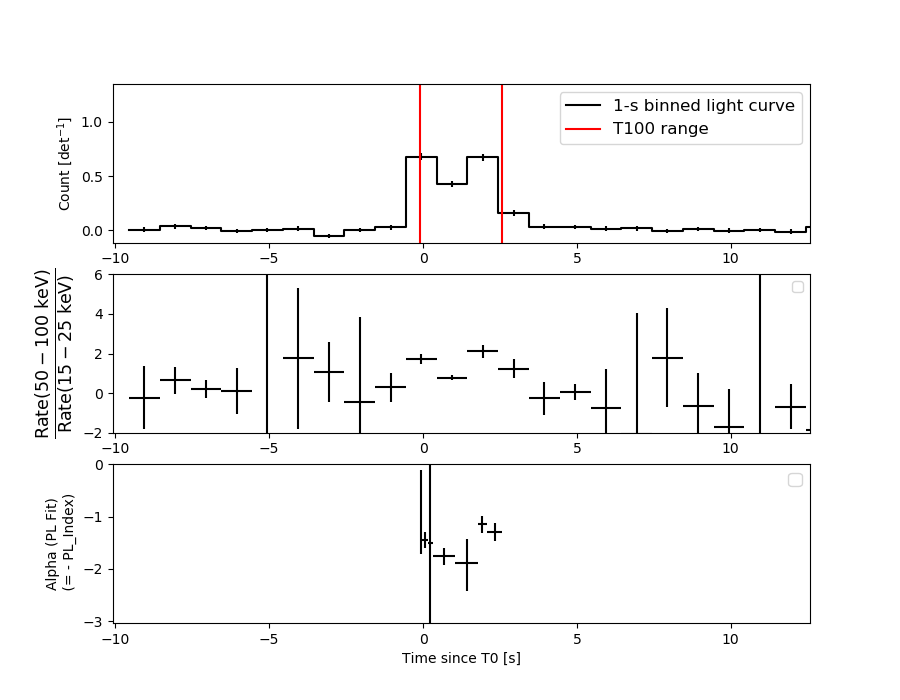
Light Curves
Note: The mask-weighted lightcurves have units of either count/det or counts/sec/det, where a det is 0.4 x 0.4 = 0.16 sq cm.
Full-time range; 1 s binning
Other quick-look light curves:
- 64 ms binning (zoomed)
- 16 ms binning (zoomed)
- 8 ms binning (zoomed)
- 2 ms binning (zoomed)
- SN=5 or 10 s binning (full-time range)
- Raw light curve
Spectra
- 64 ms binning (zoomed)
- 16 ms binning (zoomed)
- 8 ms binning (zoomed)
- 2 ms binning (zoomed)
- SN=5 or 10 s binning (full-time range)
- Raw light curve
Spectra
Notes:
- 1) The fitting includes the systematic errors.
- 2) When the burst includes telescope slew time periods, the fitting uses an average response file made from multiple 5-s response files through out the slew time plus single time preiod for the non-slew times, and weighted by the total counts in the corresponding time period using addrmf. An average response file is needed becuase a spectral fit using the pre-slew DRM will introduce some errors in both a spectral shape and a normalization if the PHA file contains a lot of the slew/post-slew time interval.
- 3) For fits to more complicated models (e.g. a power-law over a cutoff power-law), the BAT team has decided to require a chi-square improvement of more than 6 for each extra dof.
Time averaged spectrum fit using the average DRM
Power-law model
Time interval is from   -0.092 sec. to    2.576 sec.

Spectral model in power-law:
------------------------------------------------------------
Parameters  : value       lower 90%   higher 90%
Photon index: -1.35044     ( -0.0838034   0.0838171 )
Norm@50keV  : 4.82799E-02    ( -0.00237783   0.0023776 )
------------------------------------------------------------
#Fit statistic : Chi-Squared =          56.43 using 59 PHA bins.
# Reduced chi-squared =         0.9900 for     57 degrees of freedom
# Null hypothesis probability =   4.963793e-01

Photon flux (15-150 keV)    in 2.668 sec: 5.81694 ( -0.30015  0.30056 ) ph/cm2/s
Energy fluence (15-150 keV)             : 1.2581e-06 ( -6.69249e-08  6.70821e-08 ) ergs/cm2
Cutoff power-law model
Time interval is from   -0.092 sec. to    2.576 sec.
Spectral model in the cutoff power-law:
------------------------------------------------------------
Parameters  : value       lower 90%   higher 90%
Photon index: -1.04767     ( -0.322737   0.341034 )
Epeak [keV] : 174.070      ( -64.1602 -174.07 )
Norm@50keV  : 6.68534E-02    ( -0.0188982   0.0284271 )
------------------------------------------------------------
#Fit statistic : Chi-Squared =          53.78 using 59 PHA bins.
# Reduced chi-squared =         0.9604 for     56 degrees of freedom
# Null hypothesis probability =   5.593723e-01

Photon flux (15-150 keV)    in 2.668 sec: 5.74688 ( -0.30874  0.30901 ) ph/cm2/s
Energy fluence (15-150 keV)             : 1.24307e-06 ( -6.95646e-08  6.93571e-08 ) ergs/cm2
1-s peak spectrum fit
Power-law model
Time interval is from   -0.092 sec. to    0.908 sec.

Spectral model in power-law:
------------------------------------------------------------
Parameters  : value       lower 90%   higher 90%
Photon index: -1.48139     ( -0.104241   0.103489 )
Norm@50keV  : 6.28050E-02    ( -0.00414283   0.00413688 )
------------------------------------------------------------
#Fit statistic : Chi-Squared =          76.07 using 59 PHA bins.
# Reduced chi-squared =          1.335 for     57 degrees of freedom
# Null hypothesis probability =   4.651691e-02

Photon flux (15-150 keV)    in 1 sec: 7.80215 ( -0.52434  0.52482 ) ph/cm2/s
Energy fluence (15-150 keV)             : 5.97737e-07 ( -4.22678e-08  4.24104e-08 ) ergs/cm2
Cutoff power-law model
Time interval is from   -0.092 sec. to    0.908 sec.
Spectral model in the cutoff power-law:
------------------------------------------------------------
Parameters  : value       lower 90%   higher 90%
Photon index: -0.806976     ( -0.428726   0.469556 )
Epeak [keV] : 93.6656      ( -19.2499 68.5451 )
Norm@50keV  : 0.134295    ( -0.050397   0.089033 )
------------------------------------------------------------
#Fit statistic : Chi-Squared =          68.53 using 59 PHA bins.
# Reduced chi-squared =          1.224 for     56 degrees of freedom
# Null hypothesis probability =   1.214079e-01

Photon flux (15-150 keV)    in 1 sec: 7.66691 ( -0.53231  0.53245 ) ph/cm2/s
Energy fluence (15-150 keV)             : 3.42492e-07 ( -4.90042e-08  4.23035e-08 ) ergs/cm2
Time-resolved spectra
Distribution
T90 vs. Hardness ratio plot
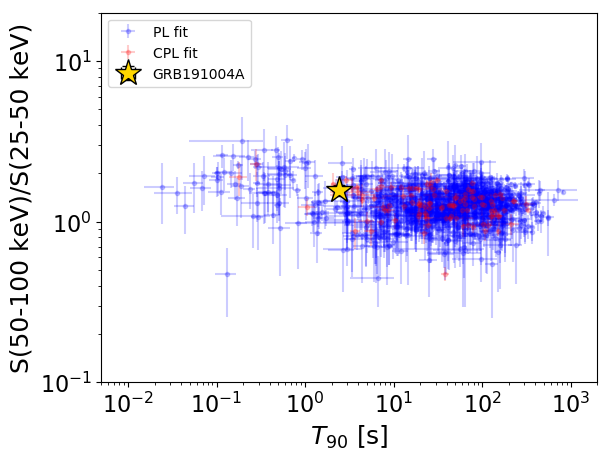
T90                                   = 2.444 sec.
Hardness ratio (energy fluence ratio) = 1.5687364299
S(15-50 keV) vs. S(50-150 keV) plot
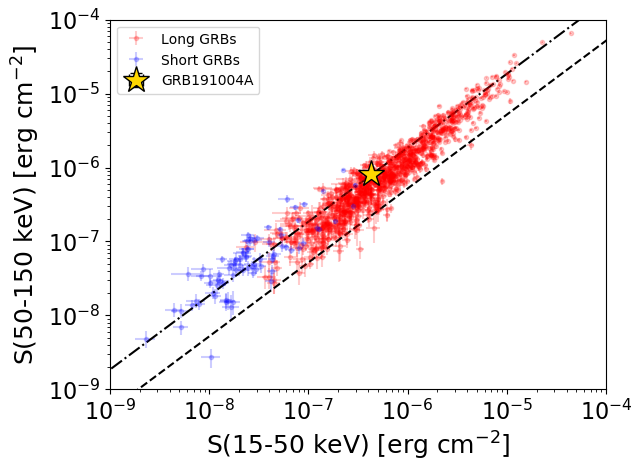
S(15-50 keV)  = 4.309392e-07
S(50-150 keV) = 8.271523e-07
The dash-dotted line and the dashed line traces the fluences calculated from the Band function with Epeak = 15 and 150 keV, respectively. Both lines assume a canonical values of alpha = -1 and beta = -2.5.
Mask shadow pattern
IMX = -3.385085496979163E-01, IMY = -6.423743622980559E-01
Spacecraft aspect plot
Bright source in the pre-burst/pre-slew/post-slew images
Pre-burst image of 15-350 keV band
Time interval of the image:
-239.556000 -0.092000

# RAcent  DECcent POSerr Theta    Phi  PeakCts   SNR AngSep     Name
#  [deg]    [deg]    ['] [deg]  [deg]                   [']
264.8752 -44.4782    5.7  54.1  -28.6  -1.9628  -2.0    5.9	4U 1735-44
 17.3306 -45.6105    2.9  26.4   98.3   1.2916   4.1 ------	UNKNOWN
 69.1284 -50.4019    2.7  31.7  172.3   1.1838   4.3 ------	UNKNOWN
Pre-slew background subtracted image of 15-350 keV band
Time interval of the image:
-0.092000 2.576000

# RAcent  DECcent POSerr Theta    Phi  PeakCts   SNR AngSep     Name
#  [deg]    [deg]    ['] [deg]  [deg]                   [']
264.8434 -44.3077    7.2  54.2  -28.5   0.1448   1.6    9.6	4U 1735-44
 35.7561 -32.2457    2.0  41.1  121.9   0.6299   5.9 ------	UNKNOWN
 16.2014 -36.8165    2.5  35.2   96.4   0.3311   4.6 ------	UNKNOWN
 31.7140 -36.9310    0.4  36.0  117.8   1.9040  27.4 ------	UNKNOWN
 79.2593 -73.6460    2.6  17.9 -138.9   0.1146   4.5 ------	UNKNOWN
132.1851 -51.8128    2.9  48.5 -131.7   0.3750   4.1 ------	UNKNOWN
Post-slew image of 15-350 keV band
Time interval of the image:
65.344590 709.880400
720.444000 899.578300
900.444000 962.535600

# RAcent  DECcent POSerr Theta    Phi  PeakCts   SNR AngSep     Name
#  [deg]    [deg]    ['] [deg]  [deg]                   [']
 65.8926  -7.2718    3.3  43.0  175.5   4.1685   3.5 ------	UNKNOWN
323.3813 -48.6514    2.8  49.7   -5.8   4.8478   4.1 ------	UNKNOWN
300.5980 -60.6031    3.6  58.9  -24.4  12.9336   3.3 ------	UNKNOWN
 54.6279 -72.1677    3.4  37.1  -70.8   4.8017   3.4 ------	UNKNOWN