Analysis Summary
Notes:
- 1) No attempt has been made to eliminate the non-significant decimal places.
- 2) This batgrbproduct analysis is done using the HEASARC data.
- 3) This batgrbproduct analysis is using the flight position for the mask-weighting calculation.
======================================================================
BAT GRB EVENT DATA PROCESSING REPORT
Process Script Ver: batgrbproduct v2.46
Process Start Time: Wed Nov 27 12:20:00 EST 2019
Host Name: bat1
Current Working Dir: /local/data/bat1/alien/Swift_3rdBATcatalog/event/batevent_reproc/trigger927839
======================================================================
Trigger: 00927839 Segment: 000
BAT Trigger Time: 591917645.376 [s; MET]
Trigger Stop: 591917645.888 [s; MET]
UTC: 2019-10-04T21:33:41.682300 [includes UTCF correction]
Where From?: TDRSS position message
BAT
RA: 49.1767831678255 Dec: -39.6131376723519 [deg; J2000]
Catalogged Source?: NO
Point Source?: YES
GRB Indicated?: YES [ by BAT flight software ]
Image S/N Ratio: 9.55
Image Trigger?: NO
Rate S/N Ratio: 18.5202591774521 [ if not an image trigger ]
Image S/N Ratio: 9.55
Analysis Position: [ source = BAT ]
RA: 49.1767831678255 Dec: -39.6131376723519 [deg; J2000]
Refined Position: [ source = BAT pre-slew burst ]
RA: 49.2009603120258 Dec: -39.6356908255829 [deg; J2000]
{ 03h 16m 48.2s , -39d 38' 08.5" }
+/- 0.649583727901305 [arcmin] (estimated 90% radius based on SNR)
+/- 0.161851599526638 [arcmin] (formal 1-sigma fit error)
SNR: 56.335541040885
Angular difference between the analysis and refined position is 1.754867 arcmin
Partial Coding Fraction: 0.9765625 [ including projection effects ]
Duration
T90: 300.127999901772 +/- 81.8288380767233
Measured from: 0.863999962806702
to: 300.991999864578 [s; relative to TRIGTIME]
T50: 31.9239999055862 +/- 27.7665458537064
Measured from: 3.77199995517731
to: 35.6959998607635 [s; relative to TRIGTIME]
Fluence
Peak Flux (peak 1 second)
Measured from: 2.74799990653992
to: 3.74799990653992 [s; relative to TRIGTIME]
Total Fluence
Measured from: -1.45200002193451
to: 382.783999919891 [s; relative to TRIGTIME]
Band 1 Band 2 Band 3 Band 4
15-25 25-50 50-100 100-350 keV
Total 1.077979 1.325790 1.525328 0.453425
0.112569 0.118395 0.109307 0.108803 [error]
Peak 0.133012 0.237937 0.224278 0.055685
0.008053 0.009916 0.009869 0.007217 [error]
[ fluence units of on-axis counts / fully illuminated detector ]
======================================================================
====== Table of the duration information =============================
Value tstart tstop
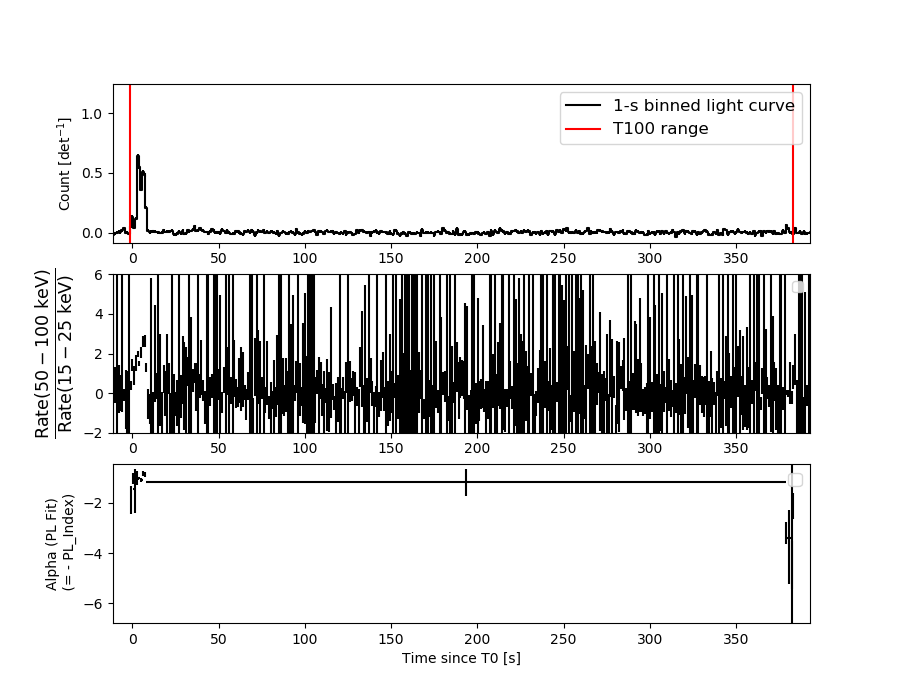
T100 384.236 -1.452 382.784
T90 300.128 0.864 300.992
T50 31.924 3.772 35.696
Peak 1.000 2.748 3.748
====== Spectral Analysis Summary =====================================
Model : spectral model: simple power-law (PL) and cutoff power-law (CPL)
Ph_index : photon index: E^{Ph_index}
Ph_90err : 90% error of the photon index
Epeak : Epeak in keV
Epeak_90err: 90% error of Epeak
Norm : normalization at 50 keV in both the PL model and CPL model
Nomr_90err : 90% error of the normalization
chi2 : Chi-Squared
dof : degree of freedo
=== Time-averaged spectral analysis ===
(Best model with acceptable fit: PL)
Model Ph_index Ph_90err_low Ph_90err_hi Epeak Epeak_90err_low Epeak_90err_hi Norm Nomr_90err_low Norm_90err_hi chi2 dof
PL -1.096 -0.147 0.149 - - - 7.49e-04 -5.92e-05 5.92e-05 54.850 57
CPL -1.007 -0.223 0.602 593.628 -593.628 -593.628 8.22e-04 -1.24e-04 6.95e-04 54.790 56
=== 1-s peak spectral analysis ===
(Best model with acceptable fit: PL)
Model Ph_index Ph_90err_low Ph_90err_hi Epeak Epeak_90err_low Epeak_90err_hi Norm Nomr_90err_low Norm_90err_hi chi2 dof
PL -1.128 -0.079 0.079 - - - 4.30e-02 -1.98e-03 1.98e-03 65.750 57
CPL -0.759 -0.303 0.325 184.453 -61.789 501.805 6.41e-02 -1.75e-02 2.59e-02 61.360 56
=== Fluence/Peak Flux Summary ===
Model Band1 Band2 Band3 Band4 Band5 Total
15-25 25-50 50-100 100-350 15-150 15-350 keV
Fluence PL 2.52e-07 5.93e-07 1.11e-06 5.01e-06 3.01e-06 6.97e-06 erg/cm2
90%_error_low -3.97e-08 -5.59e-08 -1.05e-07 -1.02e-06 -2.69e-07 -1.09e-06 erg/cm2
90%_error_hi 4.18e-08 5.51e-08 1.05e-07 1.21e-06 2.72e-07 1.26e-06 erg/cm2
Peak flux PL 1.24e+00 1.56e+00 1.43e+00 2.28e+00 5.00e+00 6.50e+00 ph/cm2/s
90%_error_low -1.07e-01 -8.33e-02 -7.68e-02 -2.50e-01 -2.33e-01 -3.29e-01 ph/cm2/s
90%_error_hi 1.10e-01 8.28e-02 7.64e-02 2.68e-01 2.33e-01 3.33e-01 ph/cm2/s
Fluence CPL 2.47e-07 5.97e-07 1.12e-06 4.41e-06 2.99e-06 6.42e-06 erg/cm2
90%_error_low -5.03e-08 -5.62e-08 -1.12e-07 -2.38e-06 -2.97e-07 -2.43e-06 erg/cm2
90%_error_hi 3.91e-08 6.13e-08 1.20e-07 9.96e-07 2.70e-07 2.31e-06 erg/cm2
Peak flux CPL 1.14e+00 1.60e+00 1.49e+00 1.55e+00 4.94e+00 5.78e+00 ph/cm2/s
90%_error_low -1.31e-01 -9.21e-02 -9.15e-02 -4.07e-01 -2.40e-01 -4.74e-01 ph/cm2/s
90%_error_hi 1.34e-01 9.32e-02 9.27e-02 5.85e-01 2.40e-01 6.14e-01 ph/cm2/s
======================================================================
Image
Pre-slew 15.0-350.0 keV image (Event data)
#   RAcent    DECcent   POSerr    Theta     Phi              Peak Cts       SNR   Name
   49.2010   -39.6357   0.0034    13.9659  -132.9613         3.2234756     56.336 TRIG_00927839

Foreground time interval of the image:
 -1.452  10.325 (delta_t =  11.777 [sec])
Background time interval of the image:
-239.376  -1.452 (delta_t = 237.924 [sec])
Light Curves
Note: The mask-weighted lightcurves have units of either count/det or counts/sec/det, where a det is 0.4 x 0.4 = 0.16 sq cm.
Full-time range; 1 s binning
Other quick-look light curves:
- 64 ms binning (zoomed)
- 16 ms binning (zoomed)
- 8 ms binning (zoomed)
- 2 ms binning (zoomed)
- SN=5 or 10 s binning (full-time range)
- Raw light curve
Spectra
- 64 ms binning (zoomed)
- 16 ms binning (zoomed)
- 8 ms binning (zoomed)
- 2 ms binning (zoomed)
- SN=5 or 10 s binning (full-time range)
- Raw light curve
Spectra
Notes:
- 1) The fitting includes the systematic errors.
- 2) When the burst includes telescope slew time periods, the fitting uses an average response file made from multiple 5-s response files through out the slew time plus single time preiod for the non-slew times, and weighted by the total counts in the corresponding time period using addrmf. An average response file is needed becuase a spectral fit using the pre-slew DRM will introduce some errors in both a spectral shape and a normalization if the PHA file contains a lot of the slew/post-slew time interval.
- 3) For fits to more complicated models (e.g. a power-law over a cutoff power-law), the BAT team has decided to require a chi-square improvement of more than 6 for each extra dof.
Time averaged spectrum fit using the average DRM
Power-law model
Time interval is from   -1.452 sec. to  382.784 sec.

Spectral model in power-law:
------------------------------------------------------------
Parameters  : value       lower 90%   higher 90%
Photon index: -1.09612     ( -0.146682   0.149121 )
Norm@50keV  : 7.48565E-04    ( -5.92348e-05   5.92026e-05 )
------------------------------------------------------------
#Fit statistic : Chi-Squared =          54.85 using 59 PHA bins.
# Reduced chi-squared =         0.9623 for     57 degrees of freedom
# Null hypothesis probability =   5.560554e-01

Photon flux (15-150 keV)    in 384.2 sec: 8.67960E-02 ( -0.0070327  0.0070489 ) ph/cm2/s
Energy fluence (15-150 keV)             : 3.01098e-06 ( -2.69039e-07  2.7162e-07 ) ergs/cm2
Cutoff power-law model

Time interval is from   -1.452 sec. to  382.784 sec.
Spectral model in the cutoff power-law:
------------------------------------------------------------
Parameters  : value       lower 90%   higher 90%
Photon index: -1.00705     ( -0.220753   0.603912 )
Epeak [keV] : 593.628      ( -631.241 -631.241 )
Norm@50keV  : 8.22387E-04    ( -0.00012219   0.000696673 )
------------------------------------------------------------
#Fit statistic : Chi-Squared =          54.79 using 59 PHA bins.
# Reduced chi-squared =         0.9784 for     56 degrees of freedom
# Null hypothesis probability =   5.207612e-01

Photon flux (15-150 keV)    in 384.2 sec: 8.63938E-02 ( -0.007326  0.0070625 ) ph/cm2/s
Energy fluence (15-150 keV)             : 2.99218e-06 ( -2.96689e-07  2.70075e-07 ) ergs/cm2
1-s peak spectrum fit
Power-law model
Time interval is from    2.748 sec. to    3.748 sec.

Spectral model in power-law:
------------------------------------------------------------
Parameters  : value       lower 90%   higher 90%
Photon index: -1.12788     ( -0.0791126   0.0792933 )
Norm@50keV  : 4.30155E-02    ( -0.00197577   0.00197574 )
------------------------------------------------------------
#Fit statistic : Chi-Squared =          65.75 using 59 PHA bins.
# Reduced chi-squared =          1.154 for     57 degrees of freedom
# Null hypothesis probability =   1.996210e-01

Photon flux (15-150 keV)    in 1 sec: 5.00385 ( -0.23305  0.23315 ) ph/cm2/s
Energy fluence (15-150 keV)             : 4.45872e-07 ( -2.33202e-08  2.34058e-08 ) ergs/cm2
Cutoff power-law model
Time interval is from    2.748 sec. to    3.748 sec.
Spectral model in the cutoff power-law:
------------------------------------------------------------
Parameters  : value       lower 90%   higher 90%
Photon index: -0.759442     ( -0.302999   0.324895 )
Epeak [keV] : 184.453      ( -61.7895 501.805 )
Norm@50keV  : 6.40535E-02    ( -0.0174725   0.0259287 )
------------------------------------------------------------
#Fit statistic : Chi-Squared =          61.36 using 59 PHA bins.
# Reduced chi-squared =          1.096 for     56 degrees of freedom
# Null hypothesis probability =   2.897370e-01

Photon flux (15-150 keV)    in 1 sec: 4.93567 ( -0.23962  0.23955 ) ph/cm2/s
Energy fluence (15-150 keV)             : 4.36767e-07 ( -2.48972e-08  2.48056e-08 ) ergs/cm2
Time-resolved spectra
Distribution
T90 vs. Hardness ratio plot
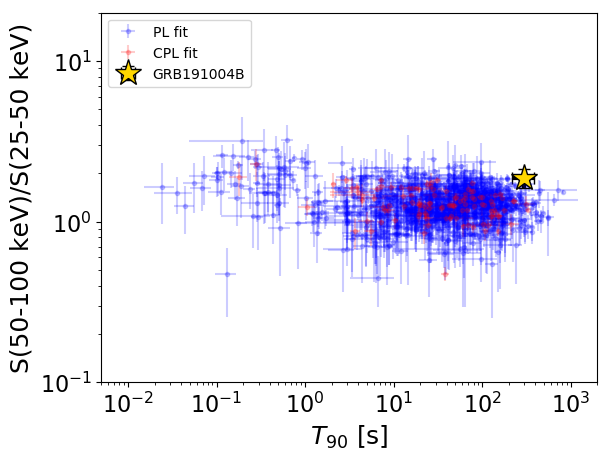
T90                                   = 300.128 sec.
Hardness ratio (energy fluence ratio) = 1.87115572801
S(15-50 keV) vs. S(50-150 keV) plot
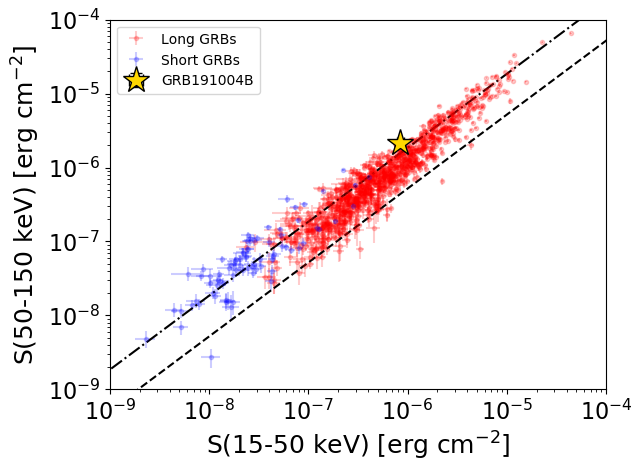
S(15-50 keV)  = 8.452115e-07
S(50-150 keV) = 2.165761e-06
The dash-dotted line and the dashed line traces the fluences calculated from the Band function with Epeak = 15 and 150 keV, respectively. Both lines assume a canonical values of alpha = -1 and beta = -2.5.
Mask shadow pattern
IMX = -1.694869942920265E-01, IMY = 1.819991427023131E-01
Spacecraft aspect plot
Bright source in the pre-burst/pre-slew/post-slew images
Pre-burst image of 15-350 keV band
Time interval of the image:
-239.376000 -1.452000

# RAcent  DECcent POSerr Theta    Phi  PeakCts   SNR AngSep     Name
#  [deg]    [deg]    ['] [deg]  [deg]                   [']
 29.7679 -49.4652    2.9  12.6  -53.6   0.9263   4.0 ------	UNKNOWN
 84.2085 -15.6290    2.5  50.9 -159.6   2.8938   4.6 ------	UNKNOWN
309.8750 -66.7087    3.2  53.3  -30.2   3.6801   3.6 ------	UNKNOWN
300.6892 -60.5405    2.9  58.9  -24.3   6.0582   3.9 ------	UNKNOWN
Pre-slew background subtracted image of 15-350 keV band
Time interval of the image:
-1.452000 10.324610

# RAcent  DECcent POSerr Theta    Phi  PeakCts   SNR AngSep     Name
#  [deg]    [deg]    ['] [deg]  [deg]                   [']
 49.2010 -39.6357    0.2  14.0 -133.0   3.2235  56.3 ------	UNKNOWN
Post-slew image of 15-350 keV band
Time interval of the image:
46.524600 373.624600

# RAcent  DECcent POSerr Theta    Phi  PeakCts   SNR AngSep     Name
#  [deg]    [deg]    ['] [deg]  [deg]                   [']
 96.3868  -4.8810    2.7  54.9 -158.1   5.0319   4.4 ------	UNKNOWN
292.5469 -76.1077    3.2  57.6  -26.8   7.1394   3.6 ------	UNKNOWN