Analysis Summary
Notes:
- 1) No attempt has been made to eliminate the non-significant decimal places.
- 2) This batgrbproduct analysis is done using the HEASARC data.
- 3) This batgrbproduct analysis is using the flight position for the mask-weighting calculation.
======================================================================
                  BAT GRB EVENT DATA PROCESSING REPORT
    Process Script Ver: batgrbproduct v2.46
    Process Start Time: Wed Nov 27 19:32:40 EST 2019
             Host Name: bat1
   Current Working Dir: /local/data/bat1/alien/Swift_3rdBATcatalog/event/batevent_reproc/trigger928924
======================================================================

  Trigger: 00928924      Segment: 000

  BAT Trigger Time: 592461380.16   [s; MET]
      Trigger Stop: 592461380.672   [s; MET]
               UTC: 2019-10-11T04:35:56.431400    [includes UTCF correction]
       Where From?: TDRSS position message

  BAT
    RA: 44.7235634192283   Dec: -27.8448241616054  [deg; J2000]

     Catalogged Source?: NO
     Point Source?:      YES
     GRB Indicated?:     YES    [ by BAT flight software ]
     Image S/N Ratio:    11.04
     Image Trigger?:     NO
     Rate S/N Ratio:     21.0713075057055  [ if not an image trigger ]
     Image S/N Ratio:    11.04

  Analysis Position:   [ source = BAT ]
    RA: 44.7235634192283   Dec: -27.8448241616054  [deg; J2000]

  Refined Position:   [ source = BAT pre-slew burst ]
    RA: 44.7290276947119   Dec: -27.8537297897374  [deg; J2000]
        { 02h 58m 55.0s , -27d 51' 13.4" }
         +/- 1.45183351438982 [arcmin] (estimated 90% radius based on SNR)
         +/- 0.834488799137556 [arcmin] (formal 1-sigma fit error)
    SNR: 17.8570058408695

  Angular difference between the analysis and refined position is 0.607906 arcmin

  Partial Coding Fraction: 0.9609375    [ including projection effects ]

  Duration
     T90: 7.35199999809265 +/- 0.937170199615569
        Measured from: 0.0160000324249268
                   to: 7.36800003051758     [s; relative to TRIGTIME]
     T50: 3.15599989891052 +/- 1.87386227552934
        Measured from: 0.532000064849854
                   to: 3.68799996376038     [s; relative to TRIGTIME]


  Fluence
     Peak Flux  (peak 1 second)
        Measured from: 0.120000004768372
                   to: 1.12000000476837     [s; relative to TRIGTIME]
     Total Fluence
        Measured from: -0.212000012397766
                   to: 7.96000003814697     [s; relative to TRIGTIME]

             Band 1     Band 2     Band 3     Band 4
              15-25      25-50     50-100    100-350     keV
 Total     0.238685   0.237612   0.138054   0.016010
           0.018287   0.018925   0.016310   0.013966 [error]
 Peak      0.073377   0.092778   0.061244   0.002417
           0.007164   0.007882   0.006458   0.005202 [error]

     [ fluence units of on-axis counts / fully illuminated detector ]

======================================================================


====== Table of the duration information =============================

        Value   tstart    tstop
T100    8.172   -0.212    7.960
T90     7.352    0.016    7.368
T50     3.156    0.532    3.688
Peak    1.000    0.120    1.120


====== Spectral Analysis Summary =====================================

Model      : spectral model: simple power-law (PL) and cutoff power-law (CPL)
Ph_index   : photon index: E^{Ph_index}
Ph_90err   : 90% error of the photon index
Epeak      : Epeak in keV
Epeak_90err: 90% error of Epeak
Norm       : normalization at 50 keV in both the PL model and CPL model
Nomr_90err : 90% error of the normalization
chi2       : Chi-Squared
dof        : degree of freedo

=== Time-averaged spectral analysis ===
(Best model with acceptable fit: PL)

Model Ph_index Ph_90err_low Ph_90err_hi  Epeak  Epeak_90err_low  Epeak_90err_hi  Norm       Nomr_90err_low    Norm_90err_hi    chi2    dof
PL      -1.932    -0.176      0.169       -           -               -         4.48e-03     -4.97e-04          4.86e-04      52.220   57
CPL     -1.890    -0.355      0.697      112.048      N/A           N/A         4.73e-03        N/A               N/A         52.210   56


=== 1-s peak spectral analysis ===
(Best model with acceptable fit: PL)

Model Ph_index Ph_90err_low Ph_90err_hi  Epeak  Epeak_90err_low  Epeak_90err_hi  Norm       Nomr_90err_low    Norm_90err_hi    chi2    dof
PL      -1.693     -0.166     0.162       -           -               -         1.43e-02     -1.52e-03          1.50e-03      62.850   57
CPL     -1.178     -0.585     0.720       73.406     -20.940       -73.406      2.73e-02     -1.38e-02          3.89e-02      60.900   56


=== Fluence/Peak Flux Summary ===

              Model    Band1     Band2     Band3     Band4     Band5     Total
                       15-25     25-50    50-100    100-350    15-150    15-350    keV
Fluence         PL   7.02e-08  9.92e-08  1.04e-07  2.01e-07  3.37e-07  4.74e-07   erg/cm2
      90%_error_low -9.04e-09 -8.69e-09 -1.58e-08 -5.57e-08 -3.58e-08 -7.34e-08   erg/cm2
      90%_error_hi   9.25e-09  8.70e-09  1.61e-08  6.86e-08  3.65e-08  8.36e-08   erg/cm2
Peak flux       PL   7.09e-01  6.36e-01  3.94e-01  3.70e-01  1.90e+00  2.11e+00   ph/cm2/s
      90%_error_low -1.02e-01 -6.13e-02 -5.37e-02 -9.03e-02 -1.81e-01 -2.04e-01   ph/cm2/s
      90%_error_hi   1.05e-01  6.10e-02  5.36e-02  1.06e-01  1.81e-01  2.05e-01   ph/cm2/s

Fluence        CPL   6.99e-08  9.97e-08  1.04e-07  1.85e-07  3.35e-07  4.58e-07   erg/cm2
      90%_error_low -9.99e-09 -9.16e-09 -1.65e-08 -1.29e-07 -4.30e-08 -1.39e-07   erg/cm2
      90%_error_hi   9.78e-09  1.17e-08  1.62e-08  2.69e-08  3.15e-08  9.78e-08   erg/cm2
Peak flux      CPL   6.64e-01  6.76e-01  4.04e-01  1.98e-01  1.87e+00  1.94e+00   ph/cm2/s
      90%_error_low -1.17e-01 -7.77e-02 -5.83e-02 -1.05e-01 -1.85e-01 -2.18e-01   ph/cm2/s
      90%_error_hi   1.18e-01  8.04e-02  5.91e-02  2.12e-01  1.84e-01  2.74e-01   ph/cm2/s

======================================================================
Image
Pre-slew 15.0-350.0 keV image (Event data)
#   RAcent    DECcent   POSerr    Theta     Phi              Peak Cts       SNR   Name
   44.7290   -27.8537   0.0107    18.8637   -27.5995         0.6393039     17.857 TRIG_00928924

Foreground time interval of the image:
 -0.212   7.960 (delta_t =   8.172 [sec])
Background time interval of the image:
-203.659  -0.212 (delta_t = 203.447 [sec])
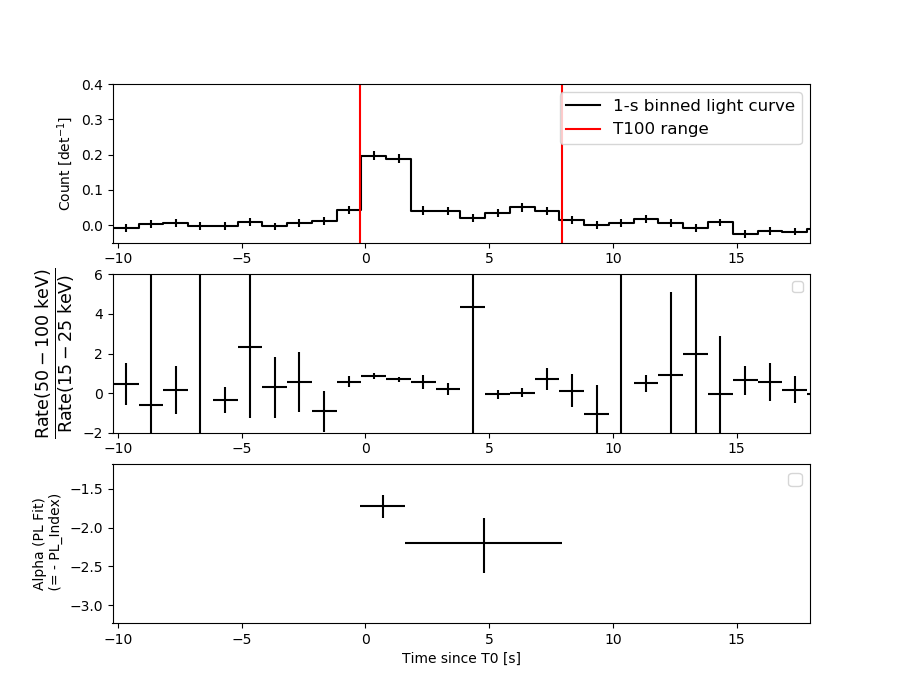
Light Curves
Note: The mask-weighted lightcurves have units of either count/det or counts/sec/det, where a det is 0.4 x 0.4 = 0.16 sq cm.
Full-time range; 1 s binning
Other quick-look light curves:
- 64 ms binning (zoomed)
- 16 ms binning (zoomed)
- 8 ms binning (zoomed)
- 2 ms binning (zoomed)
- SN=5 or 10 s binning (full-time range)
- Raw light curve
Spectra
- 64 ms binning (zoomed)
- 16 ms binning (zoomed)
- 8 ms binning (zoomed)
- 2 ms binning (zoomed)
- SN=5 or 10 s binning (full-time range)
- Raw light curve
Spectra
Notes:
- 1) The fitting includes the systematic errors.
- 2) When the burst includes telescope slew time periods, the fitting uses an average response file made from multiple 5-s response files through out the slew time plus single time preiod for the non-slew times, and weighted by the total counts in the corresponding time period using addrmf. An average response file is needed becuase a spectral fit using the pre-slew DRM will introduce some errors in both a spectral shape and a normalization if the PHA file contains a lot of the slew/post-slew time interval.
- 3) For fits to more complicated models (e.g. a power-law over a cutoff power-law), the BAT team has decided to require a chi-square improvement of more than 6 for each extra dof.
Time averaged spectrum fit using the average DRM
Power-law model
Time interval is from   -0.212 sec. to    7.960 sec.

Spectral model in power-law:
------------------------------------------------------------
Parameters  : value       lower 90%   higher 90%
Photon index: -1.93172     ( -0.176372   0.169183 )
Norm@50keV  : 4.47774E-03    ( -0.000497224   0.000486142 )
------------------------------------------------------------
#Fit statistic : Chi-Squared =          52.22 using 59 PHA bins.
# Reduced chi-squared =         0.9162 for     57 degrees of freedom
# Null hypothesis probability =   6.545041e-01

Photon flux (15-150 keV)    in 8.172 sec: 0.651472 ( -0.057223  0.057247 ) ph/cm2/s
Energy fluence (15-150 keV)             : 3.36634e-07 ( -3.57506e-08  3.64772e-08 ) ergs/cm2
Cutoff power-law model
Time interval is from   -0.212 sec. to    7.960 sec.
Spectral model in the cutoff power-law:
------------------------------------------------------------
Parameters  : value       lower 90%   higher 90%
Photon index: -1.88966     ( -0.354955   0.697873 )
Epeak [keV] : 112.048      (   )
Norm@50keV  : 4.73206E-03    (     )
------------------------------------------------------------
#Fit statistic : Chi-Squared =          52.21 using 59 PHA bins.
# Reduced chi-squared =         0.9323 for     56 degrees of freedom
# Null hypothesis probability =   6.190456e-01

Photon flux (15-150 keV)    in 8.172 sec: 0.650250 ( -0.060152  0.058299 ) ph/cm2/s
Energy fluence (15-150 keV)             : 3.35018e-07 ( -4.29744e-08  3.14937e-08 ) ergs/cm2
1-s peak spectrum fit
Power-law model
Time interval is from    0.120 sec. to    1.120 sec.

Spectral model in power-law:
------------------------------------------------------------
Parameters  : value       lower 90%   higher 90%
Photon index: -1.69298     ( -0.166368   0.161676 )
Norm@50keV  : 1.43039E-02    ( -0.00151961   0.00149826 )
------------------------------------------------------------
#Fit statistic : Chi-Squared =          62.85 using 59 PHA bins.
# Reduced chi-squared =          1.103 for     57 degrees of freedom
# Null hypothesis probability =   2.767257e-01

Photon flux (15-150 keV)    in 1 sec: 1.89516 ( -0.18078  0.18082 ) ph/cm2/s
Energy fluence (15-150 keV)             : 1.32532e-07 ( -1.47334e-08  1.49062e-08 ) ergs/cm2
Cutoff power-law model

Time interval is from    0.120 sec. to    1.120 sec.
Spectral model in the cutoff power-law:
------------------------------------------------------------
Parameters  : value       lower 90%   higher 90%
Photon index: -1.17756     ( -0.584931   0.720243 )
Epeak [keV] : 73.4055      ( -20.9404 -73.4056 )
Norm@50keV  : 2.73113E-02    ( -0.0137849   0.0389376 )
------------------------------------------------------------
#Fit statistic : Chi-Squared =          60.90 using 59 PHA bins.
# Reduced chi-squared =          1.087 for     56 degrees of freedom
# Null hypothesis probability =   3.042068e-01

Photon flux (15-150 keV)    in 1 sec: 1.86533 ( -0.18453  0.18445 ) ph/cm2/s
Energy fluence (15-150 keV)             : 1.0665e-07 ( -1.85918e-08  1.60883e-08 ) ergs/cm2
Time-resolved spectra
Distribution
T90 vs. Hardness ratio plot
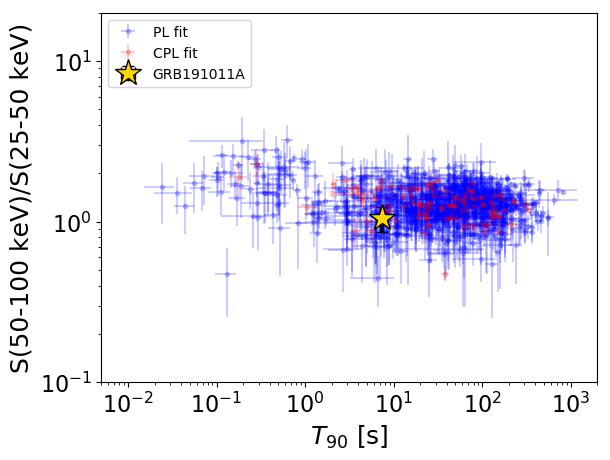
T90                                   = 7.352 sec.
Hardness ratio (energy fluence ratio) = 1.04850380313
S(15-50 keV) vs. S(50-150 keV) plot
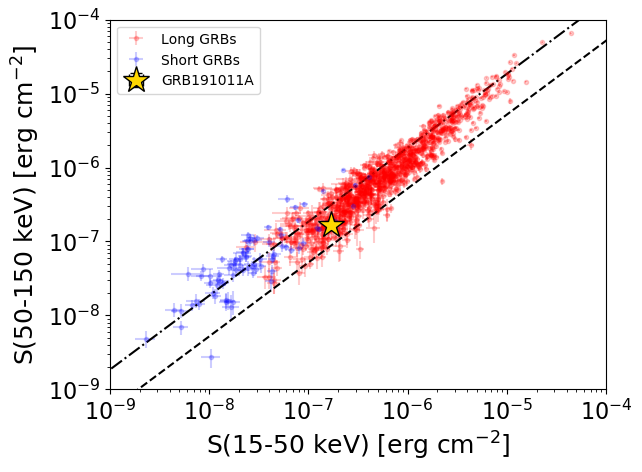
S(15-50 keV)  = 1.6941458e-07
S(50-150 keV) = 1.6722317e-07
The dash-dotted line and the dashed line traces the fluences calculated from the Band function with Epeak = 15 and 150 keV, respectively. Both lines assume a canonical values of alpha = -1 and beta = -2.5.
Mask shadow pattern
IMX = 3.027890845709666E-01, IMY = 1.582910580861097E-01
Spacecraft aspect plot
Bright source in the pre-burst/pre-slew/post-slew images
Pre-burst image of 15-350 keV band
Time interval of the image:
-203.659400 -0.212000

# RAcent  DECcent POSerr Theta    Phi  PeakCts   SNR AngSep     Name
#  [deg]    [deg]    ['] [deg]  [deg]                   [']
 83.6164  22.0146    0.9  49.3 -156.6   7.7771  13.4    0.9	Crab
 35.3849  22.8033    2.3  33.0  137.4   1.7616   5.0 ------	UNKNOWN
 65.7714  -8.3864    2.6  21.0 -117.0   0.9717   4.5 ------	UNKNOWN
Pre-slew background subtracted image of 15-350 keV band
Time interval of the image:
-0.212000 7.960000

# RAcent  DECcent POSerr Theta    Phi  PeakCts   SNR AngSep     Name
#  [deg]    [deg]    ['] [deg]  [deg]                   [']
 83.6560  21.9694    4.5  49.3 -156.5   0.2324   2.6    3.0	Crab
 20.7966 -27.7034    2.3  29.2   19.9   0.2037   4.9 ------	UNKNOWN
  5.2322 -45.1226    2.0  49.4    9.0   0.4406   5.7 ------	UNKNOWN
 44.7290 -27.8537    0.6  18.9  -27.6   0.6393  17.9 ------	UNKNOWN
 79.4742  33.5864    2.4  54.0 -170.9   0.5503   4.8 ------	UNKNOWN
Post-slew image of 15-350 keV band
Time interval of the image:
57.940600 962.980000
1768.840000 1960.883200

# RAcent  DECcent POSerr Theta    Phi  PeakCts   SNR AngSep     Name
#  [deg]    [deg]    ['] [deg]  [deg]                   [']
  0.4303 -35.0976    4.1  38.1   20.5   3.1484   2.8 ------	UNKNOWN
359.9508 -55.7962    3.0  42.3  -11.2   4.3763   3.9 ------	UNKNOWN
 42.9879 -44.6398    2.8  16.9  -43.0   2.8874   4.1 ------	UNKNOWN
 53.2115 -63.8061    2.9  36.4  -53.5   4.9162   4.0 ------	UNKNOWN
 90.2210 -18.7718    3.1  42.5 -139.3   5.6754   3.7 ------	UNKNOWN