Analysis Summary
Notes:
- 1) No attempt has been made to eliminate the non-significant decimal places.
- 2) This batgrbproduct analysis is done using the HEASARC data.
- 3) This batgrbproduct analysis is using the flight position for the mask-weighting calculation.
======================================================================
                  BAT GRB EVENT DATA PROCESSING REPORT
    Process Script Ver: batgrbproduct v2.46
    Process Start Time: Wed Nov 27 12:09:35 EST 2019
             Host Name: bat1
   Current Working Dir: /local/data/bat1/alien/Swift_3rdBATcatalog/event/batevent_reproc/trigger930285
======================================================================

  Trigger: 00930285      Segment: 000

  BAT Trigger Time: 593190777.408   [s; MET]
      Trigger Stop: 593190777.664   [s; MET]
               UTC: 2019-10-19T15:12:33.632500    [includes UTCF correction]
       Where From?: TDRSS position message

  BAT
    RA: 340.038362226781   Dec: -17.3332351323859  [deg; J2000]

     Catalogged Source?: NO
     Point Source?:      YES
     GRB Indicated?:     YES    [ by BAT flight software ]
     Image S/N Ratio:    10.94
     Image Trigger?:     NO
     Rate S/N Ratio:     24.1867732448956  [ if not an image trigger ]
     Image S/N Ratio:    10.94

  Analysis Position:   [ source = BAT ]
    RA: 340.038362226781   Dec: -17.3332351323859  [deg; J2000]

  Refined Position:   [ source = BAT pre-slew burst ]
    RA: 340.034688608033   Dec: -17.3399630861776  [deg; J2000]
        { 22h 40m 08.3s , -17d 20' 23.9" }
         +/- 0.638786550908101 [arcmin] (estimated 90% radius based on SNR)
         +/- 0.199005274414667 [arcmin] (formal 1-sigma fit error)
    SNR: 57.7007654464149

  Angular difference between the analysis and refined position is 0.455220 arcmin

  Partial Coding Fraction: 0.4648438    [ including projection effects ]

  Duration
     T90: 64.3479999303818 +/- 4.44964942613322
        Measured from: 1.3400000333786
                   to: 65.6879999637604     [s; relative to TRIGTIME]
     T50: 30.4759999513626 +/- 1.03064250738057
        Measured from: 10.2080000638962
                   to: 40.6840000152588     [s; relative to TRIGTIME]


  Fluence
     Peak Flux  (peak 1 second)
        Measured from: -0.136000037193298
                   to: 0.863999962806702     [s; relative to TRIGTIME]
     Total Fluence
        Measured from: -0.827999949455261
                   to: 84.3200000524521     [s; relative to TRIGTIME]

             Band 1     Band 2     Band 3     Band 4
              15-25      25-50     50-100    100-350     keV
 Total     7.156225   7.306946   3.424957   0.741654
           0.111709   0.115083   0.098068   0.088420 [error]
 Peak      0.184185   0.248313   0.163079   0.004535
           0.014428   0.015552   0.013351   0.010273 [error]

     [ fluence units of on-axis counts / fully illuminated detector ]

======================================================================


====== Table of the duration information =============================

        Value   tstart    tstop
T100   85.148   -0.828   84.320
T90    64.348    1.340   65.688
T50    30.476   10.208   40.684
Peak    1.000   -0.136    0.864


====== Spectral Analysis Summary =====================================

Model      : spectral model: simple power-law (PL) and cutoff power-law (CPL)
Ph_index   : photon index: E^{Ph_index}
Ph_90err   : 90% error of the photon index
Epeak      : Epeak in keV
Epeak_90err: 90% error of Epeak
Norm       : normalization at 50 keV in both the PL model and CPL model
Nomr_90err : 90% error of the normalization
chi2       : Chi-Squared
dof        : degree of freedo

=== Time-averaged spectral analysis ===
(Best model with acceptable fit: PL)

Model Ph_index Ph_90err_low Ph_90err_hi  Epeak  Epeak_90err_low  Epeak_90err_hi  Norm       Nomr_90err_low    Norm_90err_hi    chi2    dof
PL      -2.255    -0.053      0.053       -           -               -         1.29e-02     -3.50e-04          3.49e-04      58.030   57
CPL     -1.986     1.986      0.186        2.547      -1.569        -1.046      1.76e-02     -9.79e-04          8.70e-04      54.550   56


=== 1-s peak spectral analysis ===
(Best model with acceptable fit: CPL)

Model Ph_index Ph_90err_low Ph_90err_hi  Epeak  Epeak_90err_low  Epeak_90err_hi  Norm       Nomr_90err_low    Norm_90err_hi    chi2    dof
PL      -1.876     -0.127     0.123       -           -               -         4.01e-02     -3.27e-03          3.24e-03      48.570   57
CPL     -0.805     -0.560     0.637       53.522      -7.375        11.843      1.45e-01     -7.02e-02          1.65e-01      36.800   56


=== Fluence/Peak Flux Summary ===

              Model    Band1     Band2     Band3     Band4     Band5     Total
                       15-25     25-50    50-100    100-350    15-150    15-350    keV
Fluence         PL   2.87e-06  3.34e-06  2.80e-06  3.96e-06  1.04e-05  1.30e-05   erg/cm2
      90%_error_low -1.32e-07 -8.69e-08 -1.06e-07 -3.18e-07 -2.59e-07 -4.04e-07   erg/cm2
      90%_error_hi   1.35e-07  8.68e-08  1.06e-07  3.37e-07  2.60e-07  4.13e-07   erg/cm2
Peak flux       PL   2.37e+00  1.91e+00  1.04e+00  8.31e-01  5.70e+00  6.16e+00   ph/cm2/s
      90%_error_low -2.64e-01 -1.43e-01 -1.08e-01 -1.57e-01 -4.29e-01 -4.51e-01   ph/cm2/s
      90%_error_hi   2.73e-01  1.42e-01  1.08e-01  1.75e-01  4.30e-01  4.51e-01   ph/cm2/s

Fluence        CPL    N/A      N/A      N/A      N/A      N/A      N/A      erg/cm2
      90%_error_low -1.32e-07 -8.69e-08 -1.06e-07 -3.18e-07 -2.59e-07 -4.04e-07   erg/cm2
      90%_error_hi   1.35e-07  8.68e-08  1.06e-07  3.37e-07  2.60e-07  4.13e-07   erg/cm2
Peak flux      CPL   1.99e+00  2.12e+00  1.12e+00  3.12e-01  5.47e+00  5.54e+00   ph/cm2/s
      90%_error_low -3.18e-01 -1.80e-01 -1.27e-01 -1.29e-01 -4.44e-01 -4.70e-01   ph/cm2/s
      90%_error_hi   3.26e-01  1.84e-01  1.28e-01  2.01e-01  4.45e-01  4.83e-01   ph/cm2/s

======================================================================
Image
Pre-slew 15.0-350.0 keV image (Event data)

#   RAcent    DECcent   POSerr    Theta     Phi              Peak Cts       SNR   Name
  340.0347   -17.3400   0.0033    44.4987  -170.5020        18.9034484     57.701 TRIG_00930285

Foreground time interval of the image:
 -0.828  84.320 (delta_t =  85.148 [sec])
Background time interval of the image:
-239.408  -0.828 (delta_t = 238.580 [sec])
Light Curves
Note: The mask-weighted lightcurves have units of either count/det or counts/sec/det, where a det is 0.4 x 0.4 = 0.16 sq cm.
Full-time range; 1 s binning
Other quick-look light curves:
- 64 ms binning (zoomed)
- 16 ms binning (zoomed)
- 8 ms binning (zoomed)
- 2 ms binning (zoomed)
- SN=5 or 10 s binning (full-time range)
- Raw light curve
Spectra
- 64 ms binning (zoomed)
- 16 ms binning (zoomed)
- 8 ms binning (zoomed)
- 2 ms binning (zoomed)
- SN=5 or 10 s binning (full-time range)
- Raw light curve
Spectra
Notes:
- 1) The fitting includes the systematic errors.
- 2) When the burst includes telescope slew time periods, the fitting uses an average response file made from multiple 5-s response files through out the slew time plus single time preiod for the non-slew times, and weighted by the total counts in the corresponding time period using addrmf. An average response file is needed becuase a spectral fit using the pre-slew DRM will introduce some errors in both a spectral shape and a normalization if the PHA file contains a lot of the slew/post-slew time interval.
- 3) For fits to more complicated models (e.g. a power-law over a cutoff power-law), the BAT team has decided to require a chi-square improvement of more than 6 for each extra dof.
Time averaged spectrum fit using the average DRM
Power-law model

Time interval is from   -0.828 sec. to   84.320 sec.

Spectral model in power-law:
------------------------------------------------------------
Parameters  : value       lower 90%   higher 90%
Photon index: -2.25484     ( -0.0529935   0.0525186 )
Norm@50keV  : 1.29244E-02    ( -0.000350335   0.000349037 )
------------------------------------------------------------
#Fit statistic : Chi-Squared =          58.03 using 59 PHA bins.
# Reduced chi-squared =          1.018 for     57 degrees of freedom
# Null hypothesis probability =   4.370189e-01

Photon flux (15-150 keV)    in 85.15 sec: 2.20354 ( -0.06683  0.06733 ) ph/cm2/s
Energy fluence (15-150 keV)             : 1.04362e-05 ( -2.59359e-07  2.59594e-07 ) ergs/cm2
Cutoff power-law model

Time interval is from   -0.828 sec. to   84.320 sec.
Spectral model in the cutoff power-law:
------------------------------------------------------------
Parameters  : value       lower 90%   higher 90%
Photon index: -1.9936     ( 1.9936   0.194221 )
Epeak [keV] : 1.18857      ( -0.210851 0.311669 )
Norm@50keV  : 1.74665E-02    ( -0.000827872   0.0010213 )
------------------------------------------------------------
#Fit statistic : Chi-Squared =          54.51 using 59 PHA bins.
# Reduced chi-squared =         0.9735 for     56 degrees of freedom
# Null hypothesis probability =   5.312836e-01

Photon flux (15-150 keV)    in 85.15 sec: 2.14664 ( -0.0559  0.056 ) ph/cm2/s
Energy fluence (15-150 keV)             : 0 ( 0  0 ) ergs/cm2
1-s peak spectrum fit
Power-law model
Time interval is from   -0.136 sec. to    0.864 sec.

Spectral model in power-law:
------------------------------------------------------------
Parameters  : value       lower 90%   higher 90%
Photon index: -1.87572     ( -0.127486   0.123328 )
Norm@50keV  : 4.01073E-02    ( -0.00326792   0.00323552 )
------------------------------------------------------------
#Fit statistic : Chi-Squared =          48.57 using 59 PHA bins.
# Reduced chi-squared =         0.8522 for     57 degrees of freedom
# Null hypothesis probability =   7.789149e-01

Photon flux (15-150 keV)    in 1 sec: 5.69774 ( -0.42911  0.42973 ) ph/cm2/s
Energy fluence (15-150 keV)             : 3.68765e-07 ( -2.9796e-08  3.00027e-08 ) ergs/cm2
Cutoff power-law model

Time interval is from   -0.136 sec. to    0.864 sec.
Spectral model in the cutoff power-law:
------------------------------------------------------------
Parameters  : value       lower 90%   higher 90%
Photon index: -0.804774     ( -0.559719   0.636655 )
Epeak [keV] : 53.5219      ( -7.37517 11.8432 )
Norm@50keV  : 0.145358    ( -0.070172   0.165065 )
------------------------------------------------------------
#Fit statistic : Chi-Squared =          36.80 using 59 PHA bins.
# Reduced chi-squared =         0.6571 for     56 degrees of freedom
# Null hypothesis probability =   9.778870e-01

Photon flux (15-150 keV)    in 1 sec: 5.46529 ( -0.44355  0.44479 ) ph/cm2/s
Energy fluence (15-150 keV)             : 3.48739e-07 ( -3.13148e-08  3.17131e-08 ) ergs/cm2
Time-resolved spectra

Distribution
T90 vs. Hardness ratio plot

T90                                   = 64.348 sec.
Hardness ratio (energy fluence ratio) = 0.838127527817
S(15-50 keV) vs. S(50-150 keV) plot
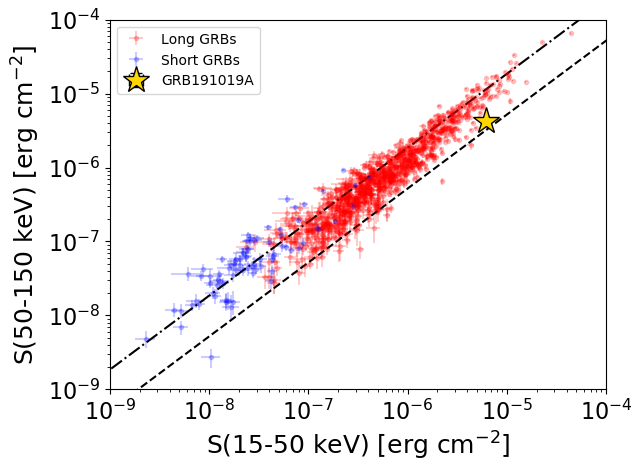
S(15-50 keV)  = 6.212081e-06
S(50-150 keV) = 4.224304e-06
The dash-dotted line and the dashed line traces the fluences calculated from the Band function with Epeak = 15 and 150 keV, respectively. Both lines assume a canonical values of alpha = -1 and beta = -2.5.
Mask shadow pattern

IMX = -9.691802042739096E-01, IMY = 1.621506513189872E-01
Spacecraft aspect plot

Bright source in the pre-burst/pre-slew/post-slew images
Pre-burst image of 15-350 keV band
Time interval of the image:
-239.408000 -0.828000

# RAcent  DECcent POSerr Theta    Phi  PeakCts   SNR AngSep     Name
#  [deg]    [deg]    ['] [deg]  [deg]                   [']
326.1419  38.2096    5.2  35.7  -75.5   1.2400   2.2    6.9	Cyg X-2
 50.9229  51.5467    3.3  48.0   16.5   1.8967   3.5 ------	UNKNOWN
318.5164 -13.1252    3.0  55.3 -146.5   5.2279   3.8 ------	UNKNOWN
Pre-slew background subtracted image of 15-350 keV band
Time interval of the image:
-0.828000 84.320000

# RAcent  DECcent POSerr Theta    Phi  PeakCts   SNR AngSep     Name
#  [deg]    [deg]    ['] [deg]  [deg]                   [']
326.1662  38.4455   24.2  35.7  -75.1  -0.2439  -0.5    7.4	Cyg X-2
 47.4717  38.4081    2.4  42.0   33.4   1.7784   4.8 ------	UNKNOWN
 62.0873  56.5575    3.3  55.7   12.9   3.2077   3.5 ------	UNKNOWN
340.0347 -17.3400    0.2  44.5 -170.5  18.9020  57.7 ------	UNKNOWN
 11.5020  63.7623    2.4  43.0  -16.5   1.4363   4.8 ------	UNKNOWN
339.0416  29.0276    2.4  22.8  -87.3   1.2534   4.8 ------	UNKNOWN
351.8325  76.5406    3.4  55.6  -25.2   2.3383   3.4 ------	UNKNOWN
318.4745  12.7231    3.4  43.0 -116.2   2.7329   3.4 ------	UNKNOWN
Post-slew image of 15-350 keV band
Time interval of the image:
537.092590 962.646400

# RAcent  DECcent POSerr Theta    Phi  PeakCts   SNR AngSep     Name
#  [deg]    [deg]    ['] [deg]  [deg]                   [']
108.7823  50.0293    3.5  40.8   98.0   4.7513   3.3 ------	UNKNOWN
123.1532  59.7090    3.5  35.9  116.9   2.6872   3.4 ------	UNKNOWN
147.0895  61.2472    2.4  29.4  135.3   2.7342   4.8 ------	UNKNOWN
157.2680  38.2457    2.4   5.6  126.9   1.8750   4.8 ------	UNKNOWN