Analysis Summary
Notes:
- 1) No attempt has been made to eliminate the non-significant decimal places.
- 2) This batgrbproduct analysis is done using the HEASARC data.
- 3) This batgrbproduct analysis is using the flight position for the mask-weighting calculation.
======================================================================
BAT GRB EVENT DATA PROCESSING REPORT
Process Script Ver: batgrbproduct v2.46
Process Start Time: Wed Nov 27 12:07:52 EST 2019
Host Name: bat1
Current Working Dir: /local/data/bat1/alien/Swift_3rdBATcatalog/event/batevent_reproc/trigger931242
======================================================================
Trigger: 00931242 Segment: 000
BAT Trigger Time: 593584996.416 [s; MET]
Trigger Stop: 593584996.928 [s; MET]
UTC: 2019-10-24T04:42:52.615160 [includes UTCF correction]
Where From?: TDRSS position message
BAT
RA: 10.1472153743508 Dec: -67.1394119919046 [deg; J2000]
Catalogged Source?: NO
Point Source?: YES
GRB Indicated?: YES [ by BAT flight software ]
Image S/N Ratio: 8.68
Image Trigger?: NO
Rate S/N Ratio: 16.1864140562386 [ if not an image trigger ]
Image S/N Ratio: 8.68
Analysis Position: [ source = BAT ]
RA: 10.1472153743508 Dec: -67.1394119919046 [deg; J2000]
Refined Position: [ source = BAT pre-slew burst ]
RA: 10.1288771567599 Dec: -67.1380774306605 [deg; J2000]
{ 00h 40m 30.9s , -67d 08' 17.1" }
+/- 1.30748728829961 [arcmin] (estimated 90% radius based on SNR)
+/- 0.526008859915265 [arcmin] (formal 1-sigma fit error)
SNR: 20.7385854114519
Angular difference between the analysis and refined position is 0.434900 arcmin
Partial Coding Fraction: 0.90625 [ including projection effects ]
Duration
T90: 7.08399987220764 +/- 0.978243413242523
Measured from: -0.583999991416931
to: 6.49999988079071 [s; relative to TRIGTIME]
T50: 3.31199991703033 +/- 0.539332884380847
Measured from: 0.312000036239624
to: 3.62399995326996 [s; relative to TRIGTIME]
Fluence
Peak Flux (peak 1 second)
Measured from: -0.307999968528748
to: 0.692000031471252 [s; relative to TRIGTIME]
Total Fluence
Measured from: -0.955999970436096
to: 7.44799995422363 [s; relative to TRIGTIME]
Band 1 Band 2 Band 3 Band 4
15-25 25-50 50-100 100-350 keV
Total 0.269218 0.327025 0.173110 0.066431
0.020437 0.021231 0.018392 0.015606 [error]
Peak 0.065024 0.076365 0.044218 0.016928
0.007316 0.007806 0.006959 0.005564 [error]
[ fluence units of on-axis counts / fully illuminated detector ]
======================================================================
====== Table of the duration information =============================
Value tstart tstop
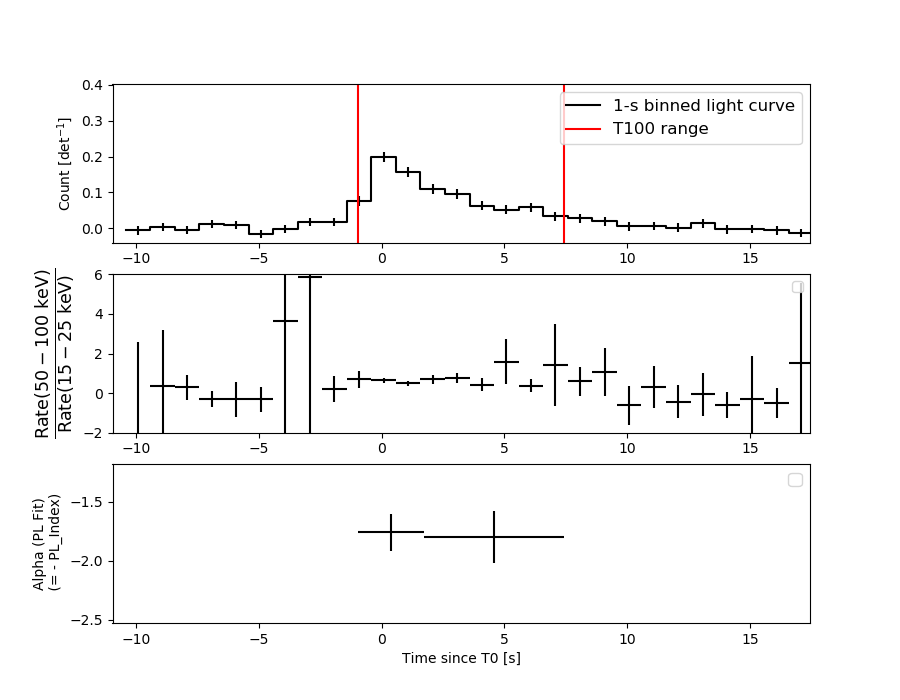
T100 8.404 -0.956 7.448
T90 7.084 -0.584 6.500
T50 3.312 0.312 3.624
Peak 1.000 -0.308 0.692
====== Spectral Analysis Summary =====================================
Model : spectral model: simple power-law (PL) and cutoff power-law (CPL)
Ph_index : photon index: E^{Ph_index}
Ph_90err : 90% error of the photon index
Epeak : Epeak in keV
Epeak_90err: 90% error of Epeak
Norm : normalization at 50 keV in both the PL model and CPL model
Nomr_90err : 90% error of the normalization
chi2 : Chi-Squared
dof : degree of freedo
=== Time-averaged spectral analysis ===
(Best model with acceptable fit: N/A)
Model Ph_index Ph_90err_low Ph_90err_hi Epeak Epeak_90err_low Epeak_90err_hi Norm Nomr_90err_low Norm_90err_hi chi2 dof
PL -1.783 -0.139 0.136 - - - 6.05e-03 -5.23e-04 5.16e-04 72.930 57
CPL -1.431 -0.486 0.659 70.837 -22.164 -70.837 9.52e-03 -3.87e-03 1.27e-02 71.820 56
=== 1-s peak spectral analysis ===
(Best model with acceptable fit: PL)
Model Ph_index Ph_90err_low Ph_90err_hi Epeak Epeak_90err_low Epeak_90err_hi Norm Nomr_90err_low Norm_90err_hi chi2 dof
PL -1.782 -0.209 0.201 - - - 1.18e-02 -1.61e-03 1.58e-03 62.470 57
CPL -1.371 -0.797 1.162 63.828 -24.205 -63.828 2.05e-02 -6.55e-03 7.96e-02 61.900 56
=== Fluence/Peak Flux Summary ===
Model Band1 Band2 Band3 Band4 Band5 Total
15-25 25-50 50-100 100-350 15-150 15-350 keV
Fluence PL 8.47e-08 1.31e-07 1.52e-07 3.41e-07 4.68e-07 7.09e-07 erg/cm2
90%_error_low -9.75e-09 -9.93e-09 -1.78e-08 -7.47e-08 -4.13e-08 -9.33e-08 erg/cm2
90%_error_hi 9.99e-09 9.93e-09 1.79e-08 8.80e-08 4.18e-08 1.04e-07 erg/cm2
Peak flux PL 6.36e-01 5.42e-01 3.15e-01 2.74e-01 1.61e+00 1.77e+00 ph/cm2/s
90%_error_low -1.06e-01 -6.22e-02 -5.58e-02 -8.35e-02 -1.85e-01 -2.08e-01 ph/cm2/s
90%_error_hi 1.09e-01 6.22e-02 5.61e-02 1.03e-01 1.85e-01 2.09e-01 ph/cm2/s
Fluence CPL 8.17e-08 1.37e-07 1.52e-07 1.82e-07 4.51e-07 5.52e-07 erg/cm2
90%_error_low -1.10e-08 -1.34e-08 -1.95e-08 -1.11e-07 -5.01e-08 -1.23e-07 erg/cm2
90%_error_hi 1.10e-08 1.39e-08 1.89e-08 1.84e-07 5.01e-08 1.97e-07 erg/cm2
Peak flux CPL 6.15e-01 5.71e-01 3.14e-01 1.49e-01 1.59e+00 1.65e+00 ph/cm2/s
90%_error_low -1.18e-01 -8.13e-02 -6.63e-02 -1.49e-01 -1.93e-01 -2.33e-01 ph/cm2/s
90%_error_hi 1.18e-01 9.50e-02 6.02e-02 1.52e-01 1.91e-01 2.73e-01 ph/cm2/s
======================================================================
Image
Pre-slew 15.0-350.0 keV image (Event data)
#   RAcent    DECcent   POSerr    Theta     Phi              Peak Cts       SNR   Name
   10.1289   -67.1381   0.0092    25.5929  -171.7499         0.8181860     20.739 TRIG_00931242

Foreground time interval of the image:
 -0.956   7.448 (delta_t =   8.404 [sec])
Background time interval of the image:
-239.416  -0.956 (delta_t = 238.460 [sec])
Light Curves
Note: The mask-weighted lightcurves have units of either count/det or counts/sec/det, where a det is 0.4 x 0.4 = 0.16 sq cm.
Full-time range; 1 s binning
Other quick-look light curves:
- 64 ms binning (zoomed)
- 16 ms binning (zoomed)
- 8 ms binning (zoomed)
- 2 ms binning (zoomed)
- SN=5 or 10 s binning (full-time range)
- Raw light curve
Spectra
- 64 ms binning (zoomed)
- 16 ms binning (zoomed)
- 8 ms binning (zoomed)
- 2 ms binning (zoomed)
- SN=5 or 10 s binning (full-time range)
- Raw light curve
Spectra
Notes:
- 1) The fitting includes the systematic errors.
- 2) When the burst includes telescope slew time periods, the fitting uses an average response file made from multiple 5-s response files through out the slew time plus single time preiod for the non-slew times, and weighted by the total counts in the corresponding time period using addrmf. An average response file is needed becuase a spectral fit using the pre-slew DRM will introduce some errors in both a spectral shape and a normalization if the PHA file contains a lot of the slew/post-slew time interval.
- 3) For fits to more complicated models (e.g. a power-law over a cutoff power-law), the BAT team has decided to require a chi-square improvement of more than 6 for each extra dof.
Time averaged spectrum fit using the average DRM
Power-law model
Time interval is from   -0.956 sec. to    7.448 sec.

Spectral model in power-law:
------------------------------------------------------------
Parameters  : value       lower 90%   higher 90%
Photon index: -1.78303     ( -0.13936   0.136265 )
Norm@50keV  : 6.04657E-03    ( -0.000523054   0.000516326 )
------------------------------------------------------------
#Fit statistic : Chi-Squared =          72.93 using 59 PHA bins.
# Reduced chi-squared =          1.280 for     57 degrees of freedom
# Null hypothesis probability =   7.586639e-02

Photon flux (15-150 keV)    in 8.404 sec: 0.827828 ( -0.063323  0.06336 ) ph/cm2/s
Energy fluence (15-150 keV)             : 4.68194e-07 ( -4.12945e-08  4.18125e-08 ) ergs/cm2
Cutoff power-law model
Time interval is from   -0.956 sec. to    7.448 sec.
Spectral model in the cutoff power-law:
------------------------------------------------------------
Parameters  : value       lower 90%   higher 90%
Photon index: -1.43096     ( -0.485585   0.658973 )
Epeak [keV] : 70.8366      ( -22.1638 -70.8365 )
Norm@50keV  : 9.52351E-03    ( -0.00387189   0.0126831 )
------------------------------------------------------------
#Fit statistic : Chi-Squared =          71.82 using 59 PHA bins.
# Reduced chi-squared =          1.282 for     56 degrees of freedom
# Null hypothesis probability =   7.564142e-02

Photon flux (15-150 keV)    in 8.404 sec: 0.815628 ( -0.066549  0.066296 ) ph/cm2/s
Energy fluence (15-150 keV)             : 4.50554e-07 ( -5.01057e-08  5.011e-08 ) ergs/cm2
1-s peak spectrum fit
Power-law model
Time interval is from   -0.308 sec. to    0.692 sec.

Spectral model in power-law:
------------------------------------------------------------
Parameters  : value       lower 90%   higher 90%
Photon index: -1.78161     ( -0.209344   0.200549 )
Norm@50keV  : 1.17766E-02    ( -0.00161265   0.0015778 )
------------------------------------------------------------
#Fit statistic : Chi-Squared =          62.47 using 59 PHA bins.
# Reduced chi-squared =          1.096 for     57 degrees of freedom
# Null hypothesis probability =   2.880302e-01

Photon flux (15-150 keV)    in 1 sec: 1.61145 ( -0.18495  0.18497 ) ph/cm2/s
Energy fluence (15-150 keV)             : 1.08513e-07 ( -1.50478e-08  1.53495e-08 ) ergs/cm2
Cutoff power-law model
Time interval is from   -0.308 sec. to    0.692 sec.
Spectral model in the cutoff power-law:
------------------------------------------------------------
Parameters  : value       lower 90%   higher 90%
Photon index: -1.3706     ( -0.796918   1.1621 )
Epeak [keV] : 63.8284      ( -24.1816 -63.8054 )
Norm@50keV  : 2.04775E-02    ( -0.00655744   0.0796079 )
------------------------------------------------------------
#Fit statistic : Chi-Squared =          61.90 using 59 PHA bins.
# Reduced chi-squared =          1.105 for     56 degrees of freedom
# Null hypothesis probability =   2.736855e-01

Photon flux (15-150 keV)    in 1 sec: 1.58961 ( -0.19281  0.1914 ) ph/cm2/s
Energy fluence (15-150 keV)             : 0 ( 0  0 ) ergs/cm2
Time-resolved spectra
Distribution
T90 vs. Hardness ratio plot
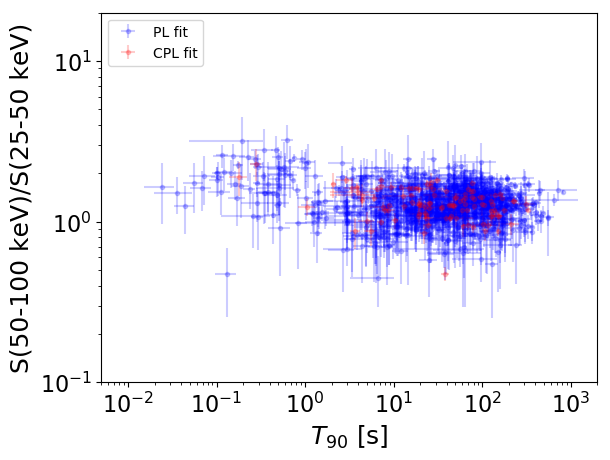
T90                                   = N/A sec.
Hardness ratio (energy fluence ratio) = N/A
S(15-50 keV) vs. S(50-150 keV) plot
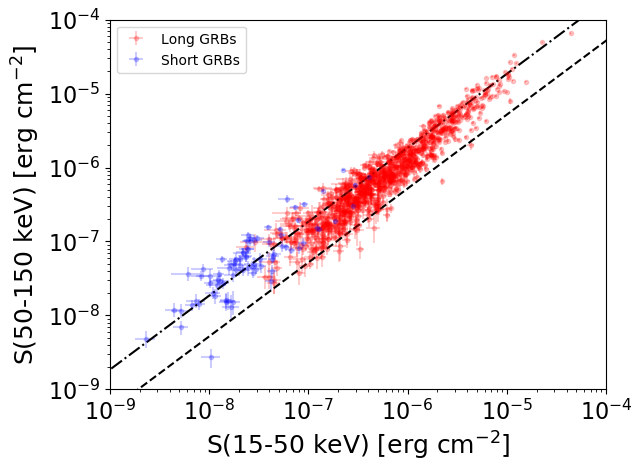
S(15-50 keV)  = N/A
S(50-150 keV) = N/A
The dash-dotted line and the dashed line traces the fluences calculated from the Band function with Epeak = 15 and 150 keV, respectively. Both lines assume a canonical values of alpha = -1 and beta = -2.5.
Mask shadow pattern
IMX = -4.740104481419378E-01, IMY = 6.872941176620725E-02
Spacecraft aspect plot
Bright source in the pre-burst/pre-slew/post-slew images
Pre-burst image of 15-350 keV band
Time interval of the image:
-239.416000 -0.956000

# RAcent  DECcent POSerr Theta    Phi  PeakCts   SNR AngSep     Name
#  [deg]    [deg]    ['] [deg]  [deg]                   [']
275.7849 -30.2963    9.9  47.9  -50.6   1.3562   1.2    8.4	H1820-303
284.8904 -25.1013    0.0  45.4  -37.8  -0.4890  -0.9   13.4	HT1900.1-2455
330.6795  -0.3090    3.6  48.5   33.7   2.6093   3.2 ------	UNKNOWN
319.6301   4.2292    2.7  54.6   20.6   5.5817   4.3 ------	UNKNOWN
 72.5216 -52.9027    2.8  56.8  173.9   5.4708   4.1 ------	UNKNOWN
Pre-slew background subtracted image of 15-350 keV band
Time interval of the image:
-0.956000 7.448000

# RAcent  DECcent POSerr Theta    Phi  PeakCts   SNR AngSep     Name
#  [deg]    [deg]    ['] [deg]  [deg]                   [']
275.7525 -30.5197    4.0  47.7  -50.8   0.4709   2.9   12.8	H1820-303
285.1707 -24.9634    3.0  45.3  -37.4  -0.3201  -3.8    7.8	HT1900.1-2455
 10.1290 -67.1381    0.6  25.6 -171.7   0.8180  20.7 ------	UNKNOWN
Post-slew image of 15-350 keV band
Time interval of the image:
813.284600 962.645100

# RAcent  DECcent POSerr Theta    Phi  PeakCts   SNR AngSep     Name
#  [deg]    [deg]    ['] [deg]  [deg]                   [']