Analysis Summary
Notes:
- 1) No attempt has been made to eliminate the non-significant decimal places.
- 2) This batgrbproduct analysis is done using the HEASARC data.
- 3) This batgrbproduct analysis is using the flight position for the mask-weighting calculation.
======================================================================
                  BAT GRB EVENT DATA PROCESSING REPORT
    Process Script Ver: batgrbproduct v2.46
    Process Start Time: Wed Nov 27 12:04:02 EST 2019
             Host Name: bat1
   Current Working Dir: /local/data/bat1/alien/Swift_3rdBATcatalog/event/batevent_reproc/trigger932435
======================================================================

  Trigger: 00932435      Segment: 000

  BAT Trigger Time: 594175017.536   [s; MET]
      Trigger Stop: 594175019.584   [s; MET]
               UTC: 2019-10-31T00:36:33.697220    [includes UTCF correction]
       Where From?: TDRSS position message

  BAT
    RA: 233.470112879956   Dec: 6.14378241270486  [deg; J2000]

     Catalogged Source?: NO
     Point Source?:      YES
     GRB Indicated?:     YES    [ by BAT flight software ]
     Image S/N Ratio:    7.26
     Image Trigger?:     NO
     Rate S/N Ratio:     12.4899959967968  [ if not an image trigger ]
     Image S/N Ratio:    7.26

  Analysis Position:   [ source = BAT ]
    RA: 233.470112879956   Dec: 6.14378241270486  [deg; J2000]

  Refined Position:   [ source = BAT pre-slew burst ]
    RA: 233.496301690784   Dec: 6.10555421287116  [deg; J2000]
        { 15h 33m 59.1s , +06d 06' 20.0" }
         +/- 1.65918404790887 [arcmin] (estimated 90% radius based on SNR)
         +/- 0.770912269432629 [arcmin] (formal 1-sigma fit error)
    SNR: 14.7564975195284

  Angular difference between the analysis and refined position is 2.775246 arcmin

  Partial Coding Fraction: 0.4648438    [ including projection effects ]

  Duration
     T90: 12.1319999694824 +/- 2.34751269965428
        Measured from: -4.24800002574921
                   to: 7.88399994373322     [s; relative to TRIGTIME]
     T50: 5.91999995708466 +/- 1.82003621467988
        Measured from: -0.404000043869019
                   to: 5.51599991321564     [s; relative to TRIGTIME]


  Fluence
     Peak Flux  (peak 1 second)
        Measured from: 3.42799997329712
                   to: 4.42799997329712     [s; relative to TRIGTIME]
     Total Fluence
        Measured from: -6.26400005817413
                   to: 8.59599995613098     [s; relative to TRIGTIME]

             Band 1     Band 2     Band 3     Band 4
              15-25      25-50     50-100    100-350     keV
 Total     0.202048   0.455695   0.357759   0.105837
           0.037167   0.039081   0.035329   0.029842 [error]
 Peak      0.017471   0.043784   0.057224   0.018466
           0.009590   0.010290   0.009278   0.008055 [error]

     [ fluence units of on-axis counts / fully illuminated detector ]

======================================================================


====== Table of the duration information =============================

        Value   tstart    tstop
T100   14.860   -6.264    8.596
T90    12.132   -4.248    7.884
T50     5.920   -0.404    5.516
Peak    1.000    3.428    4.428


====== Spectral Analysis Summary =====================================

Model      : spectral model: simple power-law (PL) and cutoff power-law (CPL)
Ph_index   : photon index: E^{Ph_index}
Ph_90err   : 90% error of the photon index
Epeak      : Epeak in keV
Epeak_90err: 90% error of Epeak
Norm       : normalization at 50 keV in both the PL model and CPL model
Nomr_90err : 90% error of the normalization
chi2       : Chi-Squared
dof        : degree of freedo

=== Time-averaged spectral analysis ===
(Best model with acceptable fit: PL)

Model Ph_index Ph_90err_low Ph_90err_hi  Epeak  Epeak_90err_low  Epeak_90err_hi  Norm       Nomr_90err_low    Norm_90err_hi    chi2    dof
PL      -1.190    -0.165      0.168       -           -               -         5.19e-03     -5.09e-04          5.09e-04      55.250   57
CPL     -0.622    -0.616      0.726      129.203     -45.923      -129.203      9.72e-03     -4.67e-03          1.12e-02      52.790   56


=== 1-s peak spectral analysis ===
(Best model with acceptable fit: PL)

Model Ph_index Ph_90err_low Ph_90err_hi  Epeak  Epeak_90err_low  Epeak_90err_hi  Norm       Nomr_90err_low    Norm_90err_hi    chi2    dof
PL      -0.917     -0.352     0.383       -           -               -         8.76e-03     -2.01e-03          1.98e-03      60.350   57
CPL      1.021     -1.802     3.070       92.969     -24.920       323.886      5.58e-02     -5.58e-02          7.30e-01      56.900   56


=== Fluence/Peak Flux Summary ===

              Model    Band1     Band2     Band3     Band4     Band5     Total
                       15-25     25-50    50-100    100-350    15-150    15-350    keV
Fluence         PL   7.37e-08  1.64e-07  2.87e-07  1.18e-06  7.84e-07  1.70e-06   erg/cm2
      90%_error_low -1.32e-08 -1.85e-08 -3.33e-08 -2.73e-07 -8.45e-08 -2.98e-07   erg/cm2
      90%_error_hi   1.39e-08  1.83e-08  3.30e-08  3.26e-07  8.51e-08  3.43e-07   erg/cm2
Peak flux       PL   2.07e-01  2.95e-01  3.13e-01  6.13e-01  1.01e+00  1.43e+00   ph/cm2/s
      90%_error_low -8.65e-02 -8.55e-02 -7.05e-02 -2.44e-01 -2.29e-01 -3.27e-01   ph/cm2/s
      90%_error_hi   1.03e-01  8.47e-02  7.00e-02  3.36e-01  2.31e-01  3.47e-01   ph/cm2/s

Fluence        CPL   6.58e-08  1.73e-07  3.02e-07  5.50e-07  7.56e-07  1.09e-06   erg/cm2
      90%_error_low -1.56e-08 -2.13e-08 -3.76e-08 -2.91e-07 -9.15e-08 -3.01e-07   erg/cm2
      90%_error_hi   1.62e-08  2.19e-08  3.85e-08  7.11e-07  9.11e-08  5.60e-07   erg/cm2
Peak flux      CPL   1.14e-01  3.05e-01  3.80e-01  1.81e-01  9.29e-01  9.78e-01   ph/cm2/s
      90%_error_low -8.54e-02 -1.11e-01 -9.43e-02 -1.81e-01 -2.36e-01 -2.72e-01   ph/cm2/s
      90%_error_hi   1.27e-01  1.05e-01  9.89e-02  3.76e-01  2.42e-01  4.17e-01   ph/cm2/s

======================================================================
Image
Pre-slew 15.0-350.0 keV image (Event data)
#   RAcent    DECcent   POSerr    Theta     Phi              Peak Cts       SNR   Name
  233.4963     6.1056   0.0131    26.3960   -99.9042         1.1363840     14.756 TRIG_00932435

Foreground time interval of the image:
 -6.264   8.596 (delta_t =  14.860 [sec])
Background time interval of the image:
-239.536  -6.264 (delta_t = 233.272 [sec])
Light Curves
Note: The mask-weighted lightcurves have units of either count/det or counts/sec/det, where a det is 0.4 x 0.4 = 0.16 sq cm.
Full-time range; 1 s binning
Other quick-look light curves:
- 64 ms binning (zoomed)
- 16 ms binning (zoomed)
- 8 ms binning (zoomed)
- 2 ms binning (zoomed)
- SN=5 or 10 s binning (full-time range)
- Raw light curve
Spectra
- 64 ms binning (zoomed)
- 16 ms binning (zoomed)
- 8 ms binning (zoomed)
- 2 ms binning (zoomed)
- SN=5 or 10 s binning (full-time range)
- Raw light curve
Spectra
Notes:
- 1) The fitting includes the systematic errors.
- 2) When the burst includes telescope slew time periods, the fitting uses an average response file made from multiple 5-s response files through out the slew time plus single time preiod for the non-slew times, and weighted by the total counts in the corresponding time period using addrmf. An average response file is needed becuase a spectral fit using the pre-slew DRM will introduce some errors in both a spectral shape and a normalization if the PHA file contains a lot of the slew/post-slew time interval.
- 3) For fits to more complicated models (e.g. a power-law over a cutoff power-law), the BAT team has decided to require a chi-square improvement of more than 6 for each extra dof.
Time averaged spectrum fit using the average DRM
Power-law model
Time interval is from   -6.264 sec. to    8.596 sec.

Spectral model in power-law:
------------------------------------------------------------
Parameters  : value       lower 90%   higher 90%
Photon index: -1.19018     ( -0.165057   0.168119 )
Norm@50keV  : 5.18815E-03    ( -0.00050948   0.000509456 )
------------------------------------------------------------
#Fit statistic : Chi-Squared =          55.25 using 59 PHA bins.
# Reduced chi-squared =         0.9693 for     57 degrees of freedom
# Null hypothesis probability =   5.409581e-01

Photon flux (15-150 keV)    in 14.86 sec: 0.608158 ( -0.061497  0.061619 ) ph/cm2/s
Energy fluence (15-150 keV)             : 7.84439e-07 ( -8.45179e-08  8.51e-08 ) ergs/cm2
Cutoff power-law model
Time interval is from   -6.264 sec. to    8.596 sec.
Spectral model in the cutoff power-law:
------------------------------------------------------------
Parameters  : value       lower 90%   higher 90%
Photon index: -0.621716     ( -0.616363   0.725539 )
Epeak [keV] : 129.203      ( -45.9238 -129.204 )
Norm@50keV  : 9.71774E-03    ( -0.00466617   0.0112431 )
------------------------------------------------------------
#Fit statistic : Chi-Squared =          52.79 using 59 PHA bins.
# Reduced chi-squared =         0.9427 for     56 degrees of freedom
# Null hypothesis probability =   5.970163e-01

Photon flux (15-150 keV)    in 14.86 sec: 0.594823 ( -0.063271  0.063317 ) ph/cm2/s
Energy fluence (15-150 keV)             : 7.56482e-07 ( -9.15174e-08  9.11133e-08 ) ergs/cm2
1-s peak spectrum fit
Power-law model
Time interval is from    3.428 sec. to    4.428 sec.

Spectral model in power-law:
------------------------------------------------------------
Parameters  : value       lower 90%   higher 90%
Photon index: -0.916966     ( -0.35264   0.382405 )
Norm@50keV  : 8.76187E-03    ( -0.00200981   0.00197996 )
------------------------------------------------------------
#Fit statistic : Chi-Squared =          60.35 using 59 PHA bins.
# Reduced chi-squared =          1.059 for     57 degrees of freedom
# Null hypothesis probability =   3.557857e-01

Photon flux (15-150 keV)    in 1 sec: 1.00584 ( -0.228813  0.23133 ) ph/cm2/s
Energy fluence (15-150 keV)             : 9.77035e-08 ( -2.2156e-08  2.23127e-08 ) ergs/cm2
Cutoff power-law model

Time interval is from    3.428 sec. to    4.428 sec.
Spectral model in the cutoff power-law:
------------------------------------------------------------
Parameters  : value       lower 90%   higher 90%
Photon index: 1.02129     ( -1.80683   3.06491 )
Epeak [keV] : 92.9687      ( -25.0582 323.748 )
Norm@50keV  : 5.57887E-02    ( -0.0564623   0.729201 )
------------------------------------------------------------
#Fit statistic : Chi-Squared =          56.90 using 59 PHA bins.
# Reduced chi-squared =          1.016 for     56 degrees of freedom
# Null hypothesis probability =   4.414218e-01

Photon flux (15-150 keV)    in 1 sec: 0.929085 ( -0.235516  0.241975 ) ph/cm2/s
Energy fluence (15-150 keV)             : 9.04191e-08 ( -2.33133e-08  2.38082e-08 ) ergs/cm2
Time-resolved spectra
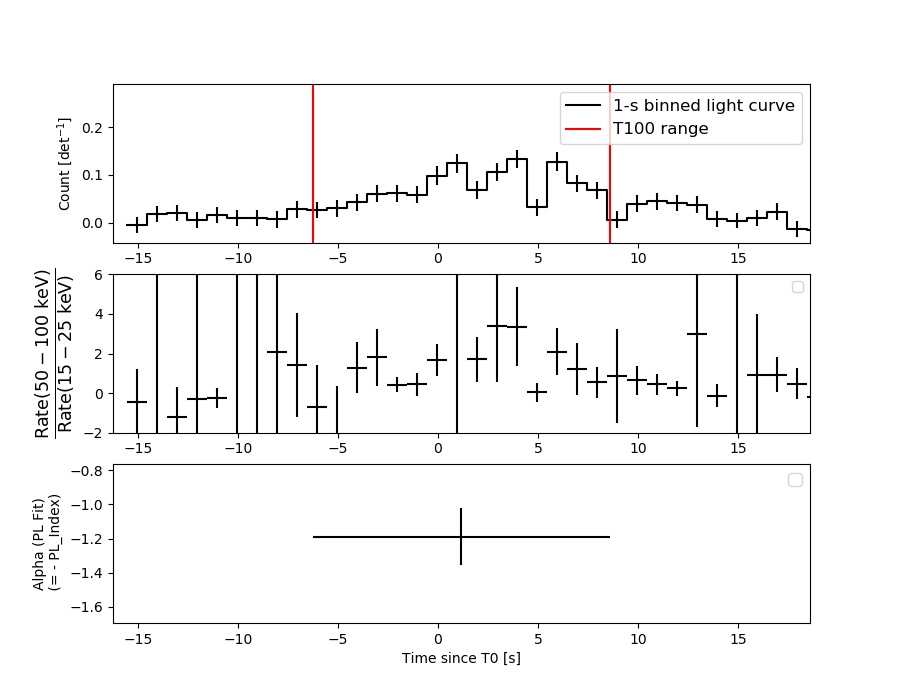
Distribution
T90 vs. Hardness ratio plot
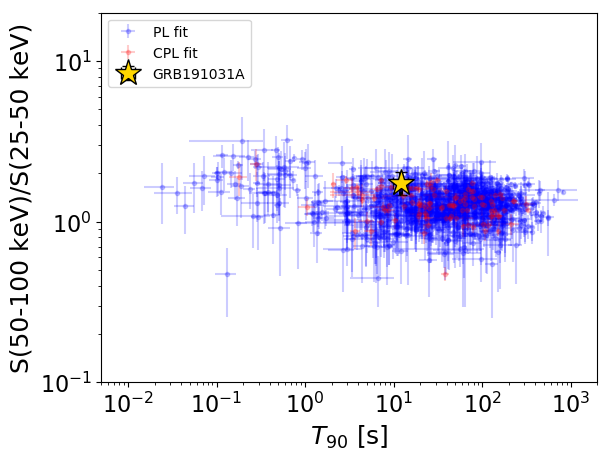
T90                                   = 12.132 sec.
Hardness ratio (energy fluence ratio) = 1.75303291995
S(15-50 keV) vs. S(50-150 keV) plot
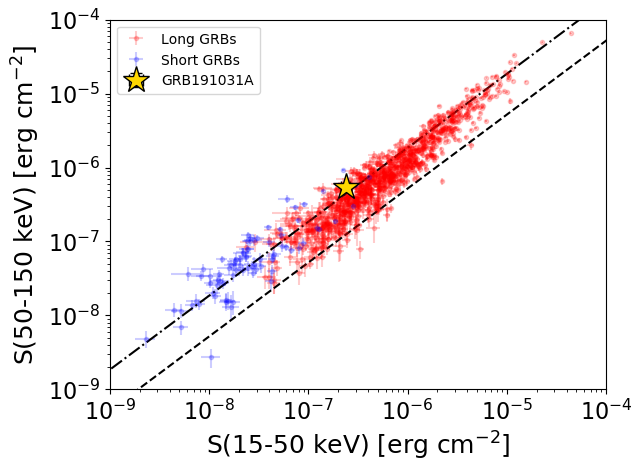
S(15-50 keV)  = 2.3749283e-07
S(50-150 keV) = 5.469486e-07
The dash-dotted line and the dashed line traces the fluences calculated from the Band function with Epeak = 15 and 150 keV, respectively. Both lines assume a canonical values of alpha = -1 and beta = -2.5.
Mask shadow pattern
IMX = -8.536744119345392E-02, IMY = 4.889200576382809E-01
Spacecraft aspect plot
Bright source in the pre-burst/pre-slew/post-slew images
Pre-burst image of 15-350 keV band
Time interval of the image:
-239.536000 -6.264000

# RAcent  DECcent POSerr Theta    Phi  PeakCts   SNR AngSep     Name
#  [deg]    [deg]    ['] [deg]  [deg]                   [']
254.4913  35.3435   29.1  15.4  147.9  -0.1020  -0.4    1.6	Her X-1
268.3243  -1.5174    8.0  45.5 -154.1  -0.7650  -1.4    4.7	SW J1753.5-0127
288.7156  10.8944    8.0  52.7  175.7  -1.2770  -1.4    5.8	GRS 1915+105
212.2209  -3.5565    2.5  42.5  -69.1   4.6242   4.6 ------	UNKNOWN
Pre-slew background subtracted image of 15-350 keV band
Time interval of the image:
-6.264000 8.596000

# RAcent  DECcent POSerr Theta    Phi  PeakCts   SNR AngSep     Name
#  [deg]    [deg]    ['] [deg]  [deg]                   [']
254.3720  35.5425    0.0  15.4  147.2  -0.0760  -1.5   12.7	Her X-1
268.4522  -1.4611    5.1  45.5 -154.3  -0.2391  -2.2    5.1	SW J1753.5-0127
288.7976  11.0656   17.8  52.7  175.4   0.1092   0.6    7.2	GRS 1915+105
286.4814  21.0364    2.1  45.9  165.3   0.6000   5.5 ------	UNKNOWN
233.4963   6.1056    0.8  26.4  -99.9   1.1365  14.8 ------	UNKNOWN
Post-slew image of 15-350 keV band
Time interval of the image:
142.564610 962.492800

# RAcent  DECcent POSerr Theta    Phi  PeakCts   SNR AngSep     Name
#  [deg]    [deg]    ['] [deg]  [deg]                   [']
254.3647  35.2362   14.5  43.7 -126.7  -2.0277  -0.8    7.8	Her X-1
299.6018  35.2077    0.9  45.0  180.0  22.0673  12.6    0.7	Cyg X-1
307.9613  41.0097   15.9  40.4  169.0   1.1131   0.7    7.6	Cyg X-3
326.2431  38.1717    0.0  46.1  149.7   2.9860   1.0    9.6	Cyg X-2
 99.8926  56.8572    3.1  44.5   27.0   5.3641   3.8 ------	UNKNOWN
331.5849  56.6484    3.4  29.4  135.2   4.1028   3.4 ------	UNKNOWN
306.8194  24.1274    2.8  56.9  174.0  15.6601   4.1 ------	UNKNOWN
164.3735  43.2117    3.9  50.8  -30.1   8.0300   2.9 ------	UNKNOWN
173.6942  41.5074    3.4  50.7  -39.3  14.1292   3.4 ------	UNKNOWN