Analysis Summary
Notes:
- 1) No attempt has been made to eliminate the non-significant decimal places.
- 2) This batgrbproduct analysis is done using the HEASARC data.
- 3) This batgrbproduct analysis is using the flight position for the mask-weighting calculation.
======================================================================
                  BAT GRB EVENT DATA PROCESSING REPORT
    Process Script Ver: batgrbproduct v2.46
    Process Start Time: Wed Nov 27 12:02:11 EST 2019
             Host Name: bat1
   Current Working Dir: /local/data/bat1/alien/Swift_3rdBATcatalog/event/batevent_reproc/trigger932595
======================================================================

  Trigger: 00932595      Segment: 000

  BAT Trigger Time: 594240258.752   [s; MET]
      Trigger Stop: 594240259.776   [s; MET]
               UTC: 2019-10-31T18:43:54.909020    [includes UTCF correction]
       Where From?: TDRSS position message

  BAT
    RA: 115.862015968424   Dec: -62.3348266050567  [deg; J2000]

     Catalogged Source?: NO
     Point Source?:      YES
     GRB Indicated?:     YES    [ by BAT flight software ]
     Image S/N Ratio:    7.29
     Image Trigger?:     NO
     Rate S/N Ratio:     11.2249721603218  [ if not an image trigger ]
     Image S/N Ratio:    7.29

  Analysis Position:   [ source = BAT ]
    RA: 115.862015968424   Dec: -62.3348266050567  [deg; J2000]

  Refined Position:   [ source = BAT pre-slew burst ]
    RA: 115.873570555795   Dec: -62.3232479076717  [deg; J2000]
        { 07h 43m 29.7s , -62d 19' 23.7" }
         +/- 1.05836651800829 [arcmin] (estimated 90% radius based on SNR)
         +/- 0.465987402303545 [arcmin] (formal 1-sigma fit error)
    SNR: 28.0494249757042

  Angular difference between the analysis and refined position is 0.765697 arcmin

  Partial Coding Fraction: 0.2402344    [ including projection effects ]

  Duration
     T90: 78.5 +/- 7.50918900334979
        Measured from: -33.2400000095367
                   to: 45.2599999904633     [s; relative to TRIGTIME]
     T50: 18.2639999389648 +/- 2.56112476767675
        Measured from: -5.38800001144409
                   to: 12.8759999275208     [s; relative to TRIGTIME]


  Fluence
     Peak Flux  (peak 1 second)
        Measured from: 4.03600001335144
                   to: 5.03600001335144     [s; relative to TRIGTIME]
     Total Fluence
        Measured from: -37.9839999675751
                   to: 66.4919999837875     [s; relative to TRIGTIME]

             Band 1     Band 2     Band 3     Band 4
              15-25      25-50     50-100    100-350     keV
 Total     2.687609   3.945848   3.014753   0.797906
           0.124366   0.133528   0.117220   0.094399 [error]
 Peak      0.097063   0.207745   0.190132   0.051709
           0.017174   0.021019   0.019102   0.012849 [error]

     [ fluence units of on-axis counts / fully illuminated detector ]

======================================================================


====== Table of the duration information =============================

        Value   tstart    tstop
T100  104.476  -37.984   66.492
T90    78.500  -33.240   45.260
T50    18.264   -5.388   12.876
Peak    1.000    4.036    5.036


====== Spectral Analysis Summary =====================================

Model      : spectral model: simple power-law (PL) and cutoff power-law (CPL)
Ph_index   : photon index: E^{Ph_index}
Ph_90err   : 90% error of the photon index
Epeak      : Epeak in keV
Epeak_90err: 90% error of Epeak
Norm       : normalization at 50 keV in both the PL model and CPL model
Nomr_90err : 90% error of the normalization
chi2       : Chi-Squared
dof        : degree of freedo

=== Time-averaged spectral analysis ===
(Best model with acceptable fit: PL)

Model Ph_index Ph_90err_low Ph_90err_hi  Epeak  Epeak_90err_low  Epeak_90err_hi  Norm       Nomr_90err_low    Norm_90err_hi    chi2    dof
PL      -1.566    -0.070      0.070       -           -               -         7.08e-03     -2.78e-04          2.78e-04      51.660   57
CPL     -1.324    -0.264      0.284      146.524     -52.249      -146.524      9.28e-03     -2.28e-03          3.34e-03      49.260   56


=== 1-s peak spectral analysis ===
(Best model with acceptable fit: PL)

Model Ph_index Ph_90err_low Ph_90err_hi  Epeak  Epeak_90err_low  Epeak_90err_hi  Norm       Nomr_90err_low    Norm_90err_hi    chi2    dof
PL      -1.327     -0.160     0.161       -           -               -         3.83e-02     -4.09e-03          4.09e-03      51.590   57
CPL     -0.578     -0.636     0.760      105.254     -29.681       238.001      8.69e-02     -4.28e-02          1.08e-01      47.440   56


=== Fluence/Peak Flux Summary ===

              Model    Band1     Band2     Band3     Band4     Band5     Total
                       15-25     25-50    50-100    100-350    15-150    15-350    keV
Fluence         PL   1.01e-06  1.77e-06  2.40e-06  6.67e-06  6.95e-06  1.18e-05   erg/cm2
      90%_error_low -7.16e-08 -7.64e-08 -1.18e-07 -6.93e-07 -2.88e-07 -7.77e-07   erg/cm2
      90%_error_hi   7.33e-08  7.60e-08  1.18e-07  7.45e-07  2.88e-07  8.16e-07   erg/cm2
Peak flux       PL   1.34e+00  1.49e+00  1.19e+00  1.57e+00  4.59e+00  5.58e+00   ph/cm2/s
      90%_error_low -2.45e-01 -1.83e-01 -1.41e-01 -3.37e-01 -5.14e-01 -6.02e-01   ph/cm2/s
      90%_error_hi   2.57e-01  1.81e-01  1.40e-01  3.80e-01  5.15e-01  6.03e-01   ph/cm2/s

Fluence        CPL   9.58e-07  1.81e-06  2.45e-06  4.75e-06  6.85e-06  9.96e-06   erg/cm2
      90%_error_low -8.74e-08 -8.68e-08 -1.30e-07 -1.42e-06 -3.12e-07 -1.44e-06   erg/cm2
      90%_error_hi   8.89e-08  8.79e-08  1.31e-07  9.31e-07  3.11e-07  2.13e-06   erg/cm2
Peak flux      CPL   1.14e+00  1.60e+00  1.32e+00  8.44e-01  4.55e+00  4.91e+00   ph/cm2/s
      90%_error_low -2.86e-01 -2.13e-01 -1.82e-01 -3.62e-01 -5.16e-01 -6.32e-01   ph/cm2/s
      90%_error_hi   3.00e-01  2.21e-01  1.86e-01  6.08e-01  5.17e-01  7.28e-01   ph/cm2/s

======================================================================
Image
Pre-slew 15.0-350.0 keV image (Event data)
#   RAcent    DECcent   POSerr    Theta     Phi              Peak Cts       SNR   Name
  115.8736   -62.3232   0.0068    42.5811  -140.2686         7.6243966     28.049 TRIG_00932595

Foreground time interval of the image:
-37.984  10.549 (delta_t =  48.533 [sec])
Background time interval of the image:
-239.752 -37.984 (delta_t = 201.768 [sec])
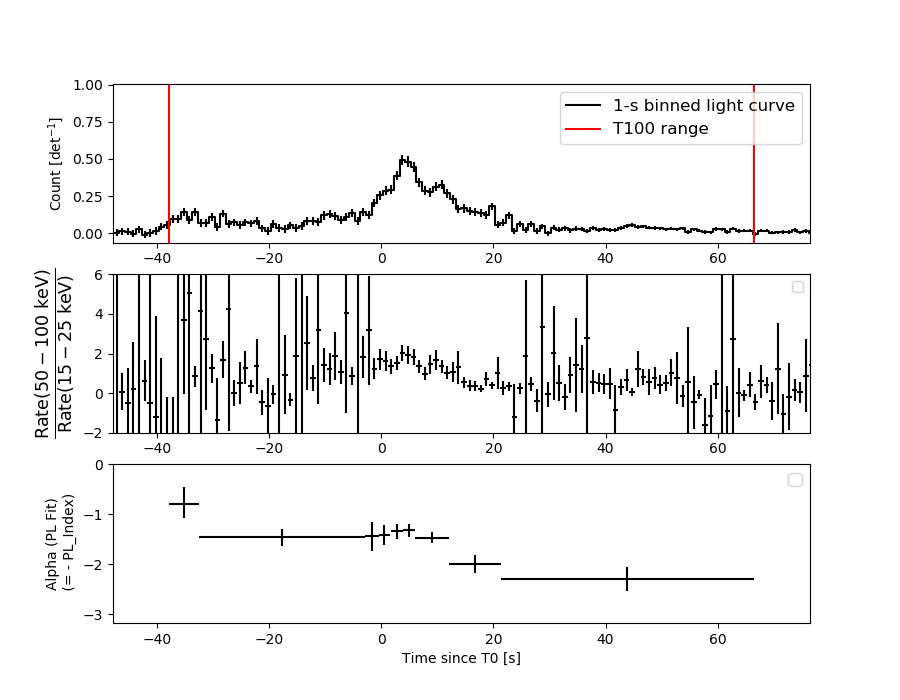
Light Curves
Note: The mask-weighted lightcurves have units of either count/det or counts/sec/det, where a det is 0.4 x 0.4 = 0.16 sq cm.
Full-time range; 1 s binning
Other quick-look light curves:
- 64 ms binning (zoomed)
- 16 ms binning (zoomed)
- 8 ms binning (zoomed)
- 2 ms binning (zoomed)
- SN=5 or 10 s binning (full-time range)
- Raw light curve
Spectra
- 64 ms binning (zoomed)
- 16 ms binning (zoomed)
- 8 ms binning (zoomed)
- 2 ms binning (zoomed)
- SN=5 or 10 s binning (full-time range)
- Raw light curve
Spectra
Notes:
- 1) The fitting includes the systematic errors.
- 2) When the burst includes telescope slew time periods, the fitting uses an average response file made from multiple 5-s response files through out the slew time plus single time preiod for the non-slew times, and weighted by the total counts in the corresponding time period using addrmf. An average response file is needed becuase a spectral fit using the pre-slew DRM will introduce some errors in both a spectral shape and a normalization if the PHA file contains a lot of the slew/post-slew time interval.
- 3) For fits to more complicated models (e.g. a power-law over a cutoff power-law), the BAT team has decided to require a chi-square improvement of more than 6 for each extra dof.
Time averaged spectrum fit using the average DRM
Power-law model
Time interval is from  -37.984 sec. to   66.492 sec.

Spectral model in power-law:
------------------------------------------------------------
Parameters  : value       lower 90%   higher 90%
Photon index: -1.56615     ( -0.0697265   0.0696076 )
Norm@50keV  : 7.08294E-03    ( -0.000277723   0.000277562 )
------------------------------------------------------------
#Fit statistic : Chi-Squared =          51.66 using 59 PHA bins.
# Reduced chi-squared =         0.9064 for     57 degrees of freedom
# Null hypothesis probability =   6.748097e-01

Photon flux (15-150 keV)    in 104.5 sec: 0.900935 ( -0.037814  0.037903 ) ph/cm2/s
Energy fluence (15-150 keV)             : 6.95322e-06 ( -2.87513e-07  2.88409e-07 ) ergs/cm2
Cutoff power-law model
Time interval is from  -37.984 sec. to   66.492 sec.
Spectral model in the cutoff power-law:
------------------------------------------------------------
Parameters  : value       lower 90%   higher 90%
Photon index: -1.3237     ( -0.263509   0.283515 )
Epeak [keV] : 146.524      ( -52.2495 -146.525 )
Norm@50keV  : 9.27841E-03    ( -0.00227583   0.00333815 )
------------------------------------------------------------
#Fit statistic : Chi-Squared =          49.26 using 59 PHA bins.
# Reduced chi-squared =         0.8796 for     56 degrees of freedom
# Null hypothesis probability =   7.259644e-01

Photon flux (15-150 keV)    in 104.5 sec: 0.888769 ( -0.039972  0.040049 ) ph/cm2/s
Energy fluence (15-150 keV)             : 6.84867e-06 ( -3.11852e-07  3.1056e-07 ) ergs/cm2
1-s peak spectrum fit
Power-law model
Time interval is from    4.036 sec. to    5.036 sec.

Spectral model in power-law:
------------------------------------------------------------
Parameters  : value       lower 90%   higher 90%
Photon index: -1.32693     ( -0.15999   0.161009 )
Norm@50keV  : 3.83072E-02    ( -0.00409444   0.00409423 )
------------------------------------------------------------
#Fit statistic : Chi-Squared =          51.59 using 59 PHA bins.
# Reduced chi-squared =         0.9051 for     57 degrees of freedom
# Null hypothesis probability =   6.774949e-01

Photon flux (15-150 keV)    in 1 sec: 4.59366 ( -0.51391  0.51483 ) ph/cm2/s
Energy fluence (15-150 keV)             : 3.76166e-07 ( -4.22556e-08  4.23095e-08 ) ergs/cm2
Cutoff power-law model
Time interval is from    4.036 sec. to    5.036 sec.
Spectral model in the cutoff power-law:
------------------------------------------------------------
Parameters  : value       lower 90%   higher 90%
Photon index: -0.578381     ( -0.636357   0.760423 )
Epeak [keV] : 105.254      ( -29.6808 238.001 )
Norm@50keV  : 8.68738E-02    ( -0.0428435   0.108322 )
------------------------------------------------------------
#Fit statistic : Chi-Squared =          47.44 using 59 PHA bins.
# Reduced chi-squared =         0.8471 for     56 degrees of freedom
# Null hypothesis probability =   7.853494e-01

Photon flux (15-150 keV)    in 1 sec: 4.55457 ( -0.51578  0.51671 ) ph/cm2/s
Energy fluence (15-150 keV)             : 0 ( 0  0 ) ergs/cm2
Time-resolved spectra
Distribution
T90 vs. Hardness ratio plot
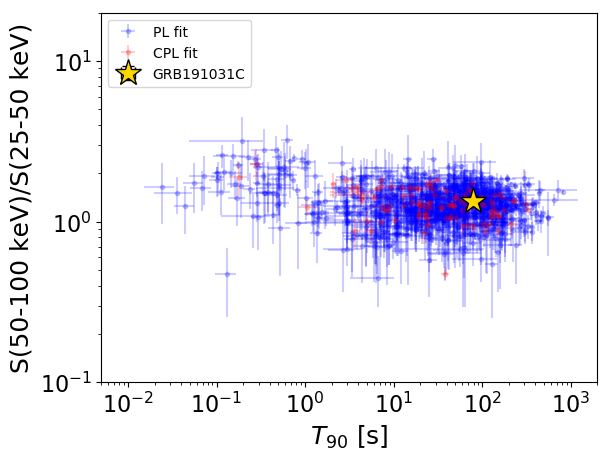
T90                                   = 78.5 sec.
Hardness ratio (energy fluence ratio) = 1.35085900449
S(15-50 keV) vs. S(50-150 keV) plot
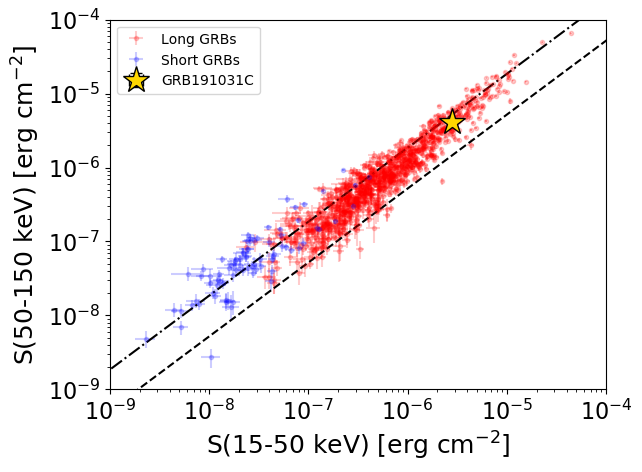
S(15-50 keV)  = 2.780459e-06
S(50-150 keV) = 4.172888e-06
The dash-dotted line and the dashed line traces the fluences calculated from the Band function with Epeak = 15 and 150 keV, respectively. Both lines assume a canonical values of alpha = -1 and beta = -2.5.
Mask shadow pattern
IMX = -7.067092969774560E-01, IMY = 5.873768208119715E-01
Spacecraft aspect plot
Bright source in the pre-burst/pre-slew/post-slew images
Pre-burst image of 15-350 keV band
Time interval of the image:
-239.752000 -37.984000

# RAcent  DECcent POSerr Theta    Phi  PeakCts   SNR AngSep     Name
#  [deg]    [deg]    ['] [deg]  [deg]                   [']
 31.2751 -18.6206    3.2  40.9   98.0   2.8104   3.6 ------	UNKNOWN
320.9346 -32.3041    2.3  47.4   -0.5   1.9331   4.9 ------	UNKNOWN
296.8152 -50.3738    2.4  46.2  -35.5   2.3600   4.8 ------	UNKNOWN
Pre-slew background subtracted image of 15-350 keV band
Time interval of the image:
-37.984000 10.548600

# RAcent  DECcent POSerr Theta    Phi  PeakCts   SNR AngSep     Name
#  [deg]    [deg]    ['] [deg]  [deg]                   [']
 64.6718 -43.4280    3.8  30.7  162.5   0.3595   3.0 ------	UNKNOWN
 97.0916 -46.8351    2.7  44.9 -167.4   0.7725   4.3 ------	UNKNOWN
115.8735 -62.3233    0.4  42.6 -140.3   7.6247  28.1 ------	UNKNOWN
286.7620 -51.2368    2.4  50.0  -42.5   2.5308   4.9 ------	UNKNOWN
Post-slew image of 15-350 keV band
Time interval of the image:
70.348590 962.311500

# RAcent  DECcent POSerr Theta    Phi  PeakCts   SNR AngSep     Name
#  [deg]    [deg]    ['] [deg]  [deg]                   [']
135.4993 -40.5792    1.8  24.8 -157.4   5.2386   6.4    2.0	Vela X-1
170.1232 -60.5231    5.0  25.3  -84.5   2.6028   2.3    8.3	Cen X-3
186.8962 -62.8424    4.2  31.0  -71.9   3.6454   2.8    7.9	GX 301-2
 72.5210 -31.7210    2.7  41.1  102.5  11.7604   4.3 ------	UNKNOWN
 62.1376 -71.6533    3.2  22.0   27.5   3.0447   3.6 ------	UNKNOWN
123.3702  -5.7641    2.5  56.9  173.9  18.2176   4.6 ------	UNKNOWN
181.0818 -48.0466    3.7  38.0  -96.0   8.5612   3.1 ------	UNKNOWN