Analysis Summary
Notes:
- 1) No attempt has been made to eliminate the non-significant decimal places.
- 2) This batgrbproduct analysis is done using the HEASARC data.
- 3) This batgrbproduct analysis is using the flight position for the mask-weighting calculation.
======================================================================
BAT GRB EVENT DATA PROCESSING REPORT
Process Script Ver: batgrbproduct v2.46
Process Start Time: Wed Nov 27 11:59:05 EST 2019
Host Name: bat1
Current Working Dir: /local/data/bat1/alien/Swift_3rdBATcatalog/event/batevent_reproc/trigger932608
======================================================================
Trigger: 00932608 Segment: 000
BAT Trigger Time: 594249834.976 [s; MET]
Trigger Stop: 594249835.04 [s; MET]
UTC: 2019-10-31T21:23:31.132400 [includes UTCF correction]
Where From?: (*SHORT BURST*) TDRSS scaled map message
BAT
RA: 283.275055137207 Dec: 47.6387522535621 [deg; J2000]
Catalogged Source?: NO
Point Source?: YES
GRB Indicated?: YES [ by BAT flight software ]
Image S/N Ratio: 8.55
Image Trigger?: NO
Rate S/N Ratio: 82.8613299434664 [ if not an image trigger ]
Image S/N Ratio: 8.55
Analysis Position: [ source = BAT ]
RA: 283.275055137207 Dec: 47.6387522535621 [deg; J2000]
Refined Position: [ source = BAT pre-slew burst ]
RA: 283.269426912568 Dec: 47.6446910308396 [deg; J2000]
{ 18h 53m 04.7s , +47d 38' 40.9" }
+/- 1.34798738681865 [arcmin] (estimated 90% radius based on SNR)
+/- 0.630975961294118 [arcmin] (formal 1-sigma fit error)
SNR: 19.8542236942298
Angular difference between the analysis and refined position is 0.422773 arcmin
Partial Coding Fraction: 0.375 [ including projection effects ]
Duration
T90: 0.287999987602234 +/- 0.0468188385078391
Measured from: -0.0199999809265137
to: 0.26800000667572 [s; relative to TRIGTIME]
T50: 0.143999934196472 +/- 0.0252982725496578
Measured from: 0.0160000324249268
to: 0.159999966621399 [s; relative to TRIGTIME]
Fluence
Peak Flux (peak 1 second)
Measured from: -0.359999895095825
to: 0.640000104904175 [s; relative to TRIGTIME]
Total Fluence
Measured from: -0.031999945640564
to: 0.308000087738037 [s; relative to TRIGTIME]
Band 1 Band 2 Band 3 Band 4
15-25 25-50 50-100 100-350 keV
Total 0.069202 0.161220 0.189867 0.124106
0.010166 0.013253 0.015697 0.015095 [error]
Peak 0.077133 0.162545 0.192140 0.132245
0.014161 0.016612 0.017961 0.017524 [error]
[ fluence units of on-axis counts / fully illuminated detector ]
======================================================================
====== Table of the duration information =============================
Value tstart tstop
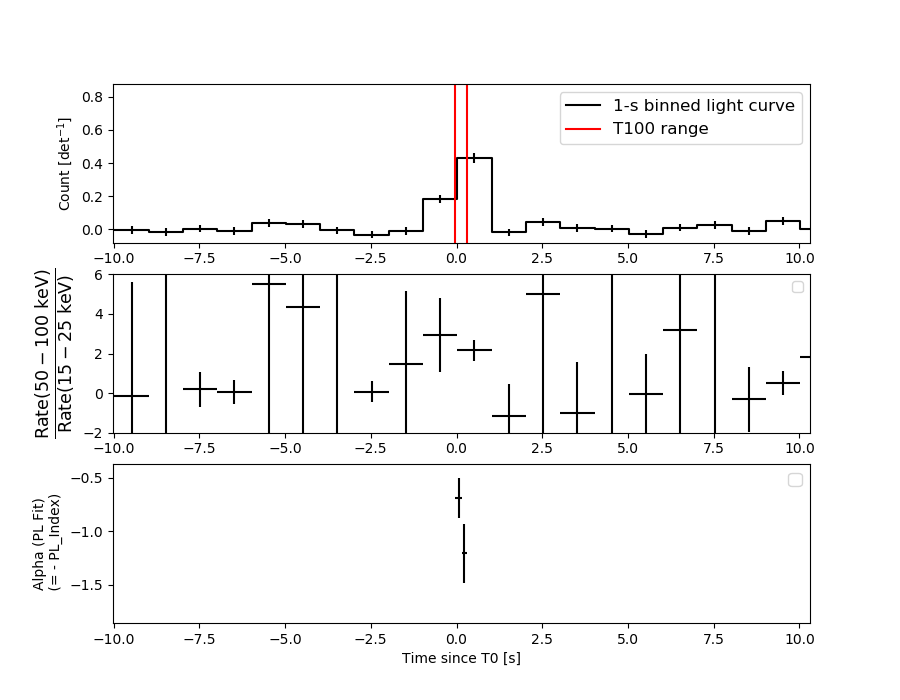
T100 0.340 -0.032 0.308
T90 0.288 -0.020 0.268
T50 0.144 0.016 0.160
Peak 1.000 -0.360 0.640
====== Spectral Analysis Summary =====================================
Model : spectral model: simple power-law (PL) and cutoff power-law (CPL)
Ph_index : photon index: E^{Ph_index}
Ph_90err : 90% error of the photon index
Epeak : Epeak in keV
Epeak_90err: 90% error of Epeak
Norm : normalization at 50 keV in both the PL model and CPL model
Nomr_90err : 90% error of the normalization
chi2 : Chi-Squared
dof : degree of freedo
=== Time-averaged spectral analysis ===
(Best model with acceptable fit: PL)
Model Ph_index Ph_90err_low Ph_90err_hi Epeak Epeak_90err_low Epeak_90err_hi Norm Nomr_90err_low Norm_90err_hi chi2 dof
PL -0.811 -0.151 0.156 - - - 1.03e-01 -9.04e-03 8.99e-03 59.500 57
CPL -0.739 -0.218 0.333 972.137 -972.137 -972.137 1.11e-01 -1.66e-02 3.63e-02 59.930 56
=== 1-s peak spectral analysis ===
(Best model with acceptable fit: N/A)
Model Ph_index Ph_90err_low Ph_90err_hi Epeak Epeak_90err_low Epeak_90err_hi Norm Nomr_90err_low Norm_90err_hi chi2 dof
PL -0.858 -0.186 0.194 - - - 3.66e-02 -3.84e-03 3.80e-03 56.260 57
CPL -0.863 -0.177 0.336 9999.360 -9999.360 -9999.360 3.69e-02 -4.13e-03 1.29e-02 56.320 56
=== Fluence/Peak Flux Summary ===
Model Band1 Band2 Band3 Band4 Band5 Total
15-25 25-50 50-100 100-350 15-150 15-350 keV
Fluence PL 2.35e-08 6.62e-08 1.51e-07 9.23e-07 4.07e-07 1.16e-06 erg/cm2
90%_error_low -4.16e-09 -7.18e-09 -1.43e-08 -1.89e-07 -3.90e-08 -1.98e-07 erg/cm2
90%_error_hi 4.40e-09 7.05e-09 1.42e-08 2.23e-07 3.92e-08 2.28e-07 erg/cm2
Peak flux PL 3.41e-04 4.15e-03 4.61e-02 4.37e+00 2.07e-01 4.42e+00 ph/cm2/s
90%_error_low -7.51e-05 -8.59e-04 -8.87e-03 -1.13e+00 -3.84e-02 -1.14e+00 ph/cm2/s
90%_error_hi 7.11e-04 7.04e-03 6.16e-02 2.73e+00 2.45e-01 2.80e+00 ph/cm2/s
Fluence CPL 2.35e-08 6.62e-08 1.48e-07 9.79e-07 4.10e-07 1.15e-06 erg/cm2
90%_error_low N/A N/A N/A -4.28e-07 N/A -3.56e-07 erg/cm2
90%_error_hi N/A N/A N/A 3.57e-08 N/A 1.02e-07 erg/cm2
Peak flux CPL 8.16e-01 1.21e+00 1.33e+00 3.06e+00 4.24e+00 6.09e+00 ph/cm2/s
90%_error_low N/A -1.75e-01 -1.37e-01 -1.17e+00 -4.70e-01 -8.89e-01 ph/cm2/s
90%_error_hi N/A 1.66e-01 1.52e-01 4.21e-01 4.01e-01 6.67e-01 ph/cm2/s
======================================================================
Image
Pre-slew 15.0-350.0 keV image (Event data)
#   RAcent    DECcent   POSerr    Theta     Phi              Peak Cts       SNR   Name
  283.2694    47.6447   0.0097    43.2144   -29.9595         0.5779534     19.854 TRIG_00932608

Foreground time interval of the image:
 -0.032   0.308 (delta_t =   0.340 [sec])
Background time interval of the image:
-432.075 -415.789 (delta_t =  16.286 [sec])
-239.976  -0.032 (delta_t = 239.944 [sec])
Light Curves
Note: The mask-weighted lightcurves have units of either count/det or counts/sec/det, where a det is 0.4 x 0.4 = 0.16 sq cm.
Full-time range; 1 s binning
Other quick-look light curves:
- 64 ms binning (zoomed)
- 16 ms binning (zoomed)
- 8 ms binning (zoomed)
- 2 ms binning (zoomed)
- SN=5 or 10 s binning (full-time range)
- Raw light curve
Spectra
- 64 ms binning (zoomed)
- 16 ms binning (zoomed)
- 8 ms binning (zoomed)
- 2 ms binning (zoomed)
- SN=5 or 10 s binning (full-time range)
- Raw light curve
Spectra
Notes:
- 1) The fitting includes the systematic errors.
- 2) When the burst includes telescope slew time periods, the fitting uses an average response file made from multiple 5-s response files through out the slew time plus single time preiod for the non-slew times, and weighted by the total counts in the corresponding time period using addrmf. An average response file is needed becuase a spectral fit using the pre-slew DRM will introduce some errors in both a spectral shape and a normalization if the PHA file contains a lot of the slew/post-slew time interval.
- 3) For fits to more complicated models (e.g. a power-law over a cutoff power-law), the BAT team has decided to require a chi-square improvement of more than 6 for each extra dof.
Time averaged spectrum fit using the average DRM
Power-law model
Time interval is from   -0.032 sec. to    0.308 sec.

Spectral model in power-law:
------------------------------------------------------------
Parameters  : value       lower 90%   higher 90%
Photon index: -0.811237     ( -0.151354   0.155697 )
Norm@50keV  : 0.102950    ( -0.0090348   0.00898819 )
------------------------------------------------------------
#Fit statistic : Chi-Squared =          59.50 using 59 PHA bins.
# Reduced chi-squared =          1.044 for     57 degrees of freedom
# Null hypothesis probability =   3.846414e-01

Photon flux (15-150 keV)    in 0.34 sec: 11.8277 ( -1.0235  1.0244 ) ph/cm2/s
Energy fluence (15-150 keV)             : 4.07164e-07 ( -3.89762e-08  3.92003e-08 ) ergs/cm2
Cutoff power-law model
Time interval is from   -0.032 sec. to    0.308 sec.
Spectral model in the cutoff power-law:
------------------------------------------------------------
Parameters  : value       lower 90%   higher 90%
Photon index: -0.804452     ( -0.218164   0.333144 )
Epeak [keV] : 9999.12      ( -9999.13 -9999.13 )
Norm@50keV  : 0.103692    ( -0.00894746   0.0438786 )
------------------------------------------------------------
#Fit statistic : Chi-Squared =          59.54 using 59 PHA bins.
# Reduced chi-squared =          1.063 for     56 degrees of freedom
# Null hypothesis probability =   3.482039e-01

Photon flux (15-150 keV)    in 0.34 sec: 11.8533 ( -1.2518  1.1978 ) ph/cm2/s
Energy fluence (15-150 keV)             : 4.09805e-07 ( 0  0 ) ergs/cm2
1-s peak spectrum fit
Power-law model
Time interval is from   -0.360 sec. to    0.640 sec.

Spectral model in power-law:
------------------------------------------------------------
Parameters  : value       lower 90%   higher 90%
Photon index: -0.858172     ( -0.186452   0.19448 )
Norm@50keV  : 3.66062E-02    ( -0.00384205   0.0037955 )
------------------------------------------------------------
#Fit statistic : Chi-Squared =          56.26 using 59 PHA bins.
# Reduced chi-squared =         0.9871 for     57 degrees of freedom
# Null hypothesis probability =   5.027013e-01

Photon flux (15-150 keV)    in 1 sec: 0.207362 ( -0.03839  0.244898 ) ph/cm2/s
Energy fluence (15-150 keV)             : 4.17705e-07 ( -4.53647e-08  4.55392e-08 ) ergs/cm2
Cutoff power-law model

Time interval is from   -0.360 sec. to    0.640 sec.
Spectral model in the cutoff power-law:
------------------------------------------------------------
Parameters  : value       lower 90%   higher 90%
Photon index: -0.862986     ( -0.177433   0.335293 )
Epeak [keV] : 9999.36      ( -9999.36 -9999.36 )
Norm@50keV  : 3.69215E-02    ( -0.00411767   0.012894 )
------------------------------------------------------------
#Fit statistic : Chi-Squared =          56.32 using 59 PHA bins.
# Reduced chi-squared =          1.006 for     56 degrees of freedom
# Null hypothesis probability =   4.626967e-01

Photon flux (15-150 keV)    in 1 sec: 4.23550 ( -0.46987  0.40087 ) ph/cm2/s
Energy fluence (15-150 keV)             : 4.18958e-07 ( 0  0 ) ergs/cm2
Time-resolved spectra
Distribution
T90 vs. Hardness ratio plot
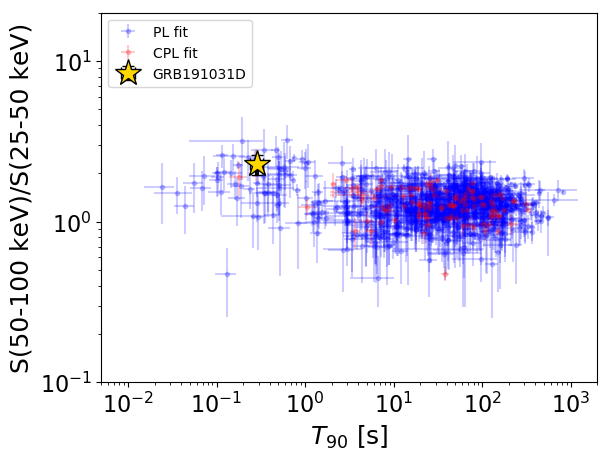
T90                                   = 0.288 sec.
Hardness ratio (energy fluence ratio) = 2.27955427711
S(15-50 keV) vs. S(50-150 keV) plot
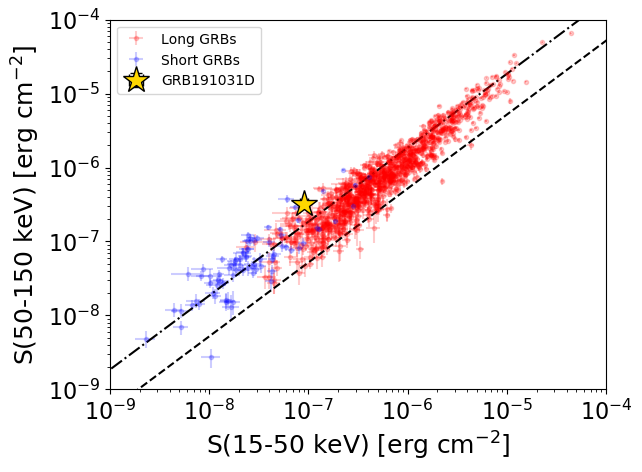
S(15-50 keV)  = 8.975102e-08
S(50-150 keV) = 3.174083e-07
The dash-dotted line and the dashed line traces the fluences calculated from the Band function with Epeak = 15 and 150 keV, respectively. Both lines assume a canonical values of alpha = -1 and beta = -2.5.
Mask shadow pattern
IMX = 8.139942177341422E-01, IMY = 4.691928073960250E-01
Spacecraft aspect plot
Bright source in the pre-burst/pre-slew/post-slew images
Pre-burst image of 15-350 keV band
Time interval of the image:
-432.075400 -415.789200
-239.976000 -0.032000

# RAcent  DECcent POSerr Theta    Phi  PeakCts   SNR AngSep     Name
#  [deg]    [deg]    ['] [deg]  [deg]                   [']
299.5943  35.1936    0.8  28.0  -44.8   6.0941  14.1    0.5	Cyg X-1
308.0851  40.9788    2.2  24.4  -26.4   1.9068   5.2    1.9	Cyg X-3
326.1139  38.3900    4.1  14.4    4.6   0.9661   2.8    4.9	Cyg X-2
347.9978 -11.0233    3.6  39.7  166.0   1.7604   3.2 ------	UNKNOWN
349.4802 -23.7513    2.6  51.8  171.8   4.9352   4.4 ------	UNKNOWN
320.8800  36.2246    3.7  14.1  -14.5   0.9679   3.1 ------	UNKNOWN
276.9692  54.8079    3.6  49.0  -22.0   2.5960   3.2 ------	UNKNOWN
Pre-slew background subtracted image of 15-350 keV band
Time interval of the image:
-0.032000 0.308000

# RAcent  DECcent POSerr Theta    Phi  PeakCts   SNR AngSep     Name
#  [deg]    [deg]    ['] [deg]  [deg]                   [']
299.5297  35.3370  100.5  28.1  -44.5  -0.0022  -0.1    8.6	Cyg X-1
308.2811  41.0057   46.1  24.3  -26.2  -0.0038  -0.3    8.4	Cyg X-3
326.0510  38.1361    0.0  14.2    4.2   0.0158   1.1   12.5	Cyg X-2
350.5139  -8.8459    2.0  39.0  161.0   0.1242   5.8 ------	UNKNOWN
345.2554   0.4112    2.0  28.3  160.3   0.0953   5.9 ------	UNKNOWN
350.2801 -28.8734    2.5  56.8  173.5   0.3600   4.6 ------	UNKNOWN
284.4096  51.3145    2.4  43.7  -24.6   0.1297   4.8 ------	UNKNOWN
283.2694  47.6447    0.6  43.2  -30.0   0.5778  19.8 ------	UNKNOWN
Post-slew image of 15-350 keV band
Time interval of the image:
72.324580 962.046000
1435.024000 1555.752800

# RAcent  DECcent POSerr Theta    Phi  PeakCts   SNR AngSep     Name
#  [deg]    [deg]    ['] [deg]  [deg]                   [']
254.4515  35.2049    7.3  24.7  -83.3   2.0827   1.6    8.3	Her X-1
288.7066  11.0072    5.5  36.9 -162.5   2.8812   2.1    6.5	GRS 1915+105
299.6061  35.2171    0.6  17.4  156.1  21.7618  20.2    1.2	Cyg X-1
308.1613  40.9950    1.5  18.9  127.8   8.2316   7.8    3.4	Cyg X-3
326.2315  38.4511   60.7  32.2  116.9   0.3218   0.2    8.3	Cyg X-2
310.0016  -4.1209    3.2  56.8  174.0  14.1745   3.6 ------	UNKNOWN
253.1063  40.9279    2.6  22.5  -69.8   5.7317   4.4 ------	UNKNOWN