Analysis Summary
Notes:
- 1) No attempt has been made to eliminate the non-significant decimal places.
- 2) This batgrbproduct analysis is done using the HEASARC data.
- 3) This batgrbproduct analysis is using the flight position for the mask-weighting calculation.
======================================================================
BAT GRB EVENT DATA PROCESSING REPORT
Process Script Ver: batgrbproduct v2.46
Process Start Time: Wed Nov 27 11:54:33 EST 2019
Host Name: bat1
Current Working Dir: /local/data/bat1/alien/Swift_3rdBATcatalog/event/batevent_reproc/trigger933515
======================================================================
Trigger: 00933515 Segment: 000
BAT Trigger Time: 594742547.776 [s; MET]
Trigger Stop: 594742548.288 [s; MET]
UTC: 2019-11-06T14:15:23.900640 [includes UTCF correction]
Where From?: TDRSS position message
BAT
RA: 269.349636887849 Dec: 46.0518248196464 [deg; J2000]
Catalogged Source?: NO
Point Source?: YES
GRB Indicated?: YES [ by BAT flight software ]
Image S/N Ratio: 7.85
Image Trigger?: NO
Rate S/N Ratio: 20.5669638012031 [ if not an image trigger ]
Image S/N Ratio: 7.85
Analysis Position: [ source = BAT ]
RA: 269.349636887849 Dec: 46.0518248196464 [deg; J2000]
Refined Position: [ source = BAT pre-slew burst ]
RA: 269.359318636608 Dec: 46.0473276332839 [deg; J2000]
{ 17h 57m 26.2s , +46d 02' 50.4" }
+/- 1.63859635698673 [arcmin] (estimated 90% radius based on SNR)
+/- 0.741387568123865 [arcmin] (formal 1-sigma fit error)
SNR: 15.0220716823996
Angular difference between the analysis and refined position is 0.485133 arcmin
Partial Coding Fraction: 0.953125 [ including projection effects ]
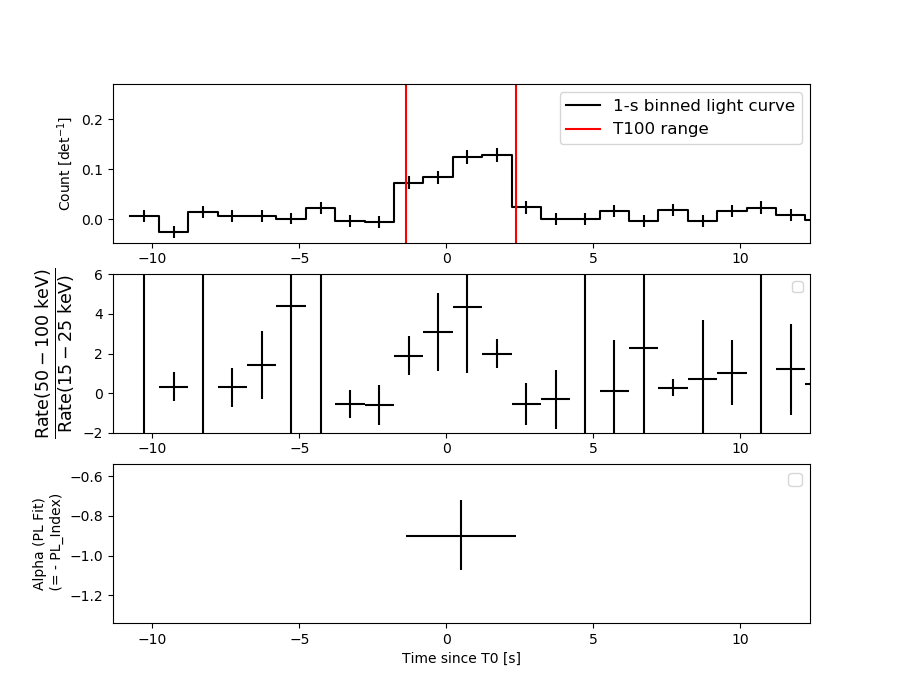
Duration
T90: 3.43599987030029 +/- 0.324863016551151
Measured from: -1.25199997425079
to: 2.1839998960495 [s; relative to TRIGTIME]
T50: 1.64799988269806 +/- 0.720988169553211
Measured from: -0.00800001621246338
to: 1.6399998664856 [s; relative to TRIGTIME]
Fluence
Peak Flux (peak 1 second)
Measured from: -0.0479999780654907
to: 0.952000021934509 [s; relative to TRIGTIME]
Total Fluence
Measured from: -1.35600006580353
to: 2.37999999523163 [s; relative to TRIGTIME]
Band 1 Band 2 Band 3 Band 4
15-25 25-50 50-100 100-350 keV
Total 0.056877 0.157930 0.156001 0.053594
0.013764 0.014639 0.013370 0.011352 [error]
Peak 0.020252 0.054813 0.053791 0.023784
0.007093 0.007917 0.007290 0.005981 [error]
[ fluence units of on-axis counts / fully illuminated detector ]
======================================================================
====== Table of the duration information =============================
Value tstart tstop
T100 3.736 -1.356 2.380
T90 3.436 -1.252 2.184
T50 1.648 -0.008 1.640
Peak 1.000 -0.048 0.952
====== Spectral Analysis Summary =====================================
Model : spectral model: simple power-law (PL) and cutoff power-law (CPL)
Ph_index : photon index: E^{Ph_index}
Ph_90err : 90% error of the photon index
Epeak : Epeak in keV
Epeak_90err: 90% error of Epeak
Norm : normalization at 50 keV in both the PL model and CPL model
Nomr_90err : 90% error of the normalization
chi2 : Chi-Squared
dof : degree of freedo
=== Time-averaged spectral analysis ===
(Best model with acceptable fit: PL)
Model Ph_index Ph_90err_low Ph_90err_hi Epeak Epeak_90err_low Epeak_90err_hi Norm Nomr_90err_low Norm_90err_hi chi2 dof
PL -0.900 -0.171 0.178 - - - 7.59e-03 -7.55e-04 7.49e-04 45.040 57
CPL -0.595 -0.386 0.759 263.338 -263.338 -263.338 1.04e-02 -3.39e-03 1.15e-02 44.420 56
=== 1-s peak spectral analysis ===
(Best model with acceptable fit: PL)
Model Ph_index Ph_90err_low Ph_90err_hi Epeak Epeak_90err_low Epeak_90err_hi Norm Nomr_90err_low Norm_90err_hi chi2 dof
PL -0.770 -0.267 0.288 - - - 9.78e-03 -1.56e-03 1.52e-03 44.710 57
CPL -0.765 -0.267 0.347 9999.190 -9999.190 -9999.190 9.85e-03 -1.47e-03 1.79e-02 44.710 56
=== Fluence/Peak Flux Summary ===
Model Band1 Band2 Band3 Band4 Band5 Total
15-25 25-50 50-100 100-350 15-150 15-350 keV
Fluence PL 2.07e-08 5.50e-08 1.18e-07 6.56e-07 3.18e-07 8.50e-07 erg/cm2
90%_error_low -4.18e-09 -6.88e-09 -1.23e-08 -1.47e-07 -3.30e-08 -1.54e-07 erg/cm2
90%_error_hi 4.49e-09 6.76e-09 1.22e-08 1.78e-07 3.31e-08 1.81e-07 erg/cm2
Peak flux PL 2.01e-01 3.13e-01 3.67e-01 8.32e-01 1.13e+00 1.71e+00 ph/cm2/s
90%_error_low -6.55e-02 -6.66e-02 -5.53e-02 -2.52e-01 -1.71e-01 -2.84e-01 ph/cm2/s
90%_error_hi 7.47e-02 6.52e-02 5.49e-02 3.26e-01 1.72e-01 3.12e-01 ph/cm2/s
Fluence CPL 1.92e-08 5.62e-08 1.22e-07 4.33e-07 3.12e-07 6.30e-07 erg/cm2
90%_error_low -5.15e-09 -7.39e-09 -1.46e-08 -2.44e-07 -3.60e-08 -2.43e-07 erg/cm2
90%_error_hi 5.16e-09 7.58e-09 1.49e-08 3.98e-07 3.53e-08 2.75e-07 erg/cm2
Peak flux CPL 2.01e-01 3.14e-01 3.68e-01 8.31e-01 1.13e+00 1.71e+00 ph/cm2/s
90%_error_low -6.65e-02 -5.70e-02 -5.52e-02 -5.22e-01 -1.75e-01 -5.56e-01 ph/cm2/s
90%_error_hi 5.61e-02 6.44e-02 7.05e-02 1.68e-01 1.71e-01 2.85e-01 ph/cm2/s
======================================================================
Image
Pre-slew 15.0-350.0 keV image (Event data)
#   RAcent    DECcent   POSerr    Theta     Phi              Peak Cts       SNR   Name
  269.3593    46.0473   0.0127    15.4453    42.2249         0.4180388     15.022 TRIG_00933515

Foreground time interval of the image:
 -1.356   2.380 (delta_t =   3.736 [sec])
Background time interval of the image:
-255.275  -1.356 (delta_t = 253.919 [sec])
Light Curves
Note: The mask-weighted lightcurves have units of either count/det or counts/sec/det, where a det is 0.4 x 0.4 = 0.16 sq cm.
Full-time range; 1 s binning
Other quick-look light curves:
- 64 ms binning (zoomed)
- 16 ms binning (zoomed)
- 8 ms binning (zoomed)
- 2 ms binning (zoomed)
- SN=5 or 10 s binning (full-time range)
- Raw light curve
Spectra
- 64 ms binning (zoomed)
- 16 ms binning (zoomed)
- 8 ms binning (zoomed)
- 2 ms binning (zoomed)
- SN=5 or 10 s binning (full-time range)
- Raw light curve
Spectra
Notes:
- 1) The fitting includes the systematic errors.
- 2) When the burst includes telescope slew time periods, the fitting uses an average response file made from multiple 5-s response files through out the slew time plus single time preiod for the non-slew times, and weighted by the total counts in the corresponding time period using addrmf. An average response file is needed becuase a spectral fit using the pre-slew DRM will introduce some errors in both a spectral shape and a normalization if the PHA file contains a lot of the slew/post-slew time interval.
- 3) For fits to more complicated models (e.g. a power-law over a cutoff power-law), the BAT team has decided to require a chi-square improvement of more than 6 for each extra dof.
Time averaged spectrum fit using the average DRM
Power-law model
Time interval is from   -1.356 sec. to    2.380 sec.

Spectral model in power-law:
------------------------------------------------------------
Parameters  : value       lower 90%   higher 90%
Photon index: -0.899935     ( -0.170793   0.177779 )
Norm@50keV  : 7.58511E-03    ( -0.000754777   0.000749447 )
------------------------------------------------------------
#Fit statistic : Chi-Squared =          45.04 using 59 PHA bins.
# Reduced chi-squared =         0.7901 for     57 degrees of freedom
# Null hypothesis probability =   8.742222e-01

Photon flux (15-150 keV)    in 3.736 sec: 0.870592 ( -0.086489  0.08674 ) ph/cm2/s
Energy fluence (15-150 keV)             : 3.18073e-07 ( -3.29666e-08  3.31451e-08 ) ergs/cm2
Cutoff power-law model
Time interval is from   -1.356 sec. to    2.380 sec.
Spectral model in the cutoff power-law:
------------------------------------------------------------
Parameters  : value       lower 90%   higher 90%
Photon index: -0.594798     ( -0.386119   0.758631 )
Epeak [keV] : 263.338      ( -263.34 -263.34 )
Norm@50keV  : 1.03824E-02    ( -0.00339088   0.0115012 )
------------------------------------------------------------
#Fit statistic : Chi-Squared =          44.42 using 59 PHA bins.
# Reduced chi-squared =         0.7933 for     56 degrees of freedom
# Null hypothesis probability =   8.677069e-01

Photon flux (15-150 keV)    in 3.736 sec: 0.859520 ( -0.089846  0.089876 ) ph/cm2/s
Energy fluence (15-150 keV)             : 3.12491e-07 ( -3.60404e-08  3.53473e-08 ) ergs/cm2
1-s peak spectrum fit
Power-law model
Time interval is from   -0.048 sec. to    0.952 sec.

Spectral model in power-law:
------------------------------------------------------------
Parameters  : value       lower 90%   higher 90%
Photon index: -0.77045     ( -0.266657   0.288489 )
Norm@50keV  : 9.78014E-03    ( -0.00155785   0.00152135 )
------------------------------------------------------------
#Fit statistic : Chi-Squared =          44.71 using 59 PHA bins.
# Reduced chi-squared =         0.7845 for     57 degrees of freedom
# Null hypothesis probability =   8.813884e-01

Photon flux (15-150 keV)    in 1 sec: 1.12543 ( -0.171089  0.1722 ) ph/cm2/s
Energy fluence (15-150 keV)             : 1.15744e-07 ( -1.80158e-08  1.81281e-08 ) ergs/cm2
Cutoff power-law model
Time interval is from   -0.048 sec. to    0.952 sec.
Spectral model in the cutoff power-law:
------------------------------------------------------------
Parameters  : value       lower 90%   higher 90%
Photon index: -0.764559     ( -0.267689   0.346776 )
Epeak [keV] : 9999.19      ( -9999.32 -9999.32 )
Norm@50keV  : 9.85439E-03    ( -0.00146476   0.0178813 )
------------------------------------------------------------
#Fit statistic : Chi-Squared =          44.71 using 59 PHA bins.
# Reduced chi-squared =         0.7985 for     56 degrees of freedom
# Null hypothesis probability =   8.607360e-01

Photon flux (15-150 keV)    in 1 sec: 1.12552 ( -0.174944  0.17087 ) ph/cm2/s
Energy fluence (15-150 keV)             : 1.15776e-07 ( -1.89527e-08  1.69848e-08 ) ergs/cm2
Time-resolved spectra
Distribution
T90 vs. Hardness ratio plot
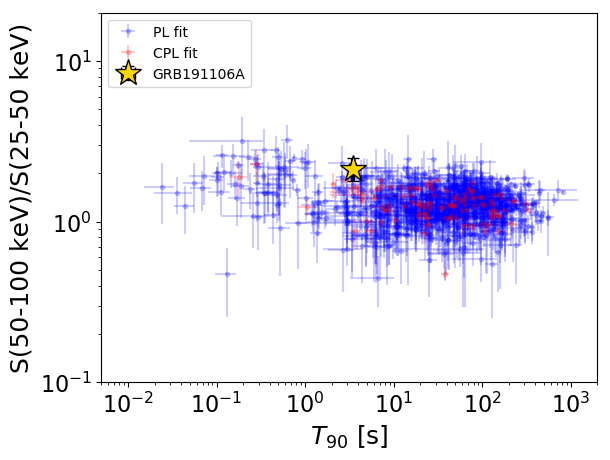
T90                                   = 3.436 sec.
Hardness ratio (energy fluence ratio) = 2.14362998302
S(15-50 keV) vs. S(50-150 keV) plot
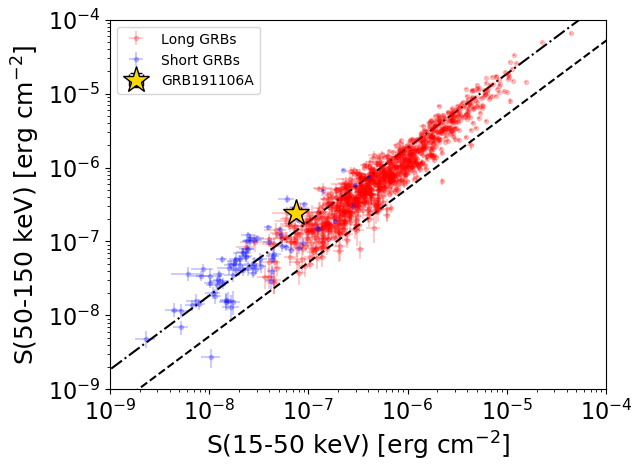
S(15-50 keV)  = 7.574058e-08
S(50-150 keV) = 2.423287e-07
The dash-dotted line and the dashed line traces the fluences calculated from the Band function with Epeak = 15 and 150 keV, respectively. Both lines assume a canonical values of alpha = -1 and beta = -2.5.
Mask shadow pattern
IMX = 2.046010439575555E-01, IMY = -1.856828444633533E-01
Spacecraft aspect plot
Bright source in the pre-burst/pre-slew/post-slew images
Pre-burst image of 15-350 keV band
Time interval of the image:
-255.275400 -1.356000

# RAcent  DECcent POSerr Theta    Phi  PeakCts   SNR AngSep     Name
#  [deg]    [deg]    ['] [deg]  [deg]                   [']
254.4700  35.2473    1.9  11.1  -27.9   1.7257   6.2    5.7	Her X-1
268.5298  -1.4401    8.1  32.2 -148.6  -0.5673  -1.4    9.7	SW J1753.5-0127
270.4356 -25.1158    6.6  56.0 -149.2   2.6191   1.8    8.5	GX 5-1
273.9642 -14.0594    4.9  45.4 -155.0   1.4597   2.4    2.8	GX 17+2
288.8617  10.8100   12.3  28.7  164.2  -0.3098  -0.9    8.9	GRS 1915+105
299.5563  35.1937    1.0  27.9  107.0   4.6540  11.4    1.7	Cyg X-1
308.2028  40.8826    3.6  34.9   96.4   1.8649   3.2    5.9	Cyg X-3
213.0592  68.5524    3.1  48.5   11.9   2.0388   3.7 ------	UNKNOWN
285.1331  -2.9833    2.9  38.1 -175.9   1.6024   3.9 ------	UNKNOWN
242.9187  22.8422    2.5  22.5  -69.8   1.6527   4.6 ------	UNKNOWN
209.8413  43.6866    3.3  46.1  -22.1   1.9984   3.5 ------	UNKNOWN
224.9744  26.7740    2.7  36.5  -50.6   2.0520   4.2 ------	UNKNOWN
267.9030 -23.6577    2.4  54.4 -146.4   6.8042   4.9 ------	UNKNOWN
Pre-slew background subtracted image of 15-350 keV band
Time interval of the image:
-1.356000 2.380000

# RAcent  DECcent POSerr Theta    Phi  PeakCts   SNR AngSep     Name
#  [deg]    [deg]    ['] [deg]  [deg]                   [']
254.4590  35.3436 1190.8  11.2  -27.5  -0.0002  -0.0    0.1	Her X-1
268.3930  -1.2707    0.0  32.1 -148.4   0.0447   1.4   11.0	SW J1753.5-0127
270.2303 -25.1237   31.8  56.0 -148.9  -0.0550  -0.4    4.0	GX 5-1
273.9449 -13.9059    8.0  45.2 -155.0  -0.0817  -1.4    8.6	GX 17+2
288.7308  10.7722   38.7  28.6  164.5   0.0095   0.3   11.1	GRS 1915+105
299.4602  35.0235    0.0  27.8  107.4   0.0490   1.3   12.5	Cyg X-1
308.2039  40.8408    6.8  34.9   96.5   0.0998   1.7    7.9	Cyg X-3
295.1017  25.9336    2.5  25.5  128.8   0.1527   4.7 ------	UNKNOWN
269.3593  46.0473    0.8  15.4   42.2   0.4181  15.0 ------	UNKNOWN
Post-slew image of 15-350 keV band
Time interval of the image:
54.124600 719.219200
720.224000 962.302000

# RAcent  DECcent POSerr Theta    Phi  PeakCts   SNR AngSep     Name
#  [deg]    [deg]    ['] [deg]  [deg]                   [']
254.4813  35.3577    1.6  15.5  -85.7   6.4521   7.4    1.5	Her X-1
268.2480  -1.5230    7.7  47.6 -135.8  -4.2663  -1.5    8.3	SW J1753.5-0127
288.8317  11.1021    4.5  38.7 -168.9   3.1589   2.6    9.6	GRS 1915+105
299.5940  35.1935    0.8  25.2  147.4  14.3810  15.4    0.5	Cyg X-1
308.1590  40.9529    1.6  28.3  128.9   7.5852   7.2    2.2	Cyg X-3
326.0507  38.2818    6.3  41.9  122.4   7.3496   1.8    6.2	Cyg X-2
123.7953  86.6736    4.1  46.7   40.2   6.3375   2.8 ------	UNKNOWN
292.6151  13.4441    4.1  38.1 -175.9   3.1052   2.8 ------	UNKNOWN