Analysis Summary
Notes:
- 1) No attempt has been made to eliminate the non-significant decimal places.
- 2) This batgrbproduct analysis is done using the HEASARC data.
- 3) This batgrbproduct analysis is using the flight position for the mask-weighting calculation.
======================================================================
BAT GRB EVENT DATA PROCESSING REPORT
Process Script Ver: batgrbproduct v2.46
Process Start Time: Wed Dec 11 18:43:03 EST 2019
Host Name: bat1
Current Working Dir: /local/data/bat1/alien/Swift_3rdBATcatalog/event/batevent_reproc/trigger938899
======================================================================
Trigger: 00938899 Segment: 000
BAT Trigger Time: 596122400.384 [s; MET]
Trigger Stop: 596122402.432 [s; MET]
UTC: 2019-11-22T13:32:56.419620 [includes UTCF correction]
Where From?: TDRSS position message
BAT
RA: 54.2959315816296 Dec: -32.1758874824898 [deg; J2000]
Catalogged Source?: NO
Point Source?: YES
GRB Indicated?: YES [ by BAT flight software ]
Image S/N Ratio: 11.61
Image Trigger?: NO
Rate S/N Ratio: 14.4913767461894 [ if not an image trigger ]
Image S/N Ratio: 11.61
Analysis Position: [ source = BAT ]
RA: 54.2959315816296 Dec: -32.1758874824898 [deg; J2000]
Refined Position: [ source = BAT pre-slew burst ]
RA: 54.2902253560452 Dec: -32.1761132584093 [deg; J2000]
{ 03h 37m 09.7s , -32d 10' 34.0" }
+/- 0.976353338448075 [arcmin] (estimated 90% radius based on SNR)
+/- 0.230404013882231 [arcmin] (formal 1-sigma fit error)
SNR: 31.4749827367427
Angular difference between the analysis and refined position is 0.290107 arcmin
Partial Coding Fraction: 0.2695312 [ including projection effects ]
Duration
T90: 125.735999941826 +/- 31.0497181822785
Measured from: -6.51999998092651
to: 119.215999960899 [s; relative to TRIGTIME]
T50: 33.5119999647141 +/- 4.28430485486506
Measured from: 1.62000000476837
to: 35.1319999694824 [s; relative to TRIGTIME]
Fluence
Peak Flux (peak 1 second)
Measured from: 6.44400000572205
to: 7.44400000572205 [s; relative to TRIGTIME]
Total Fluence
Measured from: -11.1199998855591
to: 196.104000091553 [s; relative to TRIGTIME]
Band 1 Band 2 Band 3 Band 4
15-25 25-50 50-100 100-350 keV
Total 2.978720 4.203628 2.829380 0.529738
0.118145 0.125874 0.109069 0.089473 [error]
Peak 0.093479 0.150167 0.100426 0.023048
0.013263 0.015540 0.013295 0.009813 [error]
[ fluence units of on-axis counts / fully illuminated detector ]
======================================================================
====== Table of the duration information =============================
Value tstart tstop
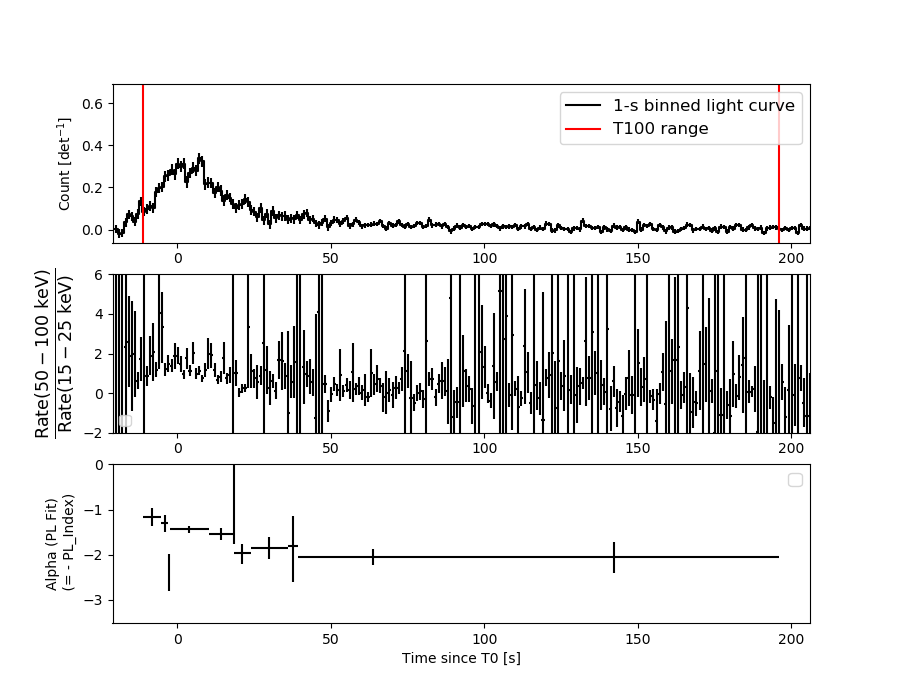
T100 207.224 -11.120 196.104
T90 125.736 -6.520 119.216
T50 33.512 1.620 35.132
Peak 1.000 6.444 7.444
====== Spectral Analysis Summary =====================================
Model : spectral model: simple power-law (PL) and cutoff power-law (CPL)
Ph_index : photon index: E^{Ph_index}
Ph_90err : 90% error of the photon index
Epeak : Epeak in keV
Epeak_90err: 90% error of Epeak
Norm : normalization at 50 keV in both the PL model and CPL model
Nomr_90err : 90% error of the normalization
chi2 : Chi-Squared
dof : degree of freedo
=== Time-averaged spectral analysis ===
(Best model with acceptable fit: CPL)
Model Ph_index Ph_90err_low Ph_90err_hi Epeak Epeak_90err_low Epeak_90err_hi Norm Nomr_90err_low Norm_90err_hi chi2 dof
PL -1.664 -0.067 0.067 - - - 3.44e-03 -1.30e-04 1.30e-04 72.420 57
CPL -1.173 -0.271 0.289 84.884 -14.925 42.413 6.02e-03 -1.57e-03 2.30e-03 62.380 56
=== 1-s peak spectral analysis ===
(Best model with acceptable fit: PL)
Model Ph_index Ph_90err_low Ph_90err_hi Epeak Epeak_90err_low Epeak_90err_hi Norm Nomr_90err_low Norm_90err_hi chi2 dof
PL -1.704 -0.203 0.195 - - - 2.33e-02 -3.06e-03 3.01e-03 59.150 57
CPL -1.292 -0.393 0.809 81.593 -35.580 -81.593 3.87e-02 -1.78e-02 6.53e-02 58.130 56
=== Fluence/Peak Flux Summary ===
Model Band1 Band2 Band3 Band4 Band5 Total
15-25 25-50 50-100 100-350 15-150 15-350 keV
Fluence PL 1.06e-06 1.76e-06 2.23e-06 5.61e-06 6.61e-06 1.07e-05 erg/cm2
90%_error_low -6.86e-08 -6.91e-08 -1.10e-07 -5.78e-07 -2.63e-07 -6.64e-07 erg/cm2
90%_error_hi 7.01e-08 6.89e-08 1.10e-07 6.21e-07 2.64e-07 6.97e-07 erg/cm2
Peak flux PL 1.17e+00 1.04e+00 6.38e-01 5.94e-01 3.10e+00 3.44e+00 ph/cm2/s
90%_error_low -2.06e-01 -1.25e-01 -1.07e-01 -1.73e-01 -3.69e-01 -4.13e-01 ph/cm2/s
90%_error_hi 2.14e-01 1.25e-01 1.06e-01 2.08e-01 3.70e-01 4.15e-01 ph/cm2/s
Fluence CPL 9.67e-07 1.84e-06 2.29e-06 2.87e-06 6.37e-06 7.96e-06 erg/cm2
90%_error_low -8.32e-08 -8.12e-08 -1.20e-07 -8.19e-07 -2.95e-07 -8.68e-07 erg/cm2
90%_error_hi 8.48e-08 8.22e-08 1.21e-07 1.22e-06 2.95e-07 1.23e-06 erg/cm2
Peak flux CPL 1.10e+00 1.09e+00 6.60e-01 3.68e-01 3.07e+00 3.23e+00 ph/cm2/s
90%_error_low -2.34e-01 -1.53e-01 -1.16e-01 -2.13e-01 -3.73e-01 -4.41e-01 ph/cm2/s
90%_error_hi 2.37e-01 1.60e-01 1.19e-01 2.99e-01 3.73e-01 5.25e-01 ph/cm2/s
======================================================================
Image
Pre-slew 15.0-350.0 keV image (Event data)
#   RAcent    DECcent   POSerr    Theta     Phi              Peak Cts       SNR   Name
   54.2902   -32.1761   0.0061    34.7554   114.2280         7.7350336     31.475 TRIG_00938899

Foreground time interval of the image:
-11.120  29.917 (delta_t =  41.037 [sec])
Background time interval of the image:
-239.384 -11.120 (delta_t = 228.264 [sec])
Light Curves
Note: The mask-weighted lightcurves have units of either count/det or counts/sec/det, where a det is 0.4 x 0.4 = 0.16 sq cm.
Full-time range; 1 s binning
Other quick-look light curves:
- 64 ms binning (zoomed)
- 16 ms binning (zoomed)
- 8 ms binning (zoomed)
- 2 ms binning (zoomed)
- SN=5 or 10 s binning (full-time range)
- Raw light curve
Spectra
- 64 ms binning (zoomed)
- 16 ms binning (zoomed)
- 8 ms binning (zoomed)
- 2 ms binning (zoomed)
- SN=5 or 10 s binning (full-time range)
- Raw light curve
Spectra
Notes:
- 1) The fitting includes the systematic errors.
- 2) When the burst includes telescope slew time periods, the fitting uses an average response file made from multiple 5-s response files through out the slew time plus single time preiod for the non-slew times, and weighted by the total counts in the corresponding time period using addrmf. An average response file is needed becuase a spectral fit using the pre-slew DRM will introduce some errors in both a spectral shape and a normalization if the PHA file contains a lot of the slew/post-slew time interval.
- 3) For fits to more complicated models (e.g. a power-law over a cutoff power-law), the BAT team has decided to require a chi-square improvement of more than 6 for each extra dof.
Time averaged spectrum fit using the average DRM
Power-law model
Time interval is from  -11.120 sec. to  196.104 sec.

Spectral model in power-law:
------------------------------------------------------------
Parameters  : value       lower 90%   higher 90%
Photon index: -1.66368     ( -0.0672598   0.0668765 )
Norm@50keV  : 3.43635E-03    ( -0.000130208   0.000129961 )
------------------------------------------------------------
#Fit statistic : Chi-Squared =          72.42 using 59 PHA bins.
# Reduced chi-squared =          1.271 for     57 degrees of freedom
# Null hypothesis probability =   8.186568e-02

Photon flux (15-150 keV)    in 207.2 sec: 0.450765 ( -0.017641  0.017681 ) ph/cm2/s
Energy fluence (15-150 keV)             : 6.61409e-06 ( -2.62982e-07  2.6371e-07 ) ergs/cm2
Cutoff power-law model
Time interval is from  -11.120 sec. to  196.104 sec.
Spectral model in the cutoff power-law:
------------------------------------------------------------
Parameters  : value       lower 90%   higher 90%
Photon index: -1.17271     ( -0.271234   0.289014 )
Epeak [keV] : 84.8842      ( -14.9248 42.4131 )
Norm@50keV  : 6.02431E-03    ( -0.00157162   0.00230349 )
------------------------------------------------------------
#Fit statistic : Chi-Squared =          62.38 using 59 PHA bins.
# Reduced chi-squared =          1.114 for     56 degrees of freedom
# Null hypothesis probability =   2.598445e-01

Photon flux (15-150 keV)    in 207.2 sec: 0.437483 ( -0.018918  0.018966 ) ph/cm2/s
Energy fluence (15-150 keV)             : 6.37221e-06 ( -2.94781e-07  2.94628e-07 ) ergs/cm2
1-s peak spectrum fit
Power-law model
Time interval is from    6.444 sec. to    7.444 sec.

Spectral model in power-law:
------------------------------------------------------------
Parameters  : value       lower 90%   higher 90%
Photon index: -1.70436     ( -0.203417   0.195068 )
Norm@50keV  : 2.32751E-02    ( -0.00306029   0.00300876 )
------------------------------------------------------------
#Fit statistic : Chi-Squared =          59.15 using 59 PHA bins.
# Reduced chi-squared =          1.038 for     57 degrees of freedom
# Null hypothesis probability =   3.970243e-01

Photon flux (15-150 keV)    in 1 sec: 3.09605 ( -0.36948  0.36963 ) ph/cm2/s
Energy fluence (15-150 keV)             : 2.15457e-07 ( -2.9394e-08  2.96976e-08 ) ergs/cm2
Cutoff power-law model
Time interval is from    6.444 sec. to    7.444 sec.
Spectral model in the cutoff power-law:
------------------------------------------------------------
Parameters  : value       lower 90%   higher 90%
Photon index: -1.29233     ( -0.393433   0.809307 )
Epeak [keV] : 81.5930      ( -35.5795 -81.593 )
Norm@50keV  : 3.87322E-02    ( -0.017842   0.0652818 )
------------------------------------------------------------
#Fit statistic : Chi-Squared =          58.13 using 59 PHA bins.
# Reduced chi-squared =          1.038 for     56 degrees of freedom
# Null hypothesis probability =   3.968406e-01

Photon flux (15-150 keV)    in 1 sec: 3.06803 ( -0.37287  0.37277 ) ph/cm2/s
Energy fluence (15-150 keV)             : 2.10271e-07 ( -3.11568e-08  3.11083e-08 ) ergs/cm2
Time-resolved spectra
Distribution
T90 vs. Hardness ratio plot
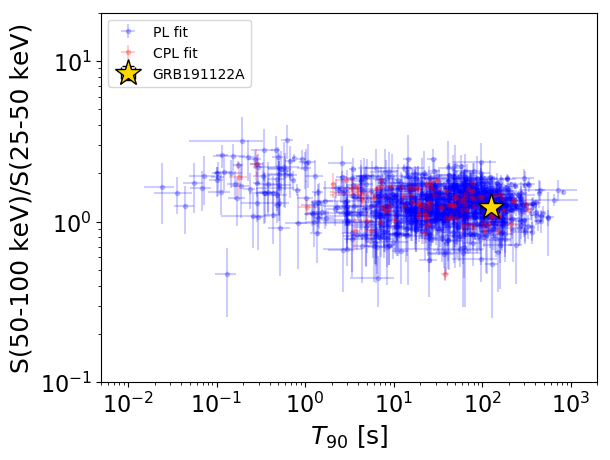
T90                                   = 125.736 sec.
Hardness ratio (energy fluence ratio) = 1.24331149921
S(15-50 keV) vs. S(50-150 keV) plot
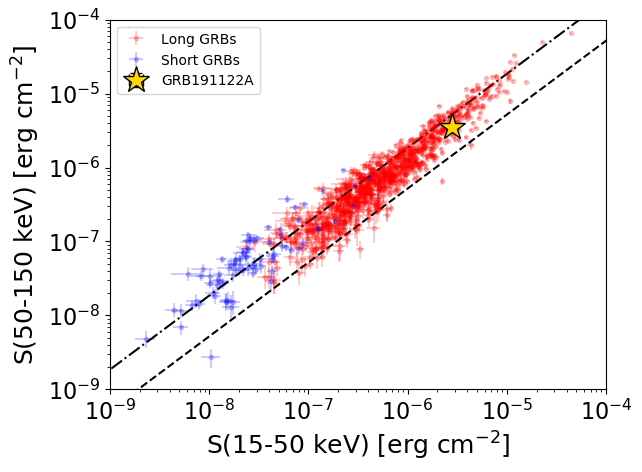
S(15-50 keV)  = 2.8059615e-06
S(50-150 keV) = 3.566281e-06
The dash-dotted line and the dashed line traces the fluences calculated from the Band function with Epeak = 15 and 150 keV, respectively. Both lines assume a canonical values of alpha = -1 and beta = -2.5.
Mask shadow pattern
IMX = -2.847396224615103E-01, IMY = -6.327479120229644E-01
Spacecraft aspect plot
Bright source in the pre-burst/pre-slew/post-slew images
Pre-burst image of 15-350 keV band
Time interval of the image:
-239.384000 -11.120000

# RAcent  DECcent POSerr Theta    Phi  PeakCts   SNR AngSep     Name
#  [deg]    [deg]    ['] [deg]  [deg]                   [']
 43.3130 -23.1435    2.6  39.0   93.2   4.0695   4.4 ------	UNKNOWN
116.4039 -50.5795    2.9  51.0 -175.0   2.4044   4.0 ------	UNKNOWN
123.4414 -46.2906    4.3  57.3 -173.9   3.2957   2.7 ------	UNKNOWN
307.5408 -37.1646    3.4  50.6  -39.4   3.0643   3.4 ------	UNKNOWN
213.8334 -77.0938    2.2  43.9 -116.5   4.9721   5.1 ------	UNKNOWN
Pre-slew background subtracted image of 15-350 keV band
Time interval of the image:
-11.120000 29.916610

# RAcent  DECcent POSerr Theta    Phi  PeakCts   SNR AngSep     Name
#  [deg]    [deg]    ['] [deg]  [deg]                   [']
 54.2902 -32.1761    0.4  34.8  114.2   7.7343  31.5 ------	UNKNOWN
353.6611 -11.1288    2.6  51.9   24.6   1.8707   4.5 ------	UNKNOWN
Post-slew image of 15-350 keV band
Time interval of the image:
84.116600 651.272100
660.616000 718.173100
720.616000 959.916610

# RAcent  DECcent POSerr Theta    Phi  PeakCts   SNR AngSep     Name
#  [deg]    [deg]    ['] [deg]  [deg]                   [']
 27.0636   0.9784    2.9  42.0   43.0   5.1010   4.0 ------	UNKNOWN
 78.7861  -3.5203    2.7  36.8  129.9   6.2569   4.3 ------	UNKNOWN
  0.6880  -6.9261    4.7  55.7   10.9   7.0778   2.5  417.6	UNKNOWN
357.5652  -9.4689    3.0  56.9    6.3  13.3751   3.9  586.5	UNKNOWN
356.3909 -11.9868    2.9  56.6    3.0  10.6276   4.0 ------	UNKNOWN
 15.0288 -26.4397    2.6  34.5   -4.7   3.3867   4.4 ------	UNKNOWN
  4.7458 -63.0880    3.1  43.6  -64.0  10.0016   3.7 ------	UNKNOWN