Analysis Summary
Notes:
- 1) No attempt has been made to eliminate the non-significant decimal places.
- 2) This batgrbproduct analysis is done using the HEASARC data.
- 3) This batgrbproduct analysis is using the flight position for the mask-weighting calculation.
======================================================================
BAT GRB EVENT DATA PROCESSING REPORT
Process Script Ver: batgrbproduct v2.46
Process Start Time: Wed Dec 11 18:41:23 EST 2019
Host Name: bat1
Current Working Dir: /local/data/bat1/alien/Swift_3rdBATcatalog/event/batevent_reproc/trigger939079
======================================================================
Trigger: 00939079 Segment: 000
BAT Trigger Time: 596198348.288 [s; MET]
Trigger Stop: 596198349.312 [s; MET]
UTC: 2019-11-23T10:38:44.318720 [includes UTCF correction]
Where From?: TDRSS position message
BAT
RA: 215.260938956595 Dec: 22.8416115021627 [deg; J2000]
Catalogged Source?: NO
Point Source?: YES
GRB Indicated?: YES [ by BAT flight software ]
Image S/N Ratio: 7.27
Image Trigger?: NO
Rate S/N Ratio: 12.1655250605964 [ if not an image trigger ]
Image S/N Ratio: 7.27
Analysis Position: [ source = BAT ]
RA: 215.260938956595 Dec: 22.8416115021627 [deg; J2000]
Refined Position: [ source = BAT pre-slew burst ]
RA: 215.292546007874 Dec: 22.8338454237002 [deg; J2000]
{ 14h 21m 10.2s , +22d 50' 01.8" }
+/- 2.15793976109161 [arcmin] (estimated 90% radius based on SNR)
+/- 0.762786298907505 [arcmin] (formal 1-sigma fit error)
SNR: 10.1372312903918
Angular difference between the analysis and refined position is 1.808807 arcmin
Partial Coding Fraction: 0.859375 [ including projection effects ]
Duration
T90: 284.81199991703 +/- 52.2317749194354
Measured from: -1.03199994564056
to: 283.77999997139 [s; relative to TRIGTIME]
T50: 147.699999928474 +/- 117.160109295019
Measured from: 9.21200001239777
to: 156.911999940872 [s; relative to TRIGTIME]
Fluence
Peak Flux (peak 1 second)
Measured from: 111.784000039101
to: 112.784000039101 [s; relative to TRIGTIME]
Total Fluence
Measured from: -3.04799997806549
to: 335.968000054359 [s; relative to TRIGTIME]
Band 1 Band 2 Band 3 Band 4
15-25 25-50 50-100 100-350 keV
Total 0.610025 0.906088 0.443038 0.139023
0.107184 0.110748 0.097098 0.087028 [error]
Peak 0.034228 0.063907 0.048251 0.012634
0.006425 0.006946 0.006421 0.005466 [error]
[ fluence units of on-axis counts / fully illuminated detector ]
======================================================================
====== Table of the duration information =============================
Value tstart tstop
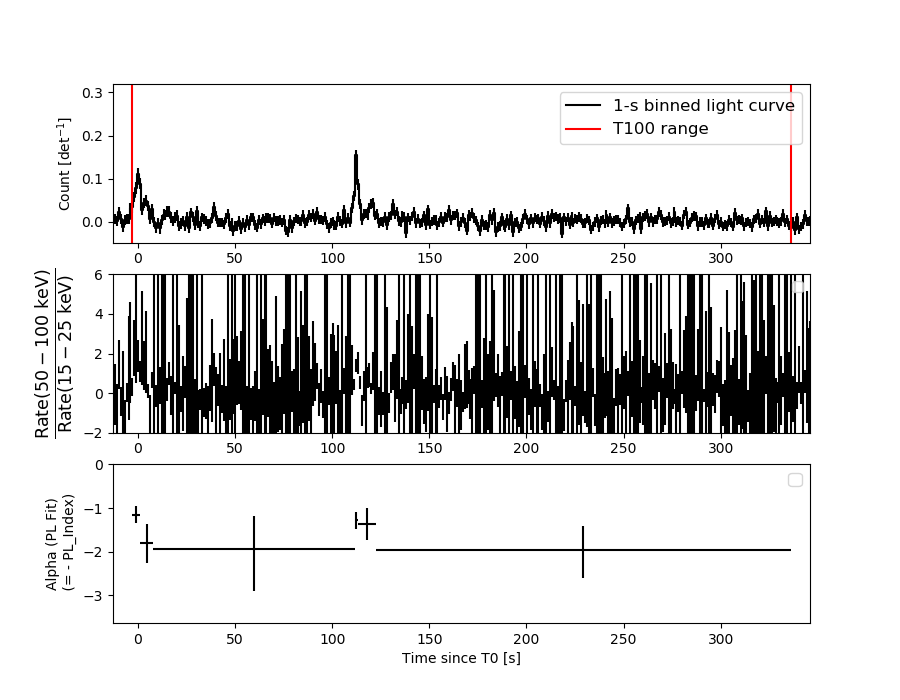
T100 339.016 -3.048 335.968
T90 284.812 -1.032 283.780
T50 147.700 9.212 156.912
Peak 1.000 111.784 112.784
====== Spectral Analysis Summary =====================================
Model : spectral model: simple power-law (PL) and cutoff power-law (CPL)
Ph_index : photon index: E^{Ph_index}
Ph_90err : 90% error of the photon index
Epeak : Epeak in keV
Epeak_90err: 90% error of Epeak
Norm : normalization at 50 keV in both the PL model and CPL model
Nomr_90err : 90% error of the normalization
chi2 : Chi-Squared
dof : degree of freedo
=== Time-averaged spectral analysis ===
(Best model with acceptable fit: PL)
Model Ph_index Ph_90err_low Ph_90err_hi Epeak Epeak_90err_low Epeak_90err_hi Norm Nomr_90err_low Norm_90err_hi chi2 dof
PL -1.691 -0.264 0.254 - - - 3.77e-04 -6.49e-05 6.34e-05 52.610 57
CPL -0.946 -0.587 1.782 57.876 -15.487 -57.876 1.04e-03 -1.04e-03 1.17e-02 51.480 56
=== 1-s peak spectral analysis ===
(Best model with acceptable fit: PL)
Model Ph_index Ph_90err_low Ph_90err_hi Epeak Epeak_90err_low Epeak_90err_hi Norm Nomr_90err_low Norm_90err_hi chi2 dof
PL -1.334 -0.213 0.213 - - - 1.01e-02 -1.31e-03 1.30e-03 59.830 57
CPL -0.907 -0.538 1.034 123.409 -61.869 -123.409 1.70e-02 -9.28e-03 4.16e-02 59.130 56
=== Fluence/Peak Flux Summary ===
Model Band1 Band2 Band3 Band4 Band5 Total
15-25 25-50 50-100 100-350 15-150 15-350 keV
Fluence PL 1.95e-07 3.19e-07 3.95e-07 9.69e-07 1.18e-06 1.88e-06 erg/cm2
90%_error_low -4.15e-08 -4.73e-08 -8.97e-08 -3.78e-07 -2.11e-07 -4.82e-07 erg/cm2
90%_error_hi 4.28e-08 4.73e-08 9.12e-08 5.17e-07 2.17e-07 5.96e-07 erg/cm2
Peak flux PL 3.56e-01 3.95e-01 3.14e-01 4.12e-01 1.22e+00 1.48e+00 ph/cm2/s
90%_error_low -7.44e-02 -5.37e-02 -5.02e-02 -1.20e-01 -1.54e-01 -1.97e-01 ph/cm2/s
90%_error_hi 7.85e-02 5.32e-02 4.97e-02 1.47e-01 1.54e-01 2.01e-01 ph/cm2/s
Fluence CPL 1.86e-07 3.52e-07 3.78e-07 2.61e-07 1.07e-06 1.18e-06 erg/cm2
90%_error_low -4.57e-08 -6.83e-08 -1.35e-07 -2.35e-07 -2.60e-07 -3.62e-07 erg/cm2
90%_error_hi 4.58e-08 7.65e-08 1.05e-07 8.32e-07 2.77e-07 9.15e-07 erg/cm2
Peak flux CPL 3.34e-01 4.15e-01 3.23e-01 2.41e-01 1.20e+00 1.31e+00 ph/cm2/s
90%_error_low -8.65e-02 -6.58e-02 -5.44e-02 -1.56e-01 -1.60e-01 -2.31e-01 ph/cm2/s
90%_error_hi 8.89e-02 6.97e-02 5.62e-02 2.12e-01 1.59e-01 2.81e-01 ph/cm2/s
======================================================================
Image
Pre-slew 15.0-350.0 keV image (Event data)
#   RAcent    DECcent   POSerr    Theta     Phi              Peak Cts       SNR   Name
  215.2925    22.8338   0.0188    17.5733  -124.5695         0.5719197     10.137 TRIG_00939079

Foreground time interval of the image:
 -3.048  16.613 (delta_t =  19.661 [sec])
Background time interval of the image:
-239.288  -3.048 (delta_t = 236.240 [sec])
Light Curves
Note: The mask-weighted lightcurves have units of either count/det or counts/sec/det, where a det is 0.4 x 0.4 = 0.16 sq cm.
Full-time range; 1 s binning
Other quick-look light curves:
- 64 ms binning (zoomed)
- 16 ms binning (zoomed)
- 8 ms binning (zoomed)
- 2 ms binning (zoomed)
- SN=5 or 10 s binning (full-time range)
- Raw light curve
Spectra
- 64 ms binning (zoomed)
- 16 ms binning (zoomed)
- 8 ms binning (zoomed)
- 2 ms binning (zoomed)
- SN=5 or 10 s binning (full-time range)
- Raw light curve
Spectra
Notes:
- 1) The fitting includes the systematic errors.
- 2) When the burst includes telescope slew time periods, the fitting uses an average response file made from multiple 5-s response files through out the slew time plus single time preiod for the non-slew times, and weighted by the total counts in the corresponding time period using addrmf. An average response file is needed becuase a spectral fit using the pre-slew DRM will introduce some errors in both a spectral shape and a normalization if the PHA file contains a lot of the slew/post-slew time interval.
- 3) For fits to more complicated models (e.g. a power-law over a cutoff power-law), the BAT team has decided to require a chi-square improvement of more than 6 for each extra dof.
Time averaged spectrum fit using the average DRM
Power-law model
Time interval is from   -3.048 sec. to  335.968 sec.

Spectral model in power-law:
------------------------------------------------------------
Parameters  : value       lower 90%   higher 90%
Photon index: -1.69125     ( -0.264389   0.254097 )
Norm@50keV  : 3.76634E-04    ( -6.49062e-05   6.34436e-05 )
------------------------------------------------------------
#Fit statistic : Chi-Squared =          52.61 using 59 PHA bins.
# Reduced chi-squared =         0.9230 for     57 degrees of freedom
# Null hypothesis probability =   6.401895e-01

Photon flux (15-150 keV)    in 339 sec: 4.98713E-02 ( -0.0073925  0.0073931 ) ph/cm2/s
Energy fluence (15-150 keV)             : 1.18315e-06 ( -2.11322e-07  2.17435e-07 ) ergs/cm2
Cutoff power-law model
Time interval is from   -3.048 sec. to  335.968 sec.
Spectral model in the cutoff power-law:
------------------------------------------------------------
Parameters  : value       lower 90%   higher 90%
Photon index: -0.945513     ( -0.587802   1.78143 )
Epeak [keV] : 57.8764      ( -15.4495 -57.8386 )
Norm@50keV  : 1.03562E-03    ( -0.00103767   0.0117425 )
------------------------------------------------------------
#Fit statistic : Chi-Squared =          51.48 using 59 PHA bins.
# Reduced chi-squared =         0.9193 for     56 degrees of freedom
# Null hypothesis probability =   6.464880e-01

Photon flux (15-150 keV)    in 339 sec: 4.85230E-02 ( -0.007741  0.0077128 ) ph/cm2/s
Energy fluence (15-150 keV)             : 1.07189e-06 ( -2.60236e-07  2.77105e-07 ) ergs/cm2
1-s peak spectrum fit
Power-law model
Time interval is from  111.784 sec. to  112.784 sec.

Spectral model in power-law:
------------------------------------------------------------
Parameters  : value       lower 90%   higher 90%
Photon index: -1.33358     ( -0.213255   0.21284 )
Norm@50keV  : 1.01393E-02    ( -0.0013108   0.001304 )
------------------------------------------------------------
#Fit statistic : Chi-Squared =          59.83 using 59 PHA bins.
# Reduced chi-squared =          1.050 for     57 degrees of freedom
# Null hypothesis probability =   3.733398e-01

Photon flux (15-150 keV)    in 1 sec: 1.21747 ( -0.15439  0.15445 ) ph/cm2/s
Energy fluence (15-150 keV)             : 9.941e-08 ( -1.45037e-08  1.47174e-08 ) ergs/cm2
Cutoff power-law model
Time interval is from  111.784 sec. to  112.784 sec.
Spectral model in the cutoff power-law:
------------------------------------------------------------
Parameters  : value       lower 90%   higher 90%
Photon index: -0.907416     ( -0.538347   1.03442 )
Epeak [keV] : 123.409      ( -61.8974 -123.437 )
Norm@50keV  : 1.70026E-02    ( -0.00927934   0.041582 )
------------------------------------------------------------
#Fit statistic : Chi-Squared =          59.13 using 59 PHA bins.
# Reduced chi-squared =          1.056 for     56 degrees of freedom
# Null hypothesis probability =   3.618381e-01

Photon flux (15-150 keV)    in 1 sec: 1.19925 ( -0.15966  0.15894 ) ph/cm2/s
Energy fluence (15-150 keV)             : 9.54597e-08 ( -1.68873e-08  1.66802e-08 ) ergs/cm2
Time-resolved spectra
Distribution
T90 vs. Hardness ratio plot
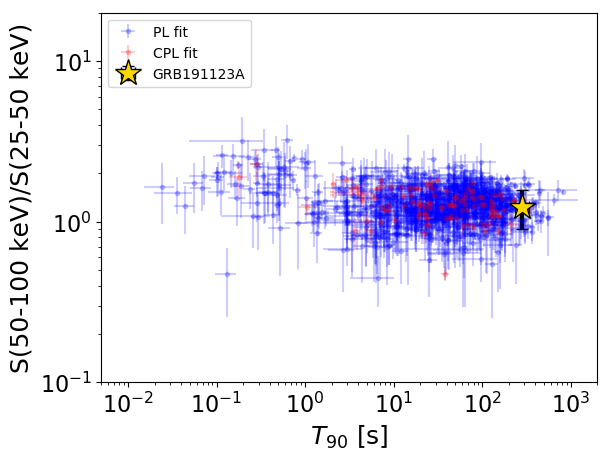
T90                                   = 284.812 sec.
Hardness ratio (energy fluence ratio) = 1.2386545985
S(15-50 keV) vs. S(50-150 keV) plot
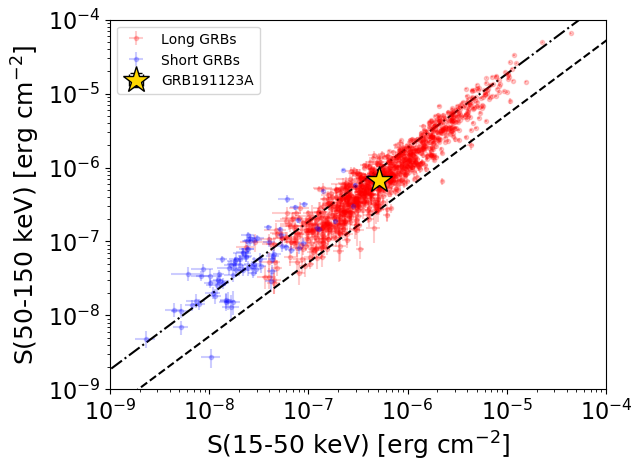
S(15-50 keV)  = 5.142685e-07
S(50-150 keV) = 6.689086e-07
The dash-dotted line and the dashed line traces the fluences calculated from the Band function with Epeak = 15 and 150 keV, respectively. Both lines assume a canonical values of alpha = -1 and beta = -2.5.
Mask shadow pattern
IMX = -1.797007330338441E-01, IMY = 2.607881449264923E-01
Spacecraft aspect plot
Bright source in the pre-burst/pre-slew/post-slew images
Pre-burst image of 15-350 keV band
Time interval of the image:
-239.288000 -3.048000

# RAcent  DECcent POSerr Theta    Phi  PeakCts   SNR AngSep     Name
#  [deg]    [deg]    ['] [deg]  [deg]                   [']
254.3053  35.2201    6.4  50.1 -156.2   1.2463   1.8   10.5	Her X-1
241.9393  69.8831    2.9  51.1  157.6   6.0402   4.0 ------	UNKNOWN
168.4745  13.8588    2.5  28.7   29.6   1.6743   4.6 ------	UNKNOWN
190.4028  -9.7581    2.7  36.2  -31.0   1.5002   4.2 ------	UNKNOWN
254.5405  31.2562    2.6  50.8 -151.2   3.2832   4.5 ------	UNKNOWN
212.6039 -14.6029    3.0  43.6  -64.1   4.4792   3.9 ------	UNKNOWN
249.5459  17.9912    2.2  49.7 -133.0   7.5901   5.2 ------	UNKNOWN
Pre-slew background subtracted image of 15-350 keV band
Time interval of the image:
-3.048000 16.612600

# RAcent  DECcent POSerr Theta    Phi  PeakCts   SNR AngSep     Name
#  [deg]    [deg]    ['] [deg]  [deg]                   [']
254.5987  35.5240    0.0  50.3 -156.7   0.1018   0.7   12.9	Her X-1
249.2607  69.4930    2.3  53.1  159.6   1.5900   4.9 ------	UNKNOWN
166.2955   9.4501    2.4  32.9   24.4   0.3382   4.7 ------	UNKNOWN
168.7248 -15.7146    2.6  49.6   -5.1   0.4925   4.4 ------	UNKNOWN
215.2926  22.8338    1.1  17.6 -124.6   0.5719  10.1 ------	UNKNOWN
Post-slew image of 15-350 keV band
Time interval of the image:
58.412590 962.853700

# RAcent  DECcent POSerr Theta    Phi  PeakCts   SNR AngSep     Name
#  [deg]    [deg]    ['] [deg]  [deg]                   [']
254.6370  35.3769   11.0  36.3 -179.2   1.0793   1.0    9.0	Her X-1
267.0744  53.2112    3.9  49.3  158.3  10.7267   3.0 ------	UNKNOWN
164.6854  -5.5459    2.7  57.0    6.4  15.9785   4.3 ------	UNKNOWN
176.1582 -15.6699    3.6  54.3  -11.7   5.3127   3.2 ------	UNKNOWN
218.7775   0.6415    3.3  22.5  -69.4   2.9276   3.5 ------	UNKNOWN
205.6240 -25.1515    2.4  48.9  -48.5  14.7432   4.8 ------	UNKNOWN
259.1557   0.8365    2.6  48.0 -129.1  15.2985   4.5 ------	UNKNOWN