Analysis Summary
Notes:
- 1) No attempt has been made to eliminate the non-significant decimal places.
- 2) This batgrbproduct analysis is done using the HEASARC data.
- 3) This batgrbproduct analysis is using the flight position for the mask-weighting calculation.
==========================================================================
           BAT GROUND-DETECTED GRB DATA PROCESSING REPORT
            (This burst occurred during telescope slew)
    Process Script Ver: batgrbproduct v2.46
    Process Start Time: Mon Dec  2 18:34:21 EST 2019
             Host Name: bat1
   Current Working Dir: /local/data/bat1/alien/Swift_3rdBATcatalog/event/batevent_reproc/GRB191130A
======================================================================

  Trigger: 03110538      Segment: 005

  BAT Trigger Time: 596811926.3760002
               UTC: 2019-11-30T13:05:02.316   [includes UTCF correction]
       Where From?: Ground analysis (best_duration.txt)
  NOTE: BAT trigger time for ground-detected burst during slew is the T100 start time.

  Analysis Position:   [ source = GCN ]
    RA: 133.07925219   Dec: 4.99580463  [deg; J2000]

  Refined Position:   [ source = BAT mosaic image ]
    RA: 133.07935975635   Dec: 4.99574603683784  [deg; J2000]
        { 08h 52m 19.0s , +04d 59' 44.7" }
        +/- 1.16224621055 [arcmin] (estimated 90% radius based on SNR)
    SNR: 24.54099359834793


  Angular difference between the analysis and refined position is 0.007328 arcmin

  Partial Coding Fraction: Unavailable because the burst occurred during slew.

  Duration
     T90: 17.5599999427795 +/- 2.87687051441905
        Measured from: 2.08
                   to: 19.64     [s; relative to TRIGTIME]
     T50: 6.00399994850159 +/- 1.28069497394174
        Measured from: 6.32
                   to: 12.324     [s; relative to TRIGTIME]


====== Table of the duration information =============================

        Value   tstart    tstop
T100   22.052    0.000   22.052
T90    17.560    2.080   19.640
T50     6.004    6.320   12.324
Peak    1.000    6.176    7.176


====== Spectral Analysis Summary =====================================

Model      : spectral model: simple power-law (PL) and cutoff power-law (CPL)
Ph_index   : photon index: E^{Ph_index}
Ph_90err   : 90% error of the photon index
Epeak      : Epeak in keV
Epeak_90err: 90% error of Epeak
Norm       : normalization at 50 keV in both the PL model and CPL model
Nomr_90err : 90% error of the normalization
chi2       : Chi-Squared
dof        : degree of freedo

=== Time-averaged spectral analysis ===
(Best model with acceptable fit: N/A)

Model Ph_index Ph_90err_low Ph_90err_hi  Epeak  Epeak_90err_low  Epeak_90err_hi  Norm       Nomr_90err_low    Norm_90err_hi    chi2    dof
PL      -1.954    -0.132      0.127       -           -               -         3.38e-03     -2.81e-04          2.77e-04      N/A        N/A
CPL     -1.428    -0.512      0.591       45.900     -15.394        73.691      6.74e-03     -3.24e-03          7.86e-03      N/A        N/A


=== 1-s peak spectral analysis ===
(Best model with acceptable fit: N/A)

Model Ph_index Ph_90err_low Ph_90err_hi  Epeak  Epeak_90err_low  Epeak_90err_hi  Norm       Nomr_90err_low    Norm_90err_hi    chi2    dof
PL      -1.865     -0.269     0.250       -           -               -         8.04e-03     -1.40e-03          1.35e-03      N/A        N/A
CPL     -1.818     -0.797     0.988      167.711      N/A           N/A         8.55e-03        N/A               N/A         N/A        N/A


=== Fluence/Peak Flux Summary ===

              Model    Band1     Band2     Band3     Band4     Band5     Total
                       15-25     25-50    50-100    100-350    15-150    15-350    keV
Fluence         PL   1.46e-07  2.04e-07  2.10e-07  3.97e-07  6.86e-07  9.57e-07   erg/cm2
      90%_error_low -1.44e-08 -1.36e-08 -2.40e-08 -8.42e-08 -5.46e-08 -1.11e-07   erg/cm2
      90%_error_hi   1.47e-08  1.36e-08  2.43e-08  9.87e-08  5.54e-08  1.22e-07   erg/cm2
Peak flux       PL   4.70e-01  3.82e-01  2.10e-01  1.69e-01  1.14e+00  1.23e+00   ph/cm2/s
      90%_error_low -9.18e-02 -5.21e-02 -4.76e-02 -6.41e-02 -1.55e-01 -1.72e-01   ph/cm2/s
      90%_error_hi   9.48e-02  5.20e-02  4.81e-02  8.41e-02  1.55e-01  1.74e-01   ph/cm2/s

Fluence        CPL   1.39e-07  2.16e-07  2.05e-07  1.61e-07  6.47e-07  7.21e-07   erg/cm2
      90%_error_low -1.63e-08 -1.80e-08 -2.78e-08 -9.02e-08 -6.42e-08 -1.14e-07   erg/cm2
      90%_error_hi   1.64e-08  1.85e-08  2.67e-08  2.23e-07  6.62e-08  2.31e-07   erg/cm2
Peak flux      CPL   4.78e-01  3.71e-01  2.00e-01  1.79e-01  1.12e+00  1.22e+00   ph/cm2/s
      90%_error_low -1.08e-01 -8.46e-02 -3.88e-02 -1.79e-01 -2.50e-01 -2.66e-01   ph/cm2/s
      90%_error_hi   9.17e-02  5.53e-02  2.54e-02  7.16e-02  1.69e-01  1.81e-01   ph/cm2/s

======================================================================
Image
Note1: The mosaic image is made with timebin = 0.1 s; energybin = 15-350 keV
Note2: The mosaic image uses Galactic coordinate.
#RAcent DECcent POSerr Theta  Phi  Peak_Cts  SNR Name
133.079 4.996 0.003 40.302 -39.248 0.054 24.541 UNKNOWN

Image time interval: -1.376 to 18.624 [sec]
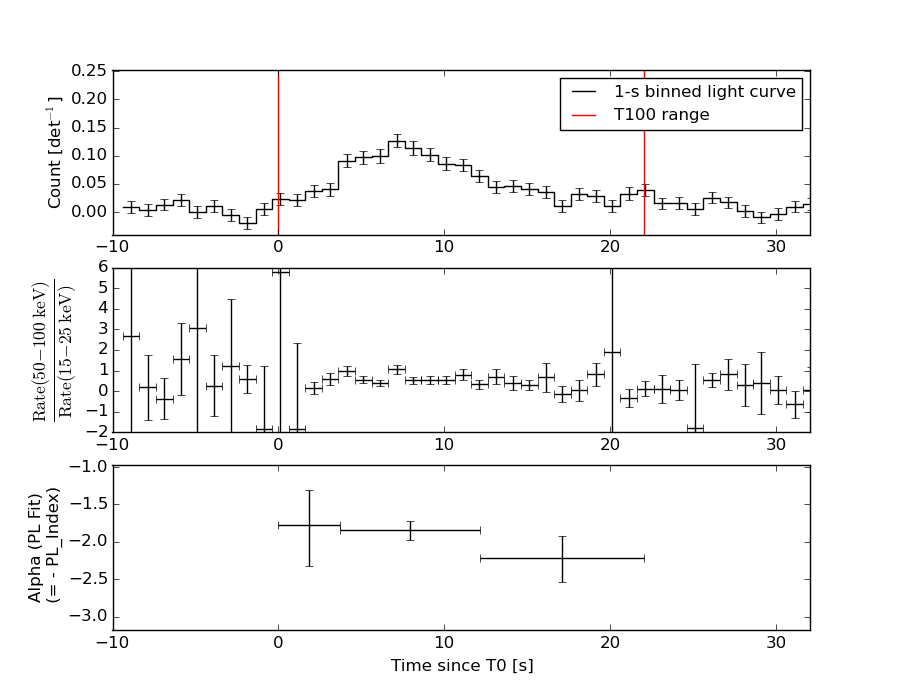
Light Curves
Note: The mask-weighted lightcurves have units of either count/det or counts/sec/det, where a det is 0.4 x 0.4 = 0.16 sq cm.
Best duration plot
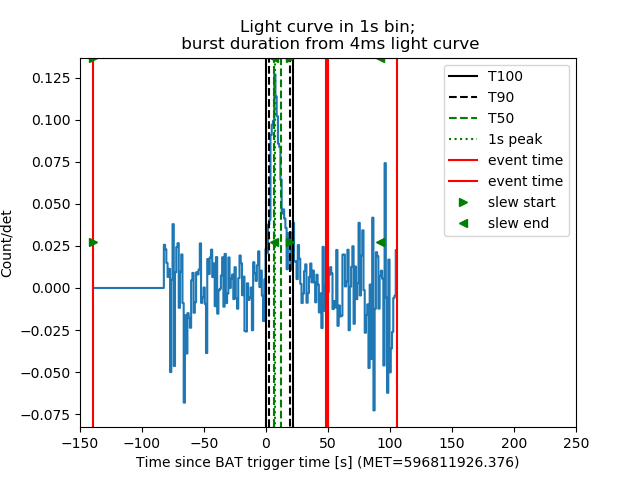
Full-time range; 1 s binning
Other quick-look light curves:
Spectra
Notes:
- 1) The fitting includes the systematic errors.
- 2) When the burst includes telescope slew time periods, the fitting uses an average response file made from multiple 5-s response files through out the slew time plus single time preiod for the non-slew times, and weighted by the total counts in the corresponding time period using addrmf. An average response file is needed becuase a spectral fit using the pre-slew DRM will introduce some errors in both a spectral shape and a normalization if the PHA file contains a lot of the slew/post-slew time interval.
- 3) For fits to more complicated models (e.g. a power-law over a cutoff power-law), the BAT team has decided to require a chi-square improvement of more than 6 for each extra dof.
Time averaged spectrum fit using the average DRM
Power-law model
Time interval is from   -0.000 sec. to   22.052 sec.

Spectral model in power-law:
------------------------------------------------------------
Parameters  : value       lower 90%   higher 90%
Photon index: -1.95436     ( -0.131518   0.127478 )
Norm@50keV  : 3.38070E-03    ( -0.000281334   0.000277328 )
------------------------------------------------------------
#Fit statistic : Chi-Squared =          45.02 using 59 PHA bins.
# Reduced chi-squared =         0.7899 for     57 degrees of freedom
# Null hypothesis probability =   8.744701e-01

Photon flux (15-150 keV)    in 22.05 sec: 0.496788 ( -0.033502  0.033519 ) ph/cm2/s
Energy fluence (15-150 keV)             : 6.86211e-07 ( -5.45729e-08  5.54207e-08 ) ergs/cm2
Cutoff power-law model
Time interval is from   -0.000 sec. to   22.052 sec.
Spectral model in the cutoff power-law:
------------------------------------------------------------
Parameters  : value       lower 90%   higher 90%
Photon index: -1.42773     ( -0.512311   0.590938 )
Epeak [keV] : 45.9004      ( -15.3937 73.6906 )
Norm@50keV  : 6.74348E-03    ( -0.0032373   0.00785628 )
------------------------------------------------------------
#Fit statistic : Chi-Squared =          41.93 using 59 PHA bins.
# Reduced chi-squared =         0.7488 for     56 degrees of freedom
# Null hypothesis probability =   9.186729e-01

Photon flux (15-150 keV)    in 22.05 sec: 0.484359 ( -0.0355  0.035513 ) ph/cm2/s
Energy fluence (15-150 keV)             : 6.4711e-07 ( -6.42444e-08  6.62003e-08 ) ergs/cm2
1-s peak spectrum fit
Power-law model

Time interval is from    6.176 sec. to    7.176 sec.

Spectral model in power-law:
------------------------------------------------------------
Parameters  : value       lower 90%   higher 90%
Photon index: -1.86494     ( -0.26887   0.250394 )
Norm@50keV  : 8.04000E-03    ( -0.00140397   0.00135459 )
------------------------------------------------------------
#Fit statistic : Chi-Squared =          45.64 using 59 PHA bins.
# Reduced chi-squared =         0.8006 for     57 degrees of freedom
# Null hypothesis probability =   8.601656e-01

Photon flux (15-150 keV)    in 1 sec: 1.13710 ( -0.154913  0.15491 ) ph/cm2/s
Energy fluence (15-150 keV)             : 7.39265e-08 ( -1.25489e-08  1.28895e-08 ) ergs/cm2
Cutoff power-law model
Time interval is from    6.176 sec. to    7.176 sec.
Spectral model in the cutoff power-law:
------------------------------------------------------------
Parameters  : value       lower 90%   higher 90%
Photon index: -1.81801     ( -0.796882   0.988402 )
Epeak [keV] : 167.711      (   )
Norm@50keV  : 8.55296E-03    (     )
------------------------------------------------------------
#Fit statistic : Chi-Squared =          45.63 using 59 PHA bins.
# Reduced chi-squared =         0.8148 for     56 degrees of freedom
# Null hypothesis probability =   8.374653e-01

Photon flux (15-150 keV)    in 1 sec: 1.12072 ( -0.249937  0.16911 ) ph/cm2/s
Energy fluence (15-150 keV)             : 7.35631e-08 ( -1.41134e-08  1.27685e-08 ) ergs/cm2
Time-resolved spectra
Distribution
T90 vs. Hardness ratio plot
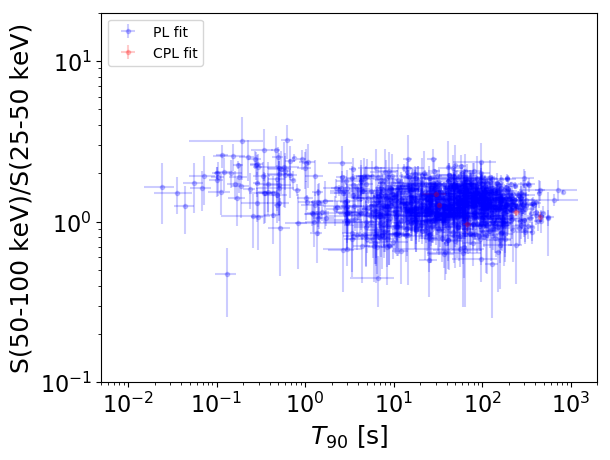
T90                                   = N/A sec.
Hardness ratio (energy fluence ratio) = N/A
S(15-50 keV) vs. S(50-150 keV) plot
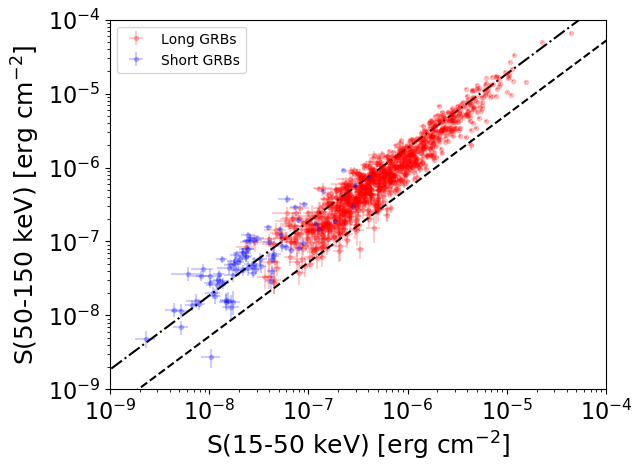
S(15-50 keV)  = N/A
S(50-150 keV) = N/A
The dash-dotted line and the dashed line traces the fluences calculated from the Band function with Epeak = 15 and 150 keV, respectively. Both lines assume a canonical values of alpha = -1 and beta = -2.5.
Mask shadow pattern
Mask shadow pattern unavailable because this burst occurs during telescope slews.Spacecraft aspect plot