Analysis Summary
Notes:
- 1) No attempt has been made to eliminate the non-significant decimal places.
- 2) This batgrbproduct analysis is done using the HEASARC data.
- 3) This batgrbproduct analysis is using the flight position for the mask-weighting calculation.
======================================================================
                  BAT GRB EVENT DATA PROCESSING REPORT
    Process Script Ver: batgrbproduct v2.47
    Process Start Time: Mon May 18 15:21:56 EDT 2020
             Host Name: bat1
   Current Working Dir: /local/data/bat1/alien/Swift_3rdBATcatalog/event/batevent_reproc/trigger944091
======================================================================

  Trigger: 00944091      Segment: 000

  BAT Trigger Time: 597902808   [s; MET]
      Trigger Stop: 597902872   [s; MET]
               UTC: 2019-12-13T04:06:23.920500    [includes UTCF correction]
       Where From?: TDRSS position message

  BAT
    RA: 224.506862496787   Dec: -9.72629906539117  [deg; J2000]

     Catalogged Source?: NO
     Point Source?:      YES
     GRB Indicated?:     YES    [ by BAT flight software ]
     Image S/N Ratio:    11.12
     Image Trigger?:     YES
     Rate S/N Ratio:     0  [ if not an image trigger ]
     Image S/N Ratio:    11.12

  Analysis Position:   [ source = BAT ]
    RA: 224.506862496787   Dec: -9.72629906539117  [deg; J2000]

  Refined Position:   [ source = BAT pre-slew burst ]
    RA: 224.530746546275   Dec: -9.74827388942352  [deg; J2000]
        { 14h 58m 07.4s , -09d 44' 53.8" }
         +/- 2.19045838130391 [arcmin] (estimated 90% radius based on SNR)
         +/- 1.17542240819362 [arcmin] (formal 1-sigma fit error)
    SNR: 9.92292708211085

  Angular difference between the analysis and refined position is 1.932170 arcmin

  Partial Coding Fraction: 0.5625    [ including projection effects ]

  Duration
     T90: 118.991999983788 +/- 18.2649067514448
        Measured from: -19.0240000486374
                   to: 99.9679999351501     [s; relative to TRIGTIME]
     T50: 66.7519999742508 +/- 12.298222875383
        Measured from: 6.82799994945526
                   to: 73.5799999237061     [s; relative to TRIGTIME]


  Fluence
     Peak Flux  (peak 1 second)
        Measured from: 99.9479999542236
                   to: 100.947999954224     [s; relative to TRIGTIME]
     Total Fluence
        Measured from: -33.5240000486374
                   to: 111.067999958992     [s; relative to TRIGTIME]

             Band 1     Band 2     Band 3     Band 4
              15-25      25-50     50-100    100-350     keV
 Total     0.899593   1.432753   0.806227   0.381427
           0.101456   0.105654   0.093635   0.084372 [error]
 Peak      0.014885   0.026602   0.029648   0.009012
           0.008693   0.008897   0.008145   0.006883 [error]

     [ fluence units of on-axis counts / fully illuminated detector ]

======================================================================


====== Table of the duration information =============================

        Value   tstart    tstop
T100  144.592  -33.524  111.068
T90   118.992  -19.024   99.968
T50    66.752    6.828   73.580
Peak    1.000   99.948  100.948


====== Spectral Analysis Summary =====================================

Model      : spectral model: simple power-law (PL) and cutoff power-law (CPL)
Ph_index   : photon index: E^{Ph_index}
Ph_90err   : 90% error of the photon index
Epeak      : Epeak in keV
Epeak_90err: 90% error of Epeak
Norm       : normalization at 50 keV in both the PL model and CPL model
Nomr_90err : 90% error of the normalization
chi2       : Chi-Squared
dof        : degree of freedo

=== Time-averaged spectral analysis ===
(Best model with acceptable fit: N/A)

Model Ph_index Ph_90err_low Ph_90err_hi  Epeak  Epeak_90err_low  Epeak_90err_hi  Norm       Nomr_90err_low    Norm_90err_hi    chi2    dof
PL      -1.494    -0.166      0.164       -           -               -         1.57e-03     -1.46e-04          1.45e-04      79.860   57
CPL     -1.488    -0.620     -0.492     9998.900      N/A           N/A         1.57e-03        N/A               N/A         79.870   56


=== 1-s peak spectral analysis ===
(Best model with acceptable fit: PL)

Model Ph_index Ph_90err_low Ph_90err_hi  Epeak  Epeak_90err_low  Epeak_90err_hi  Norm       Nomr_90err_low    Norm_90err_hi    chi2    dof
PL      -1.379     -0.586     0.584       -           -               -         4.40e-03     -1.70e-03          1.69e-03      49.320   57
CPL      1.625     -2.788    -1.625       62.632     -17.564       110.620      1.23e-01     -1.23e-01          2.36e+02      45.890   56


=== Fluence/Peak Flux Summary ===

              Model    Band1     Band2     Band3     Band4     Band5     Total
                       15-25     25-50    50-100    100-350    15-150    15-350    keV
Fluence         PL   2.88e-07  5.31e-07  7.54e-07  2.26e-06  2.15e-06  3.83e-06   erg/cm2
      90%_error_low -4.43e-08 -5.00e-08 -9.32e-08 -5.50e-07 -2.21e-07 -6.31e-07   erg/cm2
      90%_error_hi   4.60e-08  4.96e-08  9.27e-08  6.64e-07  2.24e-07  7.23e-07   erg/cm2
Peak flux       PL   1.62e-01  1.74e-01  1.34e-01  1.68e-01  5.33e-01  6.38e-01   ph/cm2/s
      90%_error_low -8.95e-02 -7.26e-02 -5.91e-02 -1.08e-01 -2.07e-01 -2.47e-01   ph/cm2/s
      90%_error_hi   1.07e-01  7.18e-02  5.91e-02  1.80e-01  2.09e-01  2.51e-01   ph/cm2/s

Fluence        CPL   2.91e-07  5.27e-07  7.49e-07  2.38e-06  2.18e-06  3.72e-06   erg/cm2
      90%_error_low -5.31e-08 -4.58e-08 -8.80e-08 -1.26e-06 -2.50e-07 -1.06e-06   erg/cm2
      90%_error_hi   4.84e-08  5.63e-08  9.80e-08  1.96e-07  1.95e-07  8.04e-07   erg/cm2
Peak flux      CPL   8.30e-02  2.15e-01  1.72e-01  2.53e-02  4.94e-01  4.94e-01   ph/cm2/s
      90%_error_low -8.30e-02 -1.33e-01 -8.17e-02 -2.53e-02 -2.11e-01 -2.10e-01   ph/cm2/s
      90%_error_hi   1.27e-01  9.85e-02  8.93e-02  1.19e-01  2.10e-01  2.21e-01   ph/cm2/s

======================================================================
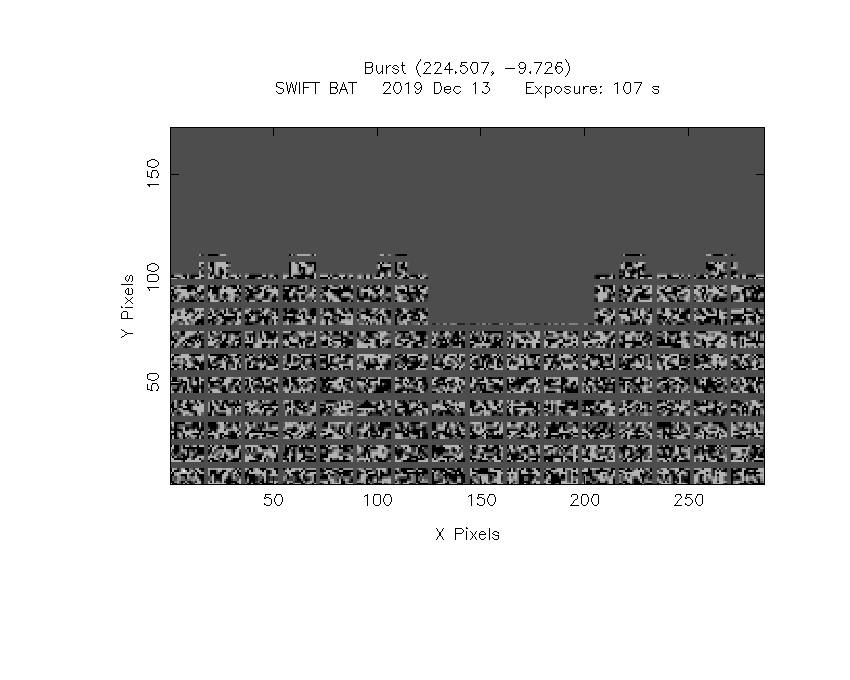
Image
Pre-slew 15.0-350.0 keV image (Event data)
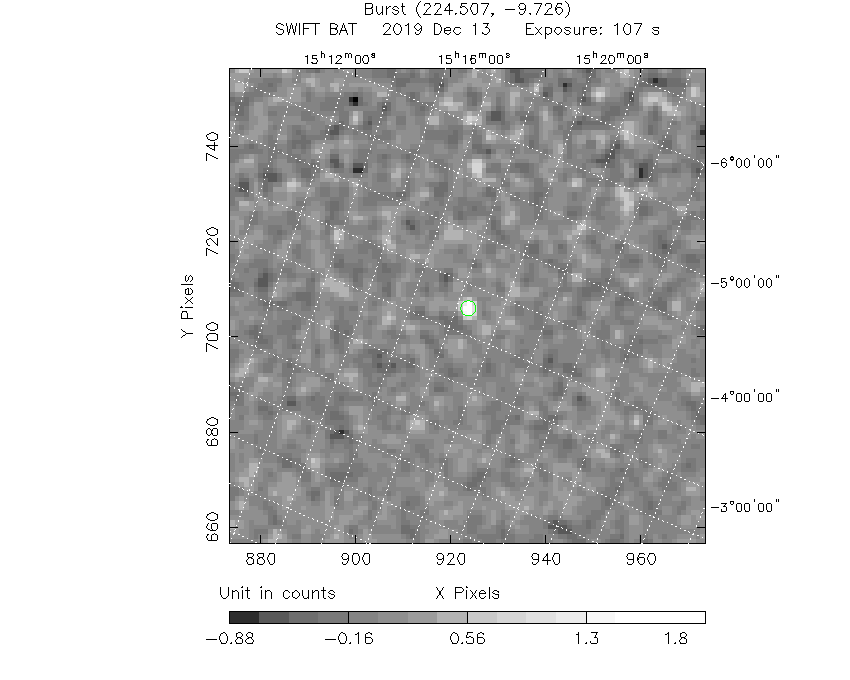
#   RAcent    DECcent   POSerr    Theta     Phi              Peak Cts       SNR   Name
  224.5307    -9.7483   0.0193    26.1388  -100.8609         2.0500788      9.923 TRIG_00944091

Foreground time interval of the image:
-33.524  73.901 (delta_t = 107.425 [sec])
Background time interval of the image:
-203.699 -33.524 (delta_t = 170.175 [sec])
Light Curves
Note: The mask-weighted lightcurves have units of either count/det or counts/sec/det, where a det is 0.4 x 0.4 = 0.16 sq cm.
Full-time range; 1 s binning
Other quick-look light curves:
- 64 ms binning (zoomed)
- 16 ms binning (zoomed)
- 8 ms binning (zoomed)
- 2 ms binning (zoomed)
- SN=5 or 10 s binning (full-time range)
- Raw light curve
Spectra
- 64 ms binning (zoomed)
- 16 ms binning (zoomed)
- 8 ms binning (zoomed)
- 2 ms binning (zoomed)
- SN=5 or 10 s binning (full-time range)
- Raw light curve
Spectra
Notes:
- 1) The fitting includes the systematic errors.
- 2) When the burst includes telescope slew time periods, the fitting uses an average response file made from multiple 5-s response files through out the slew time plus single time preiod for the non-slew times, and weighted by the total counts in the corresponding time period using addrmf. An average response file is needed becuase a spectral fit using the pre-slew DRM will introduce some errors in both a spectral shape and a normalization if the PHA file contains a lot of the slew/post-slew time interval.
- 3) For fits to more complicated models (e.g. a power-law over a cutoff power-law), the BAT team has decided to require a chi-square improvement of more than 6 for each extra dof.
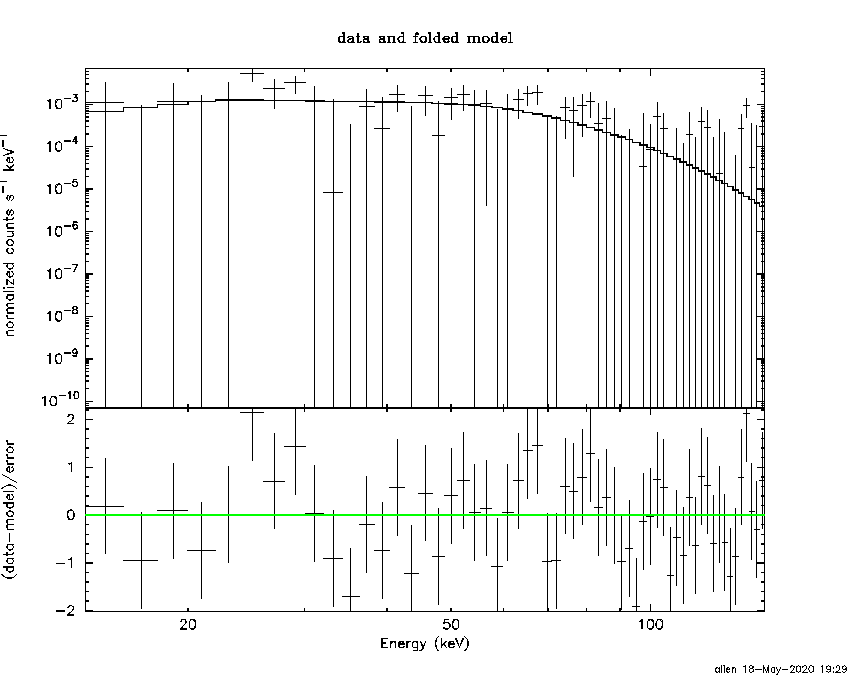
Time averaged spectrum fit using the average DRM
Power-law model
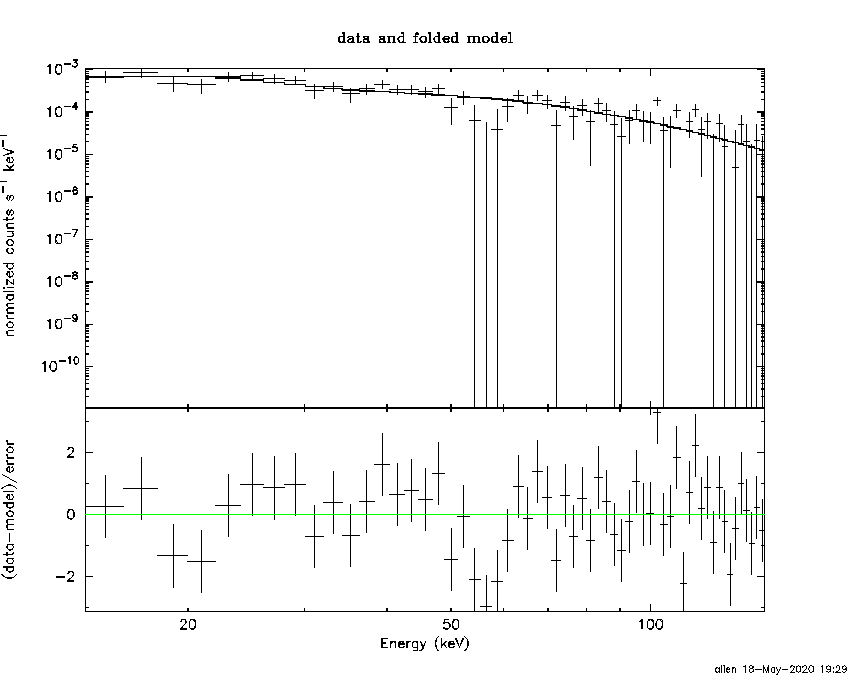
Time interval is from  -33.524 sec. to  111.068 sec.
XSPEC12>exit
 XSPEC: quit


Photon index: -1.49396     ( -0.165702   0.164447 )
------------------------------------------------------------
Parameters  : value       lower 90%   higher 90%
Photon index: 1.49396     ( -0.164447   0.165702 )
Norm@50keV  : 1.56852E-03    ( -0.000145789   0.000144761 )
------------------------------------------------------------

Photon flux (15-150 keV)    in 144.6 sec: 0.195501 ( -0.017807  0.017836 ) ph/cm2/s
Energy fluence (15-150 keV)             : 2.15402e-06 ( -2.20901e-07  2.23578e-07 ) ergs/cm2
Cutoff power-law model
Time interval is from  -33.524 sec. to  111.068 sec.
 XSPEC: quit


Photon index: -2.07942     ( -0.028768   0.0988803 )
------------------------------------------------------------
Parameters  : value       lower 90%   higher 90%
Photon index: 2.07942     ( -0.0988803   0.028768 )
Epeak [keV] : 30.6651      (   )
Norm@50keV  : 7.37021E-04    (     )
------------------------------------------------------------

Photon flux (15-150 keV)    in 144.6 sec: 0.196248 ( -0.021014  0.019296 ) ph/cm2/s
Energy fluence (15-150 keV)             : 2.17911e-06 ( -2.49503e-07  1.94934e-07 ) ergs/cm2
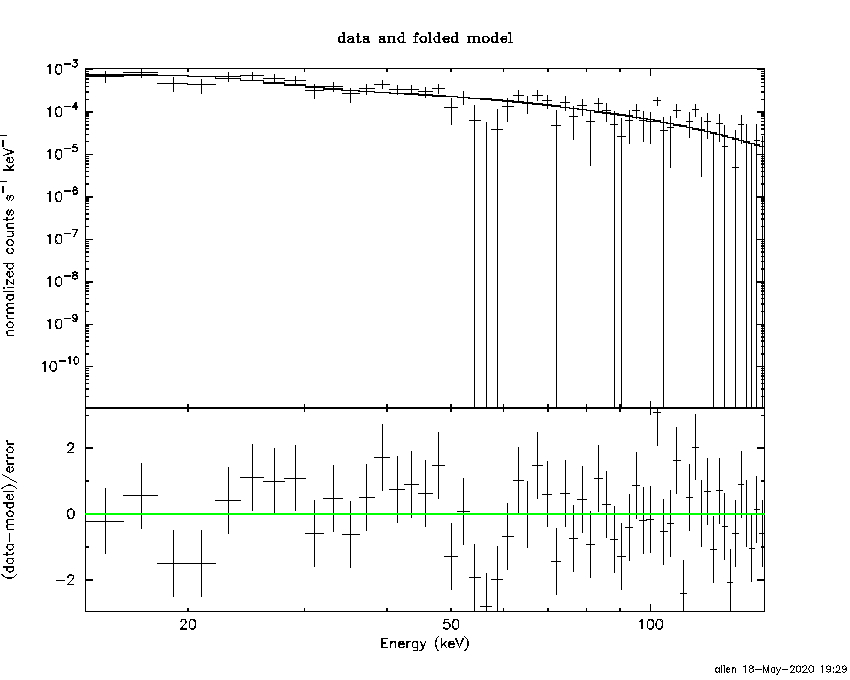
1-s peak spectrum fit
Power-law model
Time interval is from   99.948 sec. to  100.948 sec.
XSPEC12>exit
 XSPEC: quit


Photon index: -1.37937     ( -0.583193   0.586328 )
------------------------------------------------------------
Parameters  : value       lower 90%   higher 90%
Photon index: 1.37937     ( -0.586328   0.583193 )
Norm@50keV  : 4.39897E-03    ( -0.00169454   0.00168822 )
------------------------------------------------------------

Photon flux (15-150 keV)    in 1 sec: 0.533408 ( -0.206793  0.208709 ) ph/cm2/s
Energy fluence (15-150 keV)             : 4.26707e-08 ( -1.73334e-08  1.78286e-08 ) ergs/cm2
Cutoff power-law model
Time interval is from   99.948 sec. to  100.948 sec.
 XSPEC: quit


Photon index: 1.62454     ( -2.92284   -1.75889 )
------------------------------------------------------------
Parameters  : value       lower 90%   higher 90%
Photon index: -1.62454     ( 1.75889   2.92284 )
Epeak [keV] : 62.6316      ( -17.339 110.846 )
Norm@50keV  : 0.123279    ( -0.141121   235.564 )
------------------------------------------------------------

Photon flux (15-150 keV)    in 1 sec: 0.493965 ( -0.211322  0.210055 ) ph/cm2/s
Energy fluence (15-150 keV)             : 3.84397e-08 ( -1.50605e-08  1.72032e-08 ) ergs/cm2
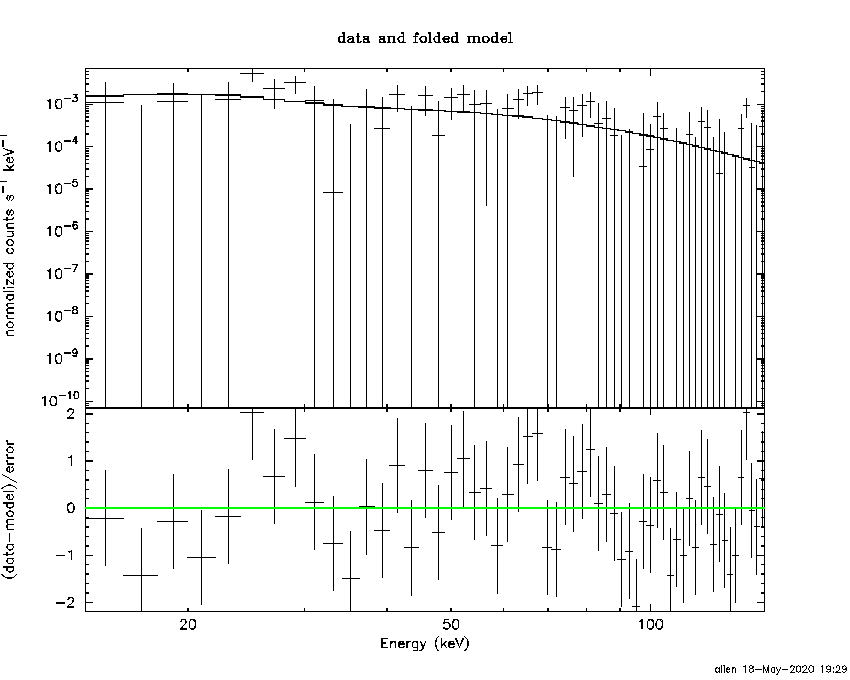
Time-resolved spectra
Distribution
T90 vs. Hardness ratio plot
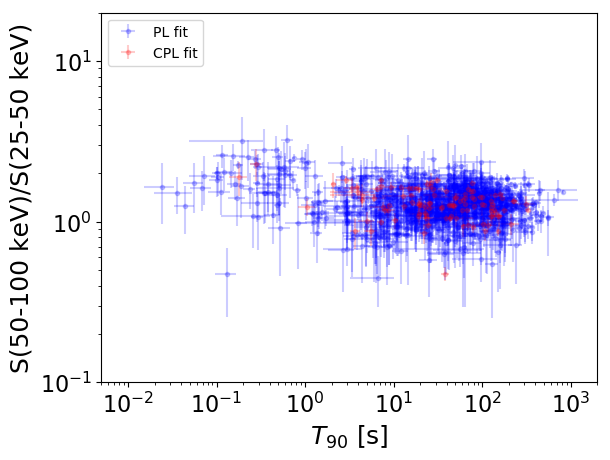
T90                                   = N/A sec.
Hardness ratio (energy fluence ratio) = N/A
S(15-50 keV) vs. S(50-150 keV) plot
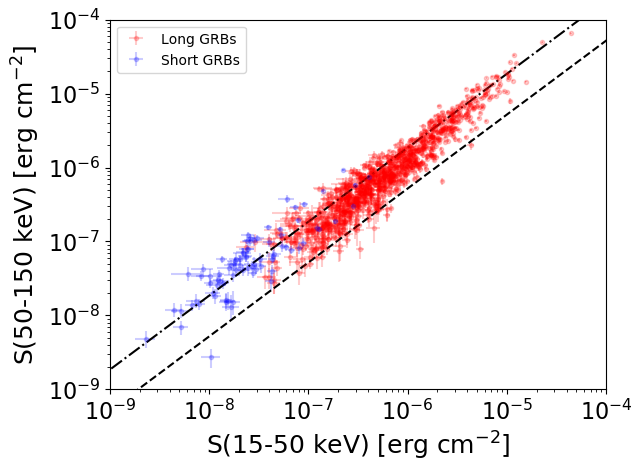
S(15-50 keV)  = N/A
S(50-150 keV) = N/A
The dash-dotted line and the dashed line traces the fluences calculated from the Band function with Epeak = 15 and 150 keV, respectively. Both lines assume a canonical values of alpha = -1 and beta = -2.5.
Mask shadow pattern
IMX = -9.246658166793836E-02, IMY = 4.819441498251124E-01
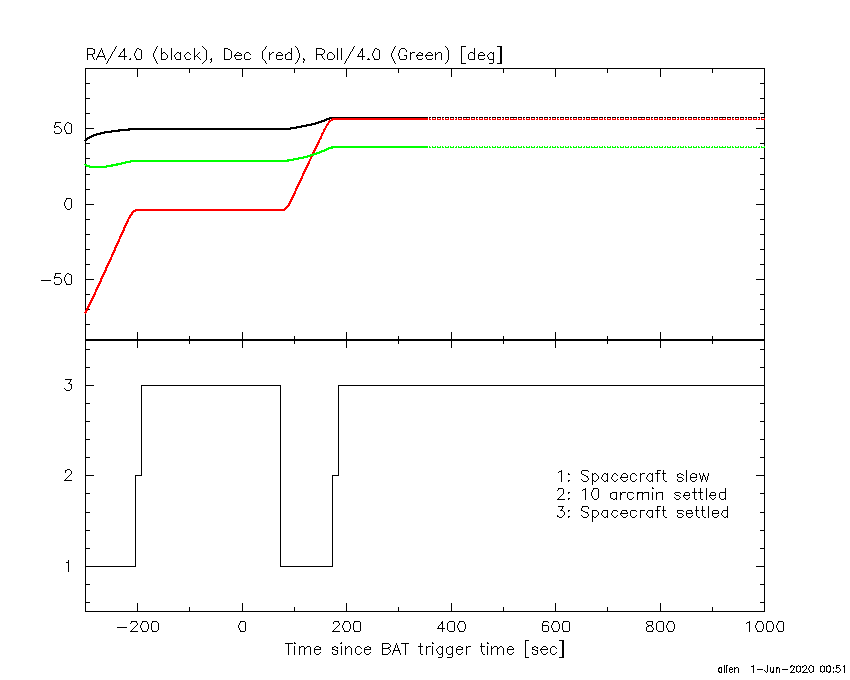
Spacecraft aspect plot
Bright source in the pre-burst/pre-slew/post-slew images
Pre-burst image of 15-350 keV band
Time interval of the image:
-203.699420 -33.524000

# RAcent  DECcent POSerr Theta    Phi  PeakCts   SNR AngSep     Name
#  [deg]    [deg]    ['] [deg]  [deg]                   [']
186.9221 -62.7759    6.1  59.4  -18.5  -2.7296  -1.9    7.3	GX 301-2
199.5689  -9.9495    2.8   5.9  -31.9   0.9345   4.2 ------	UNKNOWN
232.8370  -3.3101    2.3  34.0 -114.9   1.6476   5.0 ------	UNKNOWN
208.3000 -59.9422    2.1  56.4  -30.5   6.6948   5.5 ------	UNKNOWN
231.3879 -35.6936    3.2  43.6  -64.1   3.0321   3.6 ------	UNKNOWN
242.9259  -0.3279    2.6  44.2 -118.5   3.7224   4.5 ------	UNKNOWN
239.4837 -13.7275    3.3  41.3  -98.5   3.0916   3.5 ------	UNKNOWN
Pre-slew background subtracted image of 15-350 keV band
Time interval of the image:
-33.524000 73.900610

# RAcent  DECcent POSerr Theta    Phi  PeakCts   SNR AngSep     Name
#  [deg]    [deg]    ['] [deg]  [deg]                   [']
186.8932 -62.7882   43.8  59.4  -18.5   0.2710   0.3    6.6	GX 301-2
177.4525  22.3858    2.1  33.7  117.8   1.6958   5.6 ------	UNKNOWN
224.5308  -9.7482    1.2  26.1 -100.9   2.0502   9.9 ------	UNKNOWN
Post-slew image of 15-350 keV band
Time interval of the image:
173.900600 653.734000
661.000000 718.028700
721.000000 963.135600

# RAcent  DECcent POSerr Theta    Phi  PeakCts   SNR AngSep     Name
#  [deg]    [deg]    ['] [deg]  [deg]                   [']
254.4537  35.3430    1.3  27.2 -110.9   6.7350   9.2    0.2	Her X-1
299.6421  35.2985   12.8  50.9 -157.7   1.4607   0.9    6.3	Cyg X-1
308.1632  40.9882    8.0  51.3 -169.0   2.8783   1.4    3.2	Cyg X-3
179.9329  14.9147    2.5  55.6    1.5  13.2279   4.7 ------	UNKNOWN
207.2060  44.3843    2.8  18.2   -2.6   2.5157   4.1 ------	UNKNOWN
181.7311  12.3233    3.8  57.0   -1.8  11.1440   3.1 ------	UNKNOWN
309.4405  38.6339    2.6  53.7 -167.9   8.3676   4.4 ------	UNKNOWN
203.6288  11.8035    2.5  48.7  -26.8   5.5365   4.6 ------	UNKNOWN
278.1022  23.9444    2.6  48.0 -129.1  10.6878   4.4 ------	UNKNOWN