Analysis Summary
Notes:
- 1) No attempt has been made to eliminate the non-significant decimal places.
- 2) This batgrbproduct analysis is done using the HEASARC data.
- 3) This batgrbproduct analysis is using the flight position for the mask-weighting calculation.
======================================================================
BAT GRB EVENT DATA PROCESSING REPORT
Process Script Ver: batgrbproduct v2.47
Process Start Time: Mon May 18 15:20:18 EDT 2020
Host Name: bat1
Current Working Dir: /local/data/bat1/alien/Swift_3rdBATcatalog/event/batevent_reproc/trigger944916
======================================================================
Trigger: 00944916 Segment: 000
BAT Trigger Time: 598329787.968 [s; MET]
Trigger Stop: 598329788.992 [s; MET]
UTC: 2019-12-18T02:42:43.860860 [includes UTCF correction]
Where From?: TDRSS position message
BAT
RA: 301.077639808073 Dec: -40.2740100040986 [deg; J2000]
Catalogged Source?: NO
Point Source?: YES
GRB Indicated?: YES [ by BAT flight software ]
Image S/N Ratio: 8.88
Image Trigger?: NO
Rate S/N Ratio: 51.8652099195598 [ if not an image trigger ]
Image S/N Ratio: 8.88
Analysis Position: [ source = BAT ]
RA: 301.077639808073 Dec: -40.2740100040986 [deg; J2000]
Refined Position: [ source = BAT pre-slew burst ]
RA: 301.06871575253 Dec: -40.2771831067954 [deg; J2000]
{ 20h 04m 16.5s , -40d 16' 37.9" }
+/- 1.35991615543344 [arcmin] (estimated 90% radius based on SNR)
+/- 0.580356676801513 [arcmin] (formal 1-sigma fit error)
SNR: 19.605899010128
Angular difference between the analysis and refined position is 0.450699 arcmin
Partial Coding Fraction: 0.09472656 [ including projection effects ]
Duration
T90: 44.6640000343323 +/- 0.739134655826652
Measured from: 0.543999910354614
to: 45.2079999446869 [s; relative to TRIGTIME]
T50: 37.5799999237061 +/- 2.84478753699162
Measured from: 3.1159999370575
to: 40.6959998607635 [s; relative to TRIGTIME]
Fluence
Peak Flux (peak 1 second)
Measured from: 0.663999915122986
to: 1.66399991512299 [s; relative to TRIGTIME]
Total Fluence
Measured from: -0.232000112533569
to: 46.0319999456406 [s; relative to TRIGTIME]
Band 1 Band 2 Band 3 Band 4
15-25 25-50 50-100 100-350 keV
Total 1.925889 2.968141 3.859860 1.520604
0.165957 0.182856 0.173696 0.146838 [error]
Peak 0.089643 0.263583 0.341827 0.138872
0.028434 0.034025 0.036650 0.032122 [error]
[ fluence units of on-axis counts / fully illuminated detector ]
======================================================================
====== Table of the duration information =============================
Value tstart tstop
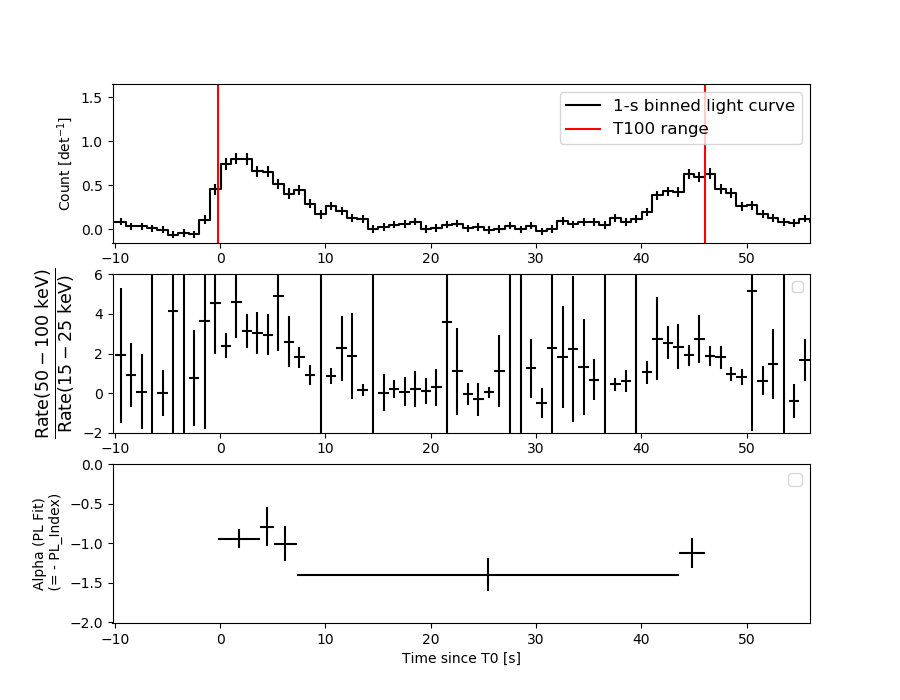
T100 46.264 -0.232 46.032
T90 44.664 0.544 45.208
T50 37.580 3.116 40.696
Peak 1.000 0.664 1.664
====== Spectral Analysis Summary =====================================
Model : spectral model: simple power-law (PL) and cutoff power-law (CPL)
Ph_index : photon index: E^{Ph_index}
Ph_90err : 90% error of the photon index
Epeak : Epeak in keV
Epeak_90err: 90% error of Epeak
Norm : normalization at 50 keV in both the PL model and CPL model
Nomr_90err : 90% error of the normalization
chi2 : Chi-Squared
dof : degree of freedo
=== Time-averaged spectral analysis ===
(Best model with acceptable fit: PL)
Model Ph_index Ph_90err_low Ph_90err_hi Epeak Epeak_90err_low Epeak_90err_hi Norm Nomr_90err_low Norm_90err_hi chi2 dof
PL -1.119 -0.096 0.098 - - - 1.63e-02 -9.17e-04 9.13e-04 64.540 57
CPL -0.979 -0.184 0.391 455.826 -455.826 -455.826 1.86e-02 -2.91e-03 7.89e-03 64.120 56
=== 1-s peak spectral analysis ===
(Best model with acceptable fit: N/A)
Model Ph_index Ph_90err_low Ph_90err_hi Epeak Epeak_90err_low Epeak_90err_hi Norm Nomr_90err_low Norm_90err_hi chi2 dof
PL -0.998 -0.221 0.227 - - - 5.71e-02 -7.78e-03 7.72e-03 51.040 57
CPL -0.395 -0.702 1.026 165.338 N/A N/A 1.01e-01 N/A N/A 49.560 56
=== Fluence/Peak Flux Summary ===
Model Band1 Band2 Band3 Band4 Band5 Total
15-25 25-50 50-100 100-350 15-150 15-350 keV
Fluence PL 6.75e-07 1.57e-06 2.89e-06 1.27e-05 7.84e-06 1.79e-05 erg/cm2
90%_error_low -7.88e-08 -1.12e-07 -1.66e-07 -1.62e-06 -4.33e-07 -1.69e-06 erg/cm2
90%_error_hi 8.25e-08 1.11e-07 1.65e-07 1.78e-06 4.33e-07 1.82e-06 erg/cm2
Peak flux PL 1.28e-04 1.42e-03 4.29e-02 4.08e+00 1.93e-01 3.64e+00 ph/cm2/s
90%_error_low 1.68e-04 N/A -1.53e-03 -4.90e-01 -5.32e-03 -1.70e-03 ph/cm2/s
90%_error_hi 5.90e-04 N/A 4.12e-02 2.17e+00 1.72e-01 2.72e+00 ph/cm2/s
Fluence CPL 6.47e-07 1.58e-06 2.94e-06 1.09e-05 7.82e-06 1.60e-05 erg/cm2
90%_error_low -1.05e-07 -1.15e-07 -1.04e-07 -3.61e-06 -4.39e-07 -3.58e-06 erg/cm2
90%_error_hi 7.73e-08 1.15e-07 2.14e-07 3.50e-06 4.39e-07 2.41e-06 erg/cm2
Peak flux CPL 1.21e+00 2.01e+00 2.15e+00 2.25e+00 6.43e+00 7.61e+00 ph/cm2/s
90%_error_low -4.75e-01 -3.69e-01 -3.60e-01 -1.06e+00 -9.27e-01 -1.47e+00 ph/cm2/s
90%_error_hi 5.30e-01 3.66e-01 3.73e-01 1.69e+00 9.32e-01 2.09e+00 ph/cm2/s
======================================================================
Image
Pre-slew 15.0-350.0 keV image (Event data)
#   RAcent    DECcent   POSerr    Theta     Phi              Peak Cts       SNR   Name
  301.0687   -40.2772   0.0098    50.3266  -139.2491        10.7672757     19.606 TRIG_00944916

Foreground time interval of the image:
 -0.232  46.032 (delta_t =  46.264 [sec])
Background time interval of the image:
-239.968  -0.232 (delta_t = 239.736 [sec])
Light Curves
Note: The mask-weighted lightcurves have units of either count/det or counts/sec/det, where a det is 0.4 x 0.4 = 0.16 sq cm.
Full-time range; 1 s binning
Other quick-look light curves:
- 64 ms binning (zoomed)
- 16 ms binning (zoomed)
- 8 ms binning (zoomed)
- 2 ms binning (zoomed)
- SN=5 or 10 s binning (full-time range)
- Raw light curve
Spectra
- 64 ms binning (zoomed)
- 16 ms binning (zoomed)
- 8 ms binning (zoomed)
- 2 ms binning (zoomed)
- SN=5 or 10 s binning (full-time range)
- Raw light curve
Spectra
Notes:
- 1) The fitting includes the systematic errors.
- 2) When the burst includes telescope slew time periods, the fitting uses an average response file made from multiple 5-s response files through out the slew time plus single time preiod for the non-slew times, and weighted by the total counts in the corresponding time period using addrmf. An average response file is needed becuase a spectral fit using the pre-slew DRM will introduce some errors in both a spectral shape and a normalization if the PHA file contains a lot of the slew/post-slew time interval.
- 3) For fits to more complicated models (e.g. a power-law over a cutoff power-law), the BAT team has decided to require a chi-square improvement of more than 6 for each extra dof.
Time averaged spectrum fit using the average DRM
Power-law model
Time interval is from   -0.232 sec. to   46.032 sec.
XSPEC12>exit
 XSPEC: quit


Photon index: -1.11887     ( -0.0964863   0.0980118 )
------------------------------------------------------------
Parameters  : value       lower 90%   higher 90%
Photon index: 1.11887     ( -0.0980118   0.0964863 )
Norm@50keV  : 1.63122E-02    ( -0.000917367   0.000912762 )
------------------------------------------------------------

Photon flux (15-150 keV)    in 46.26 sec: 1.89571 ( -0.11333  0.11382 ) ph/cm2/s
Energy fluence (15-150 keV)             : 7.84361e-06 ( -4.33146e-07  4.33437e-07 ) ergs/cm2
Cutoff power-law model
Time interval is from   -0.232 sec. to   46.032 sec.
 XSPEC: quit


Photon index: -0.979057     ( -0.18364   0.390564 )
------------------------------------------------------------
Parameters  : value       lower 90%   higher 90%
Photon index: 0.979057     ( -0.390564   0.18364 )
Epeak [keV] : 455.826      ( -455.81 -455.81 )
Norm@50keV  : 1.86104E-02    ( -0.00291383   0.00788763 )
------------------------------------------------------------

Photon flux (15-150 keV)    in 46.26 sec: 0.428375 ( -0.126256  0.118343 ) ph/cm2/s
Energy fluence (15-150 keV)             : 7.81928e-06 ( -4.39464e-07  4.38733e-07 ) ergs/cm2
1-s peak spectrum fit
Power-law model
Time interval is from    0.664 sec. to    1.664 sec.
XSPEC12>exit
 XSPEC: quit


Photon index: -0.998036     ( -0.221112   0.226996 )
------------------------------------------------------------
Parameters  : value       lower 90%   higher 90%
Photon index: 0.998036     ( -0.226996   0.221112 )
Norm@50keV  : 5.70676E-02    ( -0.00777835   0.0077242 )
------------------------------------------------------------

Photon flux (15-150 keV)    in 1 sec: 0.192837 ( -0.005321  0.172412 ) ph/cm2/s
Energy fluence (15-150 keV)             : 6.1759e-07 ( -8.62898e-08  8.65516e-08 ) ergs/cm2
Cutoff power-law model
Time interval is from    0.664 sec. to    1.664 sec.
 XSPEC: quit


Photon index: -0.395289     ( -0.702376   1.02611 )
------------------------------------------------------------
Parameters  : value       lower 90%   higher 90%
Photon index: 0.395289     ( -1.02611   0.702376 )
Epeak [keV] : 165.338      (   )
Norm@50keV  : 0.101229    (     )
------------------------------------------------------------

Photon flux (15-150 keV)    in 1 sec: 6.43127 ( -0.92692  0.9324 ) ph/cm2/s
Energy fluence (15-150 keV)             : 6.12125e-07 ( -8.88982e-08  8.83457e-08 ) ergs/cm2
Time-resolved spectra
Distribution
T90 vs. Hardness ratio plot
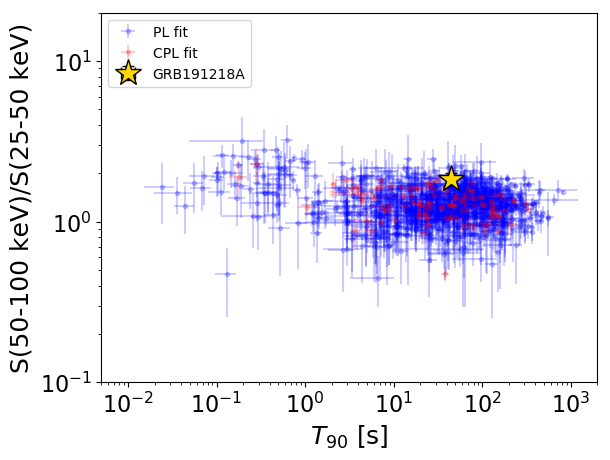
T90                                   = 44.664 sec.
Hardness ratio (energy fluence ratio) = 1.84183176874
S(15-50 keV) vs. S(50-150 keV) plot
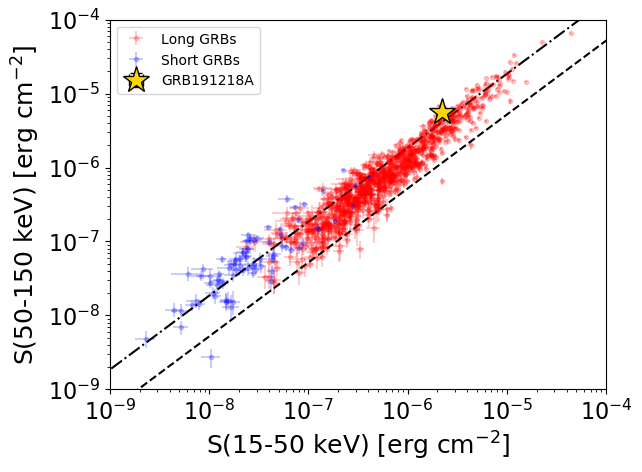
S(15-50 keV)  = 2.2428675e-06
S(50-150 keV) = 5.600694e-06
The dash-dotted line and the dashed line traces the fluences calculated from the Band function with Epeak = 15 and 150 keV, respectively. Both lines assume a canonical values of alpha = -1 and beta = -2.5.
Mask shadow pattern
IMX = -9.133415072618881E-01, IMY = 7.870104577881698E-01
Spacecraft aspect plot
Bright source in the pre-burst/pre-slew/post-slew images
Pre-burst image of 15-350 keV band
Time interval of the image:
-239.968000 -0.232000

# RAcent  DECcent POSerr Theta    Phi  PeakCts   SNR AngSep     Name
#  [deg]    [deg]    ['] [deg]  [deg]                   [']
288.7966  10.9408   20.6  34.1  -60.0   0.2061   0.6    0.3	GRS 1915+105
299.6360  35.2437    4.3  36.4  -13.9   0.7669   2.7    3.4	Cyg X-1
308.0989  40.9705    2.5  37.5    0.6   1.5399   4.7    1.2	Cyg X-3
326.1364  38.4657    7.3  32.7   23.8   0.5143   1.6    8.8	Cyg X-2
312.8292  59.1044    3.1  53.8   12.7   5.0835   3.7 ------	UNKNOWN
306.2907  58.0759    3.2  53.8    8.3   4.4209   3.6 ------	UNKNOWN
290.1508  -9.6908    2.5  36.2  -96.2   2.4810   4.6 ------	UNKNOWN
286.0522 -13.1906    2.7  41.3  -98.6   4.4316   4.3 ------	UNKNOWN
291.7774 -28.2418    2.4  45.4 -121.1   4.5570   4.8 ------	UNKNOWN
Pre-slew background subtracted image of 15-350 keV band
Time interval of the image:
-0.232000 46.032000

# RAcent  DECcent POSerr Theta    Phi  PeakCts   SNR AngSep     Name
#  [deg]    [deg]    ['] [deg]  [deg]                   [']
288.7124  10.9037    9.8  34.2  -60.1   0.1992   1.2    5.7	GRS 1915+105
299.6993  35.2891   17.4  36.4  -13.7   0.0810   0.7    7.5	Cyg X-1
307.9978  40.8543    5.1  37.4    0.4  -0.3112  -2.3    7.8	Cyg X-3
326.1702  38.3069    7.7  32.6   23.9   0.1902   1.5    0.9	Cyg X-2
343.7987 -39.4645    2.6  49.3  177.8   1.0372   4.5 ------	UNKNOWN
283.0837  34.5377    2.5  46.6  -27.5   0.8475   4.7 ------	UNKNOWN
286.5286   9.1594    2.6  36.2  -63.4   0.9352   4.4 ------	UNKNOWN
271.7409  39.8707    2.1  57.0  -26.3   2.7270   5.6 ------	UNKNOWN
301.0687 -40.2772    0.6  50.3 -139.2  10.7691  19.6 ------	UNKNOWN
Post-slew image of 15-350 keV band
Time interval of the image: