Analysis Summary
Notes:
- 1) No attempt has been made to eliminate the non-significant decimal places.
- 2) This batgrbproduct analysis is done using the HEASARC data.
- 3) This batgrbproduct analysis is using the flight position for the mask-weighting calculation.
======================================================================
                  BAT GRB EVENT DATA PROCESSING REPORT
    Process Script Ver: batgrbproduct v2.47
    Process Start Time: Mon May 18 15:18:20 EDT 2020
             Host Name: bat1
   Current Working Dir: /local/data/bat1/alien/Swift_3rdBATcatalog/event/batevent_reproc/trigger945344
======================================================================

  Trigger: 00945344      Segment: 000

  BAT Trigger Time: 598541401.92   [s; MET]
      Trigger Stop: 598541418.304   [s; MET]
               UTC: 2019-12-20T13:29:37.799160    [includes UTCF correction]
       Where From?: TDRSS position message

  BAT
    RA: 281.390866815625   Dec: 26.6672230199831  [deg; J2000]

     Catalogged Source?: NO
     Point Source?:      YES
     GRB Indicated?:     YES    [ by BAT flight software ]
     Image S/N Ratio:    7.8
     Image Trigger?:     NO
     Rate S/N Ratio:     8.88819441731559  [ if not an image trigger ]
     Image S/N Ratio:    7.8

  Analysis Position:   [ source = BAT ]
    RA: 281.390866815625   Dec: 26.6672230199831  [deg; J2000]

  Refined Position:   [ source = BAT pre-slew burst ]
    RA: 281.334172693515   Dec: 26.6748587410377  [deg; J2000]
        { 18h 45m 20.2s , +26d 40' 29.5" }
         +/- 3.06769117505058 [arcmin] (estimated 90% radius based on SNR)
         +/- 1.49638333645907 [arcmin] (formal 1-sigma fit error)
    SNR: 6.13300310124348

  Angular difference between the analysis and refined position is 3.074038 arcmin

  Partial Coding Fraction: 0.1953125    [ including projection effects ]

  Duration
     T90: 175.583999991417 +/- 125.995058205559
        Measured from: -0.383999943733215
                   to: 175.200000047684     [s; relative to TRIGTIME]
     T50: 39.9200000762939 +/- 101.595469893744
        Measured from: 7.2960000038147
                   to: 47.2160000801086     [s; relative to TRIGTIME]


  Fluence
     Peak Flux  (peak 1 second)
        Measured from: 6.69200003147125
                   to: 7.69200003147125     [s; relative to TRIGTIME]
     Total Fluence
        Measured from: -2.46399998664856
                   to: 248.416000008583     [s; relative to TRIGTIME]

             Band 1     Band 2     Band 3     Band 4
              15-25      25-50     50-100    100-350     keV
 Total     0.791219   0.863989   0.254062   0.183373
           0.155828   0.158589   0.135568   0.119978 [error]
 Peak      0.059545   0.022660   0.053637   0.018432
           0.014937   0.016052   0.013733   0.010988 [error]

     [ fluence units of on-axis counts / fully illuminated detector ]

======================================================================


====== Table of the duration information =============================

        Value   tstart    tstop
T100  250.880   -2.464  248.416
T90   175.584   -0.384  175.200
T50    39.920    7.296   47.216
Peak    1.000    6.692    7.692


====== Spectral Analysis Summary =====================================

Model      : spectral model: simple power-law (PL) and cutoff power-law (CPL)
Ph_index   : photon index: E^{Ph_index}
Ph_90err   : 90% error of the photon index
Epeak      : Epeak in keV
Epeak_90err: 90% error of Epeak
Norm       : normalization at 50 keV in both the PL model and CPL model
Nomr_90err : 90% error of the normalization
chi2       : Chi-Squared
dof        : degree of freedo

=== Time-averaged spectral analysis ===
(Best model with acceptable fit: PL)

Model Ph_index Ph_90err_low Ph_90err_hi  Epeak  Epeak_90err_low  Epeak_90err_hi  Norm       Nomr_90err_low    Norm_90err_hi    chi2    dof
PL      -2.091    -0.424      0.376       -           -               -         4.58e-04     -1.35e-04          1.31e-04      56.670   57
CPL      0.313    -1.920      4.975       34.358      -8.711        18.688      1.51e-02     -1.51e-02          2.45e+01      53.710   56


=== 1-s peak spectral analysis ===
(Best model with acceptable fit: N/A)

Model Ph_index Ph_90err_low Ph_90err_hi  Epeak  Epeak_90err_low  Epeak_90err_hi  Norm       Nomr_90err_low    Norm_90err_hi    chi2    dof
PL      -1.775     -0.836     0.724       -           -               -         8.27e-03     -3.66e-03          3.06e-03      67.590   57
CPL     -3.216     -0.606     1.990      345.913      N/A           N/A         1.77e-03        N/A               N/A         66.150   56


=== Fluence/Peak Flux Summary ===

              Model    Band1     Band2     Band3     Band4     Band5     Total
                       15-25     25-50    50-100    100-350    15-150    15-350    keV
Fluence         PL   2.56e-07  3.29e-07  3.09e-07  5.12e-07  1.07e-06  1.41e-06   erg/cm2
      90%_error_low -7.08e-08 -7.44e-08 -1.16e-07 -2.93e-07 -2.78e-07 -4.66e-07   erg/cm2
      90%_error_hi   7.32e-08  7.36e-08  1.24e-07  4.79e-07  2.91e-07  6.07e-07   erg/cm2
Peak flux       PL   4.44e-01  3.79e-01  2.22e-01  1.93e-01  1.13e+00  1.24e+00   ph/cm2/s
      90%_error_low -4.44e-01 -1.35e-01 -1.23e-01 -1.51e-01 -3.84e-01 -4.15e-01   ph/cm2/s
      90%_error_hi   2.66e-01  1.28e-01  1.13e-01  3.02e-01  3.82e-01  4.17e-01   ph/cm2/s

Fluence        CPL   2.30e-07  4.27e-07  1.86e-07  9.75e-09  8.52e-07  8.53e-07   erg/cm2
      90%_error_low -8.58e-08 -1.21e-07 -1.35e-07    N/A    -2.23e-07 -2.24e-07   erg/cm2
      90%_error_hi   8.27e-08  1.21e-07  1.98e-07    N/A     3.32e-07  5.28e-07   erg/cm2
Peak flux      CPL   4.11e-01  2.58e-01  1.53e-01  1.22e-01  1.16e+00  1.22e+00   ph/cm2/s
      90%_error_low -2.80e-01 -2.58e-01 -1.53e-01 -6.68e-02 -4.20e-01 -4.00e-01   ph/cm2/s
      90%_error_hi   2.98e-01  2.07e-01  1.02e-01  8.39e-02  3.58e-01  4.43e-01   ph/cm2/s

======================================================================
Image
Pre-slew 15.0-350.0 keV image (Event data)
#   RAcent    DECcent   POSerr    Theta     Phi              Peak Cts       SNR   Name
  281.3342    26.6749   0.0315    37.6069  -105.2065         1.7465952      6.133 TRIG_00945344

Foreground time interval of the image:
 -2.464  62.981 (delta_t =  65.445 [sec])
Background time interval of the image:
-239.920  -2.464 (delta_t = 237.456 [sec])
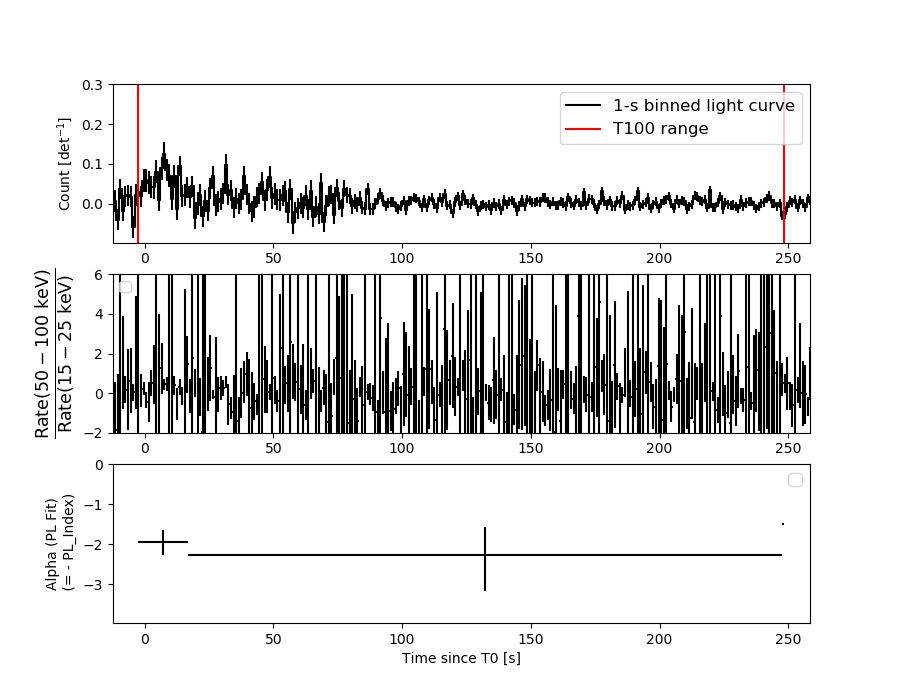
Light Curves
Note: The mask-weighted lightcurves have units of either count/det or counts/sec/det, where a det is 0.4 x 0.4 = 0.16 sq cm.
Full-time range; 1 s binning
Other quick-look light curves:
- 64 ms binning (zoomed)
- 16 ms binning (zoomed)
- 8 ms binning (zoomed)
- 2 ms binning (zoomed)
- SN=5 or 10 s binning (full-time range)
- Raw light curve
Spectra
- 64 ms binning (zoomed)
- 16 ms binning (zoomed)
- 8 ms binning (zoomed)
- 2 ms binning (zoomed)
- SN=5 or 10 s binning (full-time range)
- Raw light curve
Spectra
Notes:
- 1) The fitting includes the systematic errors.
- 2) When the burst includes telescope slew time periods, the fitting uses an average response file made from multiple 5-s response files through out the slew time plus single time preiod for the non-slew times, and weighted by the total counts in the corresponding time period using addrmf. An average response file is needed becuase a spectral fit using the pre-slew DRM will introduce some errors in both a spectral shape and a normalization if the PHA file contains a lot of the slew/post-slew time interval.
- 3) For fits to more complicated models (e.g. a power-law over a cutoff power-law), the BAT team has decided to require a chi-square improvement of more than 6 for each extra dof.
Time averaged spectrum fit using the average DRM
Power-law model
Time interval is from   -2.464 sec. to  248.416 sec.
XSPEC12>exit
 XSPEC: quit


Photon index: -2.09107     ( -0.424396   0.375814 )
------------------------------------------------------------
Parameters  : value       lower 90%   higher 90%
Photon index: 2.09107     ( -0.375814   0.424396 )
Norm@50keV  : 4.58008E-04    ( -0.000134934   0.00013092 )
------------------------------------------------------------

Photon flux (15-150 keV)    in 250.9 sec: 7.17467E-02 ( -0.0156091  0.0156091 ) ph/cm2/s
Energy fluence (15-150 keV)             : 1.06707e-06 ( -2.77932e-07  2.91345e-07 ) ergs/cm2
Cutoff power-law model
Time interval is from   -2.464 sec. to  248.416 sec.
 XSPEC: quit


Photon index: 0.313292     ( -1.95252   4.94195 )
------------------------------------------------------------
Parameters  : value       lower 90%   higher 90%
Photon index: -0.313292     ( -4.94195   1.95252 )
Epeak [keV] : 34.3584      ( -8.68597 18.7128 )
Norm@50keV  : 1.51050E-02    ( -0.0197851   24.5005 )
------------------------------------------------------------

Photon flux (15-150 keV)    in 250.9 sec: 6.74220E-02 ( -0.01559  0.0159448 ) ph/cm2/s
Energy fluence (15-150 keV)             : 8.52081e-07 ( -2.23125e-07  3.31916e-07 ) ergs/cm2
1-s peak spectrum fit
Power-law model
Time interval is from    6.692 sec. to    7.692 sec.
XSPEC12>exit
 XSPEC: quit


Photon index: -1.77492     ( -0.835255   0.72538 )
------------------------------------------------------------
Parameters  : value       lower 90%   higher 90%
Photon index: 1.77492     ( -0.72538   0.835255 )
Norm@50keV  : 8.26923E-03    ( -0.0036551   0.00306016 )
------------------------------------------------------------

Photon flux (15-150 keV)    in 1 sec: 1.12879 ( -0.384178  0.38216 ) ph/cm2/s
Energy fluence (15-150 keV)             : 7.61816e-08 ( -3.07728e-08  3.0852e-08 ) ergs/cm2
Cutoff power-law model
Time interval is from    6.692 sec. to    7.692 sec.
 XSPEC: quit


Photon index: -3.39183     ( -0.436856   2.15916 )
------------------------------------------------------------
Parameters  : value       lower 90%   higher 90%
Photon index: 3.39183     ( -2.15916   0.436856 )
Epeak [keV] : 378.786      (   )
Norm@50keV  : 1.47833E-03    (     )
------------------------------------------------------------

Photon flux (15-150 keV)    in 1 sec: 1.15840 ( -0.419819  0.35808 ) ph/cm2/s
Energy fluence (15-150 keV)             : 6.18885e-08 ( -4.1229e-08  3.25437e-08 ) ergs/cm2
Time-resolved spectra
Distribution
T90 vs. Hardness ratio plot
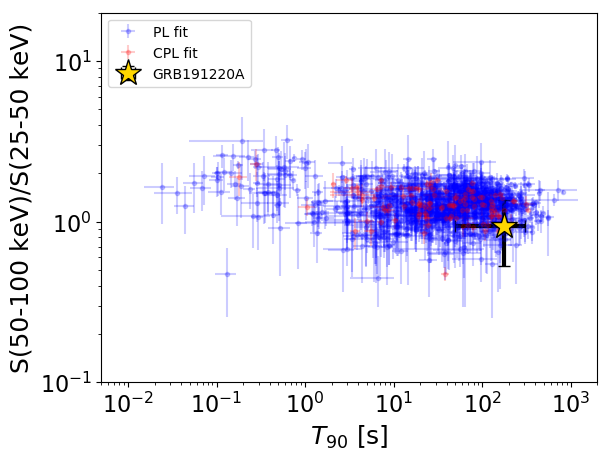
T90                                   = 175.584 sec.
Hardness ratio (energy fluence ratio) = 0.9389881106
S(15-50 keV) vs. S(50-150 keV) plot
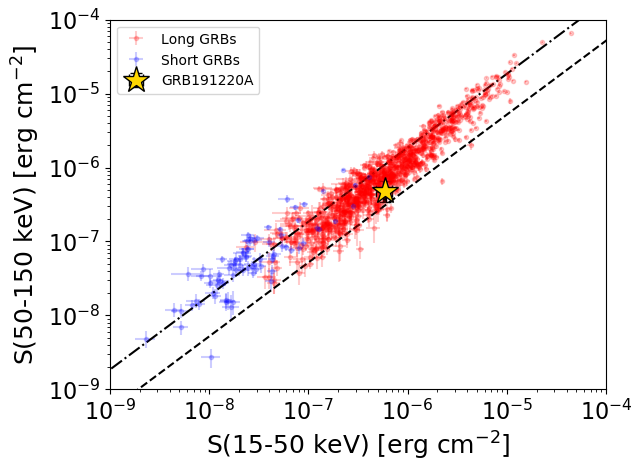
S(15-50 keV)  = 5.857301e-07
S(50-150 keV) = 4.8133e-07
The dash-dotted line and the dashed line traces the fluences calculated from the Band function with Epeak = 15 and 150 keV, respectively. Both lines assume a canonical values of alpha = -1 and beta = -2.5.
Mask shadow pattern
IMX = -2.020482682622891E-01, IMY = 7.433256263013049E-01
Spacecraft aspect plot
Bright source in the pre-burst/pre-slew/post-slew images
Pre-burst image of 15-350 keV band
Time interval of the image:
-239.920000 -2.464000

# RAcent  DECcent POSerr Theta    Phi  PeakCts   SNR AngSep     Name
#  [deg]    [deg]    ['] [deg]  [deg]                   [']
254.4719  35.3083    4.7  32.0  -62.6   0.8909   2.5    2.2	Her X-1
299.6513  35.1522    3.3  32.1 -135.2   1.1523   3.5    4.2	Cyg X-1
308.2138  41.0174    4.8  29.2 -151.8   0.6764   2.4    6.1	Cyg X-3
326.3336  38.3590    8.9  38.5 -171.3  -0.4511  -1.3    7.9	Cyg X-2
  4.4251  59.8753    2.6  37.8  135.5   2.4223   4.4 ------	UNKNOWN
350.3494  64.0036    2.9  30.1  137.3   1.4985   4.0 ------	UNKNOWN
217.4159  25.7057    2.1  54.0  -24.9   3.8963   5.4 ------	UNKNOWN
316.7818  19.2122    2.8  52.2 -148.8   3.5109   4.1 ------	UNKNOWN
300.2862  18.7464    2.8  48.0 -129.1   4.2404   4.1 ------	UNKNOWN
276.7438  23.0162    3.1  41.2  -98.5   4.0915   3.8 ------	UNKNOWN
Pre-slew background subtracted image of 15-350 keV band
Time interval of the image:
-2.464000 62.980620

# RAcent  DECcent POSerr Theta    Phi  PeakCts   SNR AngSep     Name
#  [deg]    [deg]    ['] [deg]  [deg]                   [']
254.5246  35.2012    5.0  32.1  -62.8  -0.3779  -2.3    9.1	Her X-1
299.4248  35.2475   18.8  31.9 -134.9  -0.0861  -0.6    8.6	Cyg X-1
308.0461  40.9660  474.4  29.2 -151.6  -0.0029  -0.0    3.0	Cyg X-3
326.3402  38.3534    3.7  38.5 -171.3   0.4553   3.1    8.2	Cyg X-2
171.7519  58.5001    1.8  45.0   35.4   2.1584   6.4 ------	UNKNOWN
242.4134  73.8545    2.4  15.4   43.9   0.5132   4.8 ------	UNKNOWN
331.8025  59.3512    2.1  25.4  156.1   0.6886   5.6 ------	UNKNOWN
215.1544  44.0371    3.0  39.5   -9.3   0.5501   3.9 ------	UNKNOWN
281.3342  26.6749    1.9  37.6 -105.2   1.7471   6.1 ------	UNKNOWN
Post-slew image of 15-350 keV band
Time interval of the image:
119.180600 720.049700
720.080000 962.130000

# RAcent  DECcent POSerr Theta    Phi  PeakCts   SNR AngSep     Name
#  [deg]    [deg]    ['] [deg]  [deg]                   [']
254.5008  35.3795    2.5  24.5   12.1   3.2450   4.6    3.1	Her X-1
268.2147  -1.5687    0.0  31.0  -79.0  -1.5017  -1.6   11.5	SW J1753.5-0127
288.7984  11.0990    7.3  17.1 -130.7   1.0559   1.6    9.2	GRS 1915+105
299.5453  35.1686    2.5  17.7  131.7   3.4488   4.7    3.0	Cyg X-1
308.1200  40.9909    3.1  26.2  124.9   3.7726   3.7    2.3	Cyg X-3
326.2717  38.1953    4.0  39.2  136.2   5.3494   2.9    8.9	Cyg X-2
275.4303  66.9006    2.8  40.4   71.2  10.9575   4.1 ------	UNKNOWN
254.1061  14.6116    2.8  28.2  -35.2   3.3724   4.1 ------	UNKNOWN
299.7642 -17.7870    2.3  47.9 -129.1  15.3302   5.0 ------	UNKNOWN