Analysis Summary
Notes:
- 1) No attempt has been made to eliminate the non-significant decimal places.
- 2) This batgrbproduct analysis is done using the HEASARC data.
- 3) This batgrbproduct analysis is using the flight position for the mask-weighting calculation.
======================================================================
BAT GRB EVENT DATA PROCESSING REPORT
Process Script Ver: batgrbproduct v2.47
Process Start Time: Mon May 18 15:16:19 EDT 2020
Host Name: bat1
Current Working Dir: /local/data/bat1/alien/Swift_3rdBATcatalog/event/batevent_reproc/trigger945521
======================================================================
Trigger: 00945521 Segment: 000
BAT Trigger Time: 598653577.28 [s; MET]
Trigger Stop: 598653578.304 [s; MET]
UTC: 2019-12-21T20:39:13.151900 [includes UTCF correction]
Where From?: TDRSS position message
BAT
RA: 154.832295571442 Dec: -38.141432610349 [deg; J2000]
Catalogged Source?: NO
Point Source?: YES
GRB Indicated?: YES [ by BAT flight software ]
Image S/N Ratio: 11.67
Image Trigger?: NO
Rate S/N Ratio: 145.168867185771 [ if not an image trigger ]
Image S/N Ratio: 11.67
Analysis Position: [ source = BAT ]
RA: 154.832295571442 Dec: -38.141432610349 [deg; J2000]
Refined Position: [ source = BAT pre-slew burst ]
RA: 154.830581173243 Dec: -38.1519729313983 [deg; J2000]
{ 10h 19m 19.3s , -38d 09' 07.1" }
+/- 1.14588350232199 [arcmin] (estimated 90% radius based on SNR)
+/- 0.321593617023232 [arcmin] (formal 1-sigma fit error)
SNR: 25.0398659096873
Angular difference between the analysis and refined position is 0.637572 arcmin
Partial Coding Fraction: 0.1201172 [ including projection effects ]
Duration
T90: 48 +/- 16
Measured from: -15.2799999713898
to: 32.7200000286102 [s; relative to TRIGTIME]
T50: 16 +/- 16
Measured from: -15.2799999713898
to: 0.720000028610229 [s; relative to TRIGTIME]
Fluence
Peak Flux (peak 1 second)
Measured from: 8.22000002861023
to: 9.22000002861023 [s; relative to TRIGTIME]
Total Fluence
Measured from: -15.2799999713898
to: 96.7200000286102 [s; relative to TRIGTIME]
Band 1 Band 2 Band 3 Band 4
15-25 25-50 50-100 100-350 keV
Total 5.103132 9.441755 8.911206 2.940658
0.180456 0.203742 0.195085 0.156653 [error]
Peak 0.149470 0.246612 0.176597 0.057910
0.026709 0.030842 0.026766 0.020408 [error]
[ fluence units of on-axis counts / fully illuminated detector ]
======================================================================
====== Table of the duration information =============================
Value tstart tstop
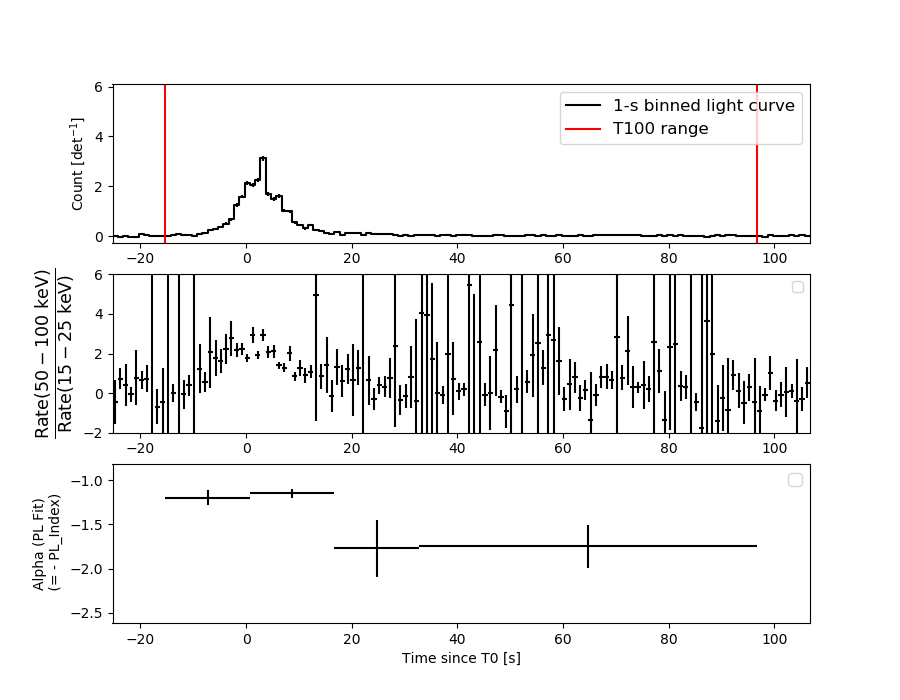
T100 112.000 -15.280 96.720
T90 48.000 -15.280 32.720
T50 16.000 -15.280 0.720
Peak 1.000 8.220 9.220
====== Spectral Analysis Summary =====================================
Model : spectral model: simple power-law (PL) and cutoff power-law (CPL)
Ph_index : photon index: E^{Ph_index}
Ph_90err : 90% error of the photon index
Epeak : Epeak in keV
Epeak_90err: 90% error of Epeak
Norm : normalization at 50 keV in both the PL model and CPL model
Nomr_90err : 90% error of the normalization
chi2 : Chi-Squared
dof : degree of freedo
=== Time-averaged spectral analysis ===
(Best model with acceptable fit: PL)
Model Ph_index Ph_90err_low Ph_90err_hi Epeak Epeak_90err_low Epeak_90err_hi Norm Nomr_90err_low Norm_90err_hi chi2 dof
PL -1.232 -0.046 0.046 - - - 1.70e-02 -4.37e-04 4.37e-04 43.770 57
CPL -0.993 -0.181 0.188 245.349 -82.224 514.241 2.17e-02 -3.53e-03 4.39e-03 38.630 56
=== 1-s peak spectral analysis ===
(Best model with acceptable fit: N/A)
Model Ph_index Ph_90err_low Ph_90err_hi Epeak Epeak_90err_low Epeak_90err_hi Norm Nomr_90err_low Norm_90err_hi chi2 dof
PL -1.766 -0.243 0.231 - - - 3.56e-02 -5.82e-03 5.73e-03 88.040 57
CPL -0.521 -1.140 1.406 57.343 -12.406 86.116 1.62e-01 -1.62e-01 6.81e-01 84.590 56
=== Fluence/Peak Flux Summary ===
Model Band1 Band2 Band3 Band4 Band5 Total
15-25 25-50 50-100 100-350 15-150 15-350 keV
Fluence PL 1.90e-06 4.11e-06 7.00e-06 2.74e-05 1.92e-05 4.04e-05 erg/cm2
90%_error_low -1.01e-07 -1.30e-07 -1.99e-07 -1.77e-06 -5.10e-07 -1.86e-06 erg/cm2
90%_error_hi 1.03e-07 1.29e-07 1.99e-07 1.85e-06 5.10e-07 1.93e-06 erg/cm2
Peak flux PL 1.89e+00 1.63e+00 9.58e-01 8.44e-01 4.85e+00 5.32e+00 ph/cm2/s
90%_error_low -4.14e-01 -2.51e-01 -1.94e-01 -2.86e-01 -7.43e-01 -8.04e-01 ph/cm2/s
90%_error_hi 4.34e-01 2.50e-01 1.91e-01 3.50e-01 7.43e-01 8.05e-01 ph/cm2/s
Fluence CPL 1.78e-06 4.16e-06 7.18e-06 2.04e-05 1.90e-05 3.35e-05 erg/cm2
90%_error_low -1.30e-07 -1.38e-07 -2.40e-07 -3.97e-06 -5.38e-07 -3.95e-06 erg/cm2
90%_error_hi 1.32e-07 1.38e-07 2.42e-07 5.12e-06 5.37e-07 5.07e-06 erg/cm2
Peak flux CPL 1.90e+00 1.41e+00 7.18e-01 6.27e-01 4.31e+00 4.64e+00 ph/cm2/s
90%_error_low N/A -3.72e-01 -2.00e-01 -5.27e-01 -1.09e+00 -1.29e+00 ph/cm2/s
90%_error_hi N/A 2.45e-01 1.95e-01 1.46e-01 6.94e-01 1.19e+00 ph/cm2/s
======================================================================
Image
Pre-slew 15.0-350.0 keV image (Event data)
#   RAcent    DECcent   POSerr    Theta     Phi              Peak Cts       SNR   Name
  154.8306   -38.1520   0.0076    39.7720   119.3195        24.4156116     25.040 TRIG_00945521

Foreground time interval of the image:
-15.280  14.821 (delta_t =  30.101 [sec])
Background time interval of the image:
-239.280 -15.280 (delta_t = 224.000 [sec])
Light Curves
Note: The mask-weighted lightcurves have units of either count/det or counts/sec/det, where a det is 0.4 x 0.4 = 0.16 sq cm.
Full-time range; 1 s binning
Other quick-look light curves:
- 64 ms binning (zoomed)
- 16 ms binning (zoomed)
- 8 ms binning (zoomed)
- 2 ms binning (zoomed)
- SN=5 or 10 s binning (full-time range)
- Raw light curve
Spectra
- 64 ms binning (zoomed)
- 16 ms binning (zoomed)
- 8 ms binning (zoomed)
- 2 ms binning (zoomed)
- SN=5 or 10 s binning (full-time range)
- Raw light curve
Spectra
Notes:
- 1) The fitting includes the systematic errors.
- 2) When the burst includes telescope slew time periods, the fitting uses an average response file made from multiple 5-s response files through out the slew time plus single time preiod for the non-slew times, and weighted by the total counts in the corresponding time period using addrmf. An average response file is needed becuase a spectral fit using the pre-slew DRM will introduce some errors in both a spectral shape and a normalization if the PHA file contains a lot of the slew/post-slew time interval.
- 3) For fits to more complicated models (e.g. a power-law over a cutoff power-law), the BAT team has decided to require a chi-square improvement of more than 6 for each extra dof.
Time averaged spectrum fit using the average DRM
Power-law model
Time interval is from  -15.280 sec. to   96.720 sec.
XSPEC12>exit
 XSPEC: quit


Photon index: -1.23195     ( -0.0459914   0.0461953 )
------------------------------------------------------------
Parameters  : value       lower 90%   higher 90%
Photon index: 1.23195     ( -0.0461953   0.0459914 )
Norm@50keV  : 1.70440E-02    ( -0.000437285   0.000436964 )
------------------------------------------------------------

Photon flux (15-150 keV)    in 112 sec: 2.01009 ( -0.05571  0.05584 ) ph/cm2/s
Energy fluence (15-150 keV)             : 1.91989e-05 ( -5.09844e-07  5.10228e-07 ) ergs/cm2
Cutoff power-law model

Time interval is from  -15.280 sec. to   96.720 sec.
 XSPEC: quit


Photon index: -0.99319     ( -0.180811   0.188447 )
------------------------------------------------------------
Parameters  : value       lower 90%   higher 90%
Photon index: 0.993190     ( -0.188447   0.180811 )
Epeak [keV] : 245.349      ( -82.2239 514.241 )
Norm@50keV  : 2.16774E-02    ( -0.00352686   0.00438649 )
------------------------------------------------------------

Photon flux (15-150 keV)    in 112 sec: 1.98230 ( -0.05912  0.05928 ) ph/cm2/s
Energy fluence (15-150 keV)             : 1.89893e-05 ( -5.37919e-07  5.36499e-07 ) ergs/cm2
1-s peak spectrum fit
Power-law model
Time interval is from    8.220 sec. to    9.220 sec.
XSPEC12>exit
 XSPEC: quit


Photon index: -1.76585     ( -0.242967   0.230927 )
------------------------------------------------------------
Parameters  : value       lower 90%   higher 90%
Photon index: 1.76585     ( -0.230927   0.242967 )
Norm@50keV  : 3.56247E-02    ( -0.00582387   0.0057321 )
------------------------------------------------------------

Photon flux (15-150 keV)    in 1 sec: 4.84575 ( -0.74278  0.74343 ) ph/cm2/s
Energy fluence (15-150 keV)             : 3.28488e-07 ( -5.45073e-08  5.48483e-08 ) ergs/cm2
Cutoff power-law model
Time interval is from    8.220 sec. to    9.220 sec.
 XSPEC: quit


Photon index: -0.521373     ( -1.14   1.40567 )
------------------------------------------------------------
Parameters  : value       lower 90%   higher 90%
Photon index: 0.521373     ( -1.40567   1.14 )
Epeak [keV] : 57.3426      ( -12.4055 86.1173 )
Norm@50keV  : 0.161939    ( -0.161955   0.680768 )
------------------------------------------------------------

Photon flux (15-150 keV)    in 1 sec: 4.30882 ( -1.089  0.69372 ) ph/cm2/s
Energy fluence (15-150 keV)             : 3.15762e-07 ( -5.49485e-08  5.60128e-08 ) ergs/cm2
Time-resolved spectra
Distribution
T90 vs. Hardness ratio plot
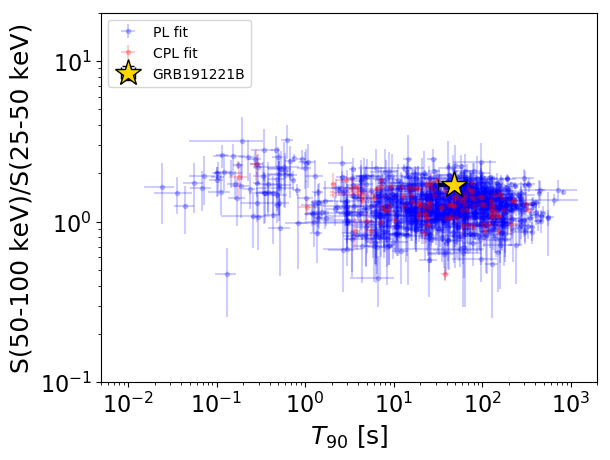
T90                                   = 48.0 sec.
Hardness ratio (energy fluence ratio) = 1.70298189807
S(15-50 keV) vs. S(50-150 keV) plot
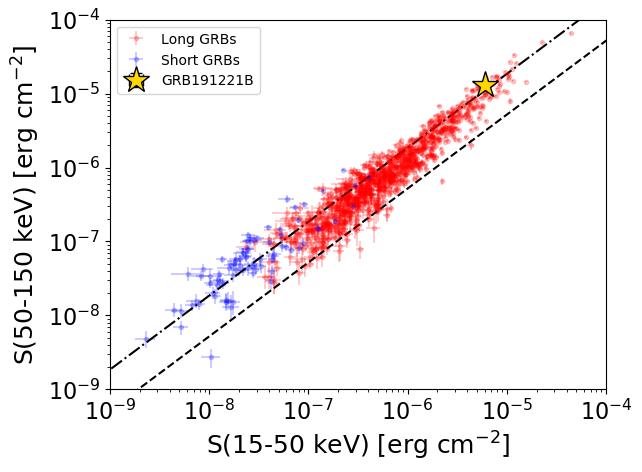
S(15-50 keV)  = 6.006618e-06
S(50-150 keV) = 1.3192182e-05
The dash-dotted line and the dashed line traces the fluences calculated from the Band function with Epeak = 15 and 150 keV, respectively. Both lines assume a canonical values of alpha = -1 and beta = -2.5.
Mask shadow pattern
IMX = -4.075790955843092E-01, IMY = -7.257198588464503E-01
Spacecraft aspect plot

Bright source in the pre-burst/pre-slew/post-slew images
Pre-burst image of 15-350 keV band
Time interval of the image:
-239.280000 -15.280000

# RAcent  DECcent POSerr Theta    Phi  PeakCts   SNR AngSep     Name
#  [deg]    [deg]    ['] [deg]  [deg]                   [']
170.3416 -60.6632    1.9  17.2   97.5   1.8289   6.0    2.5	Cen X-3
186.6993 -62.7729    1.7   9.2   99.5   1.9368   6.9    1.2	GX 301-2
255.7834 -37.9029  332.6  38.5  -92.1  -0.0293  -0.0   10.2	4U 1700-377
256.5086 -36.5322    7.5  40.0  -92.5   1.7290   1.5    7.4	GX 349+2
264.7375 -44.4476    8.4  37.2  -76.9   0.8631   1.4    0.3	4U 1735-44
180.1652 -24.7010    2.5  42.5  158.1   2.4472   4.5 ------	UNKNOWN
154.6428 -70.9801    3.0  20.9   61.7   1.2186   3.9 ------	UNKNOWN
 20.2088 -72.2302    2.8  44.4   12.5   1.9482   4.2 ------	UNKNOWN
258.7018 -36.6429    2.2  40.8  -90.1   6.4912   5.3 ------	UNKNOWN
Pre-slew background subtracted image of 15-350 keV band
Time interval of the image:
-15.280000 14.820590

# RAcent  DECcent POSerr Theta    Phi  PeakCts   SNR AngSep     Name
#  [deg]    [deg]    ['] [deg]  [deg]                   [']
170.5513 -60.5514  129.1  17.1   98.0   0.0193   0.1    8.2	Cen X-3
186.6655 -62.7773   78.1   9.2   99.5   0.0264   0.1    0.5	GX 301-2
255.8533 -37.7898   12.4  38.6  -92.1   0.3462   0.9    7.1	4U 1700-377
256.4538 -36.6005   23.6  39.9  -92.5   0.2252   0.5   10.7	GX 349+2
264.6661 -44.5894  208.7  37.0  -76.9   0.0135   0.1    9.0	4U 1735-44
154.8306 -38.1520    0.5  39.8  119.3  24.4156  25.0 ------	UNKNOWN
 95.7438 -70.4472    3.9  38.1   45.9   1.4941   3.0 ------	UNKNOWN
174.4749 -30.4895    3.0  38.8  147.7   1.5072   3.8 ------	UNKNOWN
223.3407 -46.7797    2.4  18.8 -127.9   0.6795   4.8 ------	UNKNOWN
257.7558 -51.7384    3.0  28.7  -74.1   0.5414   3.9 ------	UNKNOWN
248.1429 -46.3982    3.0  28.3  -91.5   0.5240   3.8 ------	UNKNOWN
257.3732 -36.1131    2.9  40.7  -91.9   1.7777   3.9 ------	UNKNOWN
253.5533 -33.7726    2.8  41.1  -97.9   1.7494   4.2 ------	UNKNOWN
Post-slew image of 15-350 keV band
Time interval of the image:
73.020590 962.857900

# RAcent  DECcent POSerr Theta    Phi  PeakCts   SNR AngSep     Name
#  [deg]    [deg]    ['] [deg]  [deg]                   [']
135.5102 -40.5734    2.1  15.1   41.5   3.9132   5.5    1.4	Vela X-1
170.2959 -60.6176    1.1  24.5  -51.7   8.3520  10.2    0.7	Cen X-3
186.6537 -62.7678    0.9  31.2  -61.0  12.3720  12.9    0.2	GX 301-2
141.6316 -23.4796    2.5  18.5  105.4   4.1437   4.6 ------	UNKNOWN
188.0697  -2.6167    4.2  46.7 -164.5   4.3044   2.8 ------	UNKNOWN
170.6473 -67.1294    2.4  30.3  -45.4   4.0859   4.9 ------	UNKNOWN
176.8721 -69.1982    2.4  33.2  -47.3   4.2223   4.9 ------	UNKNOWN
207.0744 -20.7444    2.7  48.0 -129.1  12.7414   4.3 ------	UNKNOWN
207.8071 -27.0007    3.0  45.4 -121.2  10.0345   3.9 ------	UNKNOWN
209.8116 -42.8407    3.0  41.3  -98.7  10.9373   3.8 ------	UNKNOWN