Analysis Summary
Notes:
- 1) No attempt has been made to eliminate the non-significant decimal places.
- 2) This batgrbproduct analysis is done using the HEASARC data.
- 3) This batgrbproduct analysis is using the flight position for the mask-weighting calculation.
======================================================================
BAT GRB EVENT DATA PROCESSING REPORT
Process Script Ver: batgrbproduct v2.47
Process Start Time: Mon May 18 15:12:11 EDT 2020
Host Name: bat1
Current Working Dir: /local/data/bat1/alien/Swift_3rdBATcatalog/event/batevent_reproc/trigger946344
======================================================================
Trigger: 00946344 Segment: 000
BAT Trigger Time: 599103601.728 [s; MET]
Trigger Stop: 599103602.752 [s; MET]
UTC: 2019-12-27T01:39:37.570780 [includes UTCF correction]
Where From?: TDRSS position message
BAT
RA: 319.169545066939 Dec: -16.7044309198896 [deg; J2000]
Catalogged Source?: NO
Point Source?: YES
GRB Indicated?: YES [ by BAT flight software ]
Image S/N Ratio: 16.65
Image Trigger?: NO
Rate S/N Ratio: 76.4983659956211 [ if not an image trigger ]
Image S/N Ratio: 16.65
Analysis Position: [ source = BAT ]
RA: 319.169545066939 Dec: -16.7044309198896 [deg; J2000]
Refined Position: [ source = BAT pre-slew burst ]
RA: 319.168468132108 Dec: -16.7173546059946 [deg; J2000]
{ 21h 16m 40.4s , -16d 43' 02.5" }
+/- 1.04820960164387 [arcmin] (estimated 90% radius based on SNR)
+/- 0.439549872494594 [arcmin] (formal 1-sigma fit error)
SNR: 28.4385049122436
Angular difference between the analysis and refined position is 0.777887 arcmin
Partial Coding Fraction: 0.1328125 [ including projection effects ]
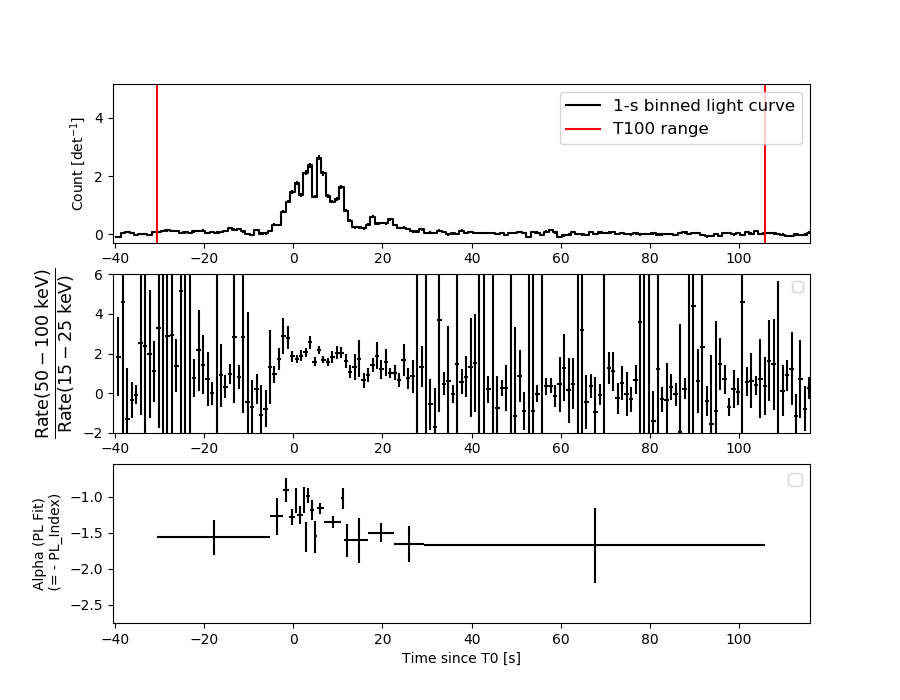
Duration
T90: 55.8880000114441 +/- 16.2818455193879
Measured from: -13.9680000543594
to: 41.9199999570847 [s; relative to TRIGTIME]
T50: 9.79200005531311 +/- 0.633567611205587
Measured from: 1.43999993801117
to: 11.2319999933243 [s; relative to TRIGTIME]
Fluence
Peak Flux (peak 1 second)
Measured from: 5.26800000667572
to: 6.26800000667572 [s; relative to TRIGTIME]
Total Fluence
Measured from: -30.5600000619888
to: 105.919999957085 [s; relative to TRIGTIME]
Band 1 Band 2 Band 3 Band 4
15-25 25-50 50-100 100-350 keV
Total 6.637621 11.318507 11.038217 4.620650
0.265075 0.289166 0.274289 0.241850 [error]
Peak 0.440665 0.814858 0.965302 0.405716
0.037224 0.047258 0.051948 0.041250 [error]
[ fluence units of on-axis counts / fully illuminated detector ]
======================================================================
====== Table of the duration information =============================
Value tstart tstop
T100 136.480 -30.560 105.920
T90 55.888 -13.968 41.920
T50 9.792 1.440 11.232
Peak 1.000 5.268 6.268
====== Spectral Analysis Summary =====================================
Model : spectral model: simple power-law (PL) and cutoff power-law (CPL)
Ph_index : photon index: E^{Ph_index}
Ph_90err : 90% error of the photon index
Epeak : Epeak in keV
Epeak_90err: 90% error of Epeak
Norm : normalization at 50 keV in both the PL model and CPL model
Nomr_90err : 90% error of the normalization
chi2 : Chi-Squared
dof : degree of freedo
=== Time-averaged spectral analysis ===
(Best model with acceptable fit: PL)
Model Ph_index Ph_90err_low Ph_90err_hi Epeak Epeak_90err_low Epeak_90err_hi Norm Nomr_90err_low Norm_90err_hi chi2 dof
PL -1.293 -0.052 0.053 - - - 1.84e-02 -5.28e-04 5.27e-04 51.160 57
CPL -1.244 -0.078 0.144 918.030 -918.030 -918.030 1.93e-02 -1.36e-03 2.54e-03 51.490 56
=== 1-s peak spectral analysis ===
(Best model with acceptable fit: PL)
Model Ph_index Ph_90err_low Ph_90err_hi Epeak Epeak_90err_low Epeak_90err_hi Norm Nomr_90err_low Norm_90err_hi chi2 dof
PL -1.110 -0.100 0.100 - - - 1.86e-01 -1.10e-02 1.10e-02 65.520 57
CPL -0.823 -0.327 0.402 245.673 N/A N/A 2.48e-01 N/A N/A 63.780 56
=== Fluence/Peak Flux Summary ===
Model Band1 Band2 Band3 Band4 Band5 Total
15-25 25-50 50-100 100-350 15-150 15-350 keV
Fluence PL 2.64e-06 5.51e-06 8.99e-06 3.30e-05 2.48e-05 5.02e-05 erg/cm2
90%_error_low -1.61e-07 -1.99e-07 -2.81e-07 -2.38e-06 -7.18e-07 -2.49e-06 erg/cm2
90%_error_hi 1.65e-07 1.98e-07 2.81e-07 2.50e-06 7.20e-07 2.59e-06 erg/cm2
Peak flux PL 5.28e+00 6.70e+00 6.21e+00 1.01e+01 2.16e+01 2.83e+01 ph/cm2/s
90%_error_low -6.05e-01 -4.84e-01 -4.05e-01 -1.33e+00 -1.32e+00 -1.76e+00 ph/cm2/s
90%_error_hi 6.31e-01 4.80e-01 4.02e-01 1.44e+00 1.32e+00 1.78e+00 ph/cm2/s
Fluence CPL 2.65e-06 5.51e-06 8.97e-06 3.36e-05 2.49e-05 5.04e-05 erg/cm2
90%_error_low -2.28e-07 -2.01e-07 -2.90e-07 -7.44e-06 -8.27e-07 -7.96e-06 erg/cm2
90%_error_hi 1.79e-07 1.91e-07 3.48e-07 -1.50e-06 6.71e-07 1.21e-06 erg/cm2
Peak flux CPL 1.59e+00 1.15e+00 5.77e-01 4.99e-01 3.53e+00 4.24e+00 ph/cm2/s
90%_error_low -1.59e+00 -1.15e+00 -5.77e-01 -4.99e-01 -3.53e+00 -4.24e+00 ph/cm2/s
90%_error_hi 1.06e+00 7.02e-01 2.94e-01 1.70e-01 2.13e+00 1.75e+00 ph/cm2/s
======================================================================
Image
Pre-slew 15.0-350.0 keV image (Event data)
#   RAcent    DECcent   POSerr    Theta     Phi              Peak Cts       SNR   Name
  319.1685   -16.7174   0.0068    49.8159  -142.0457        35.1438068     28.439 TRIG_00946344

Foreground time interval of the image:
-30.560 105.920 (delta_t = 136.480 [sec])
Background time interval of the image:
-239.728 -30.560 (delta_t = 209.168 [sec])
Light Curves
Note: The mask-weighted lightcurves have units of either count/det or counts/sec/det, where a det is 0.4 x 0.4 = 0.16 sq cm.
Full-time range; 1 s binning
Other quick-look light curves:
- 64 ms binning (zoomed)
- 16 ms binning (zoomed)
- 8 ms binning (zoomed)
- 2 ms binning (zoomed)
- SN=5 or 10 s binning (full-time range)
- Raw light curve
Spectra
- 64 ms binning (zoomed)
- 16 ms binning (zoomed)
- 8 ms binning (zoomed)
- 2 ms binning (zoomed)
- SN=5 or 10 s binning (full-time range)
- Raw light curve
Spectra
Notes:
- 1) The fitting includes the systematic errors.
- 2) When the burst includes telescope slew time periods, the fitting uses an average response file made from multiple 5-s response files through out the slew time plus single time preiod for the non-slew times, and weighted by the total counts in the corresponding time period using addrmf. An average response file is needed becuase a spectral fit using the pre-slew DRM will introduce some errors in both a spectral shape and a normalization if the PHA file contains a lot of the slew/post-slew time interval.
- 3) For fits to more complicated models (e.g. a power-law over a cutoff power-law), the BAT team has decided to require a chi-square improvement of more than 6 for each extra dof.
Time averaged spectrum fit using the average DRM
Power-law model
Time interval is from  -30.560 sec. to  105.920 sec.
XSPEC12>exit
 XSPEC: quit


Photon index: -1.2934     ( -0.0524578   0.0527085 )
------------------------------------------------------------
Parameters  : value       lower 90%   higher 90%
Photon index: 1.29340     ( -0.0527085   0.0524578 )
Norm@50keV  : 1.83850E-02    ( -0.000528176   0.000527064 )
------------------------------------------------------------

Photon flux (15-150 keV)    in 136.5 sec: 2.19076 ( -0.07008  0.07043 ) ph/cm2/s
Energy fluence (15-150 keV)             : 2.48418e-05 ( -7.18142e-07  7.19512e-07 ) ergs/cm2
Cutoff power-law model
Time interval is from  -30.560 sec. to  105.920 sec.
 XSPEC: quit


Photon index: -1.28915     ( -0.0777583   0.144849 )
------------------------------------------------------------
Parameters  : value       lower 90%   higher 90%
Photon index: 1.28915     ( -0.144849   0.0777583 )
Epeak [keV] : 9998.31      ( -9998.38 -9998.38 )
Norm@50keV  : 1.84627E-02    ( -0.000522235   0.00338196 )
------------------------------------------------------------

Photon flux (15-150 keV)    in 136.5 sec: 0.916918 ( -0.10306  0.060564 ) ph/cm2/s
Energy fluence (15-150 keV)             : 2.48618e-05 ( -8.27473e-07  6.70623e-07 ) ergs/cm2
1-s peak spectrum fit
Power-law model

Time interval is from    5.268 sec. to    6.268 sec.
XSPEC12>exit
 XSPEC: quit


Photon index: -1.10965     ( -0.0998047   0.100249 )
------------------------------------------------------------
Parameters  : value       lower 90%   higher 90%
Photon index: 1.10965     ( -0.100249   0.0998047 )
Norm@50keV  : 0.186171    ( -0.0110109   0.0109966 )
------------------------------------------------------------

Photon flux (15-150 keV)    in 1 sec: 21.6153 ( -1.3184  1.3199 ) ph/cm2/s
Energy fluence (15-150 keV)             : 1.94071e-06 ( -1.23647e-07  1.24004e-07 ) ergs/cm2
Cutoff power-law model
Time interval is from    5.268 sec. to    6.268 sec.
 XSPEC: quit


Photon index: -0.823392     ( -0.327101   0.402445 )
------------------------------------------------------------
Parameters  : value       lower 90%   higher 90%
Photon index: 0.823392     ( -0.402445   0.327101 )
Epeak [keV] : 245.673      (   )
Norm@50keV  : 0.247881    (     )
------------------------------------------------------------

Photon flux (15-150 keV)    in 1 sec: 3.52759 ( -3.52759  2.13326 ) ph/cm2/s
Energy fluence (15-150 keV)             : 1.93015e-06 ( -1.26136e-07  1.2593e-07 ) ergs/cm2
Time-resolved spectra
Distribution
T90 vs. Hardness ratio plot
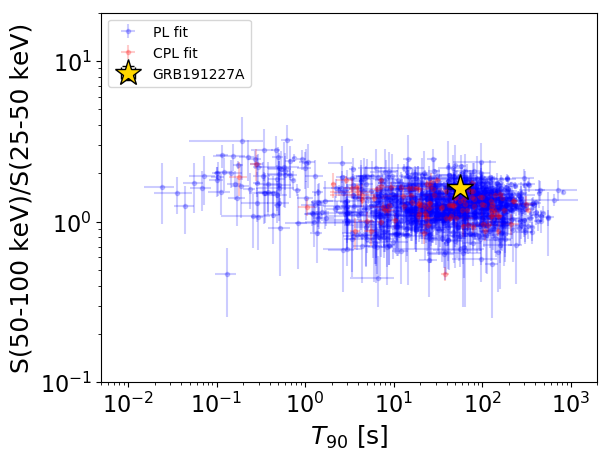
T90                                   = 55.888 sec.
Hardness ratio (energy fluence ratio) = 1.63196202256
S(15-50 keV) vs. S(50-150 keV) plot
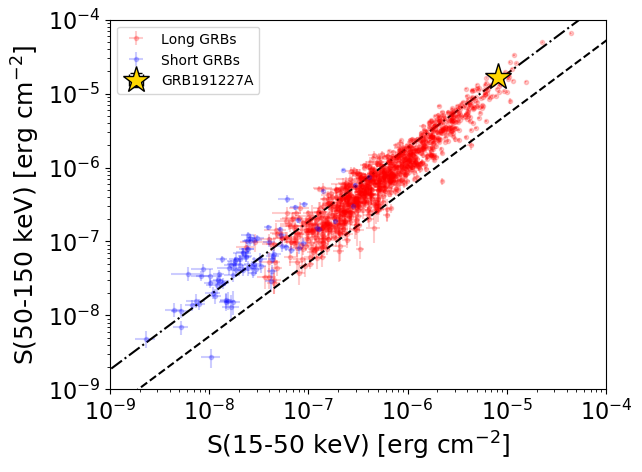
S(15-50 keV)  = 8.150014e-06
S(50-150 keV) = 1.6692046e-05
The dash-dotted line and the dashed line traces the fluences calculated from the Band function with Epeak = 15 and 150 keV, respectively. Both lines assume a canonical values of alpha = -1 and beta = -2.5.
Mask shadow pattern
IMX = -9.335905422901772E-01, IMY = 7.282031051986453E-01
Spacecraft aspect plot
Bright source in the pre-burst/pre-slew/post-slew images
Pre-burst image of 15-350 keV band
Time interval of the image:
-239.728000 -30.560000

# RAcent  DECcent POSerr Theta    Phi  PeakCts   SNR AngSep     Name
#  [deg]    [deg]    ['] [deg]  [deg]                   [']
254.2741  35.3734    4.1  32.6   14.6  -0.9308  -2.8    9.2	Her X-1
268.2531  -1.5739   34.3  33.0  -61.8   0.1373   0.3   10.0	SW J1753.5-0127
273.9045 -13.9653    8.1  41.0  -80.2   1.6293   1.4    7.3	GX 17+2
288.7646  10.7993    4.8  13.2  -99.8   0.6072   2.4    9.0	GRS 1915+105
299.6424  35.2648    4.6  14.2  110.9   0.7279   2.5    4.6	Cyg X-1
308.0983  41.0498    3.0  22.9  113.5   1.3355   3.9    5.9	Cyg X-3
326.0838  38.1989   12.2  33.9  132.5  -0.4277  -0.9    8.5	Cyg X-2
253.2206  18.4767    2.8  34.4  -16.1   1.2422   4.1 ------	UNKNOWN
237.0735  12.8807    2.6  50.9  -16.8   2.4853   4.4 ------	UNKNOWN
239.3877  -0.2315    2.9  54.5  -32.9   4.8036   3.9 ------	UNKNOWN
313.3881 -20.2154    3.1  49.8 -133.5   4.7396   3.7 ------	UNKNOWN
281.5228 -16.0193    2.7  40.8  -91.9   5.0188   4.3 ------	UNKNOWN
286.0056 -16.9618    3.3  41.1  -98.6   3.6883   3.6 ------	UNKNOWN
309.2430 -20.0871    3.0  48.0 -129.0   4.1485   3.8 ------	UNKNOWN
Pre-slew background subtracted image of 15-350 keV band
Time interval of the image:
-30.560000 105.920000

# RAcent  DECcent POSerr Theta    Phi  PeakCts   SNR AngSep     Name
#  [deg]    [deg]    ['] [deg]  [deg]                   [']
254.3441  35.2031    6.0  32.6   14.3   0.5740   1.9   10.0	Her X-1
268.4877  -1.4925   10.0  32.8  -62.0  -0.5687  -1.2    7.6	SW J1753.5-0127
273.9067 -14.1308   10.7  41.1  -80.3   1.7641   1.1    8.1	GX 17+2
288.9474  10.9358    5.3  13.1 -100.5   0.5590   2.2    8.8	GRS 1915+105
299.5865  35.2050   33.2  14.1  110.9  -0.0892  -0.3    0.3	Cyg X-1
308.1599  40.7700    4.0  22.8  114.1   0.7886   2.9   11.2	Cyg X-3
326.0263  38.2350    5.2  33.9  132.4   0.8367   2.2    8.6	Cyg X-2
229.5704  34.0049    3.3  52.8   11.5   3.5916   3.6 ------	UNKNOWN
306.5299  20.8030    3.0  15.8  174.3   0.9529   3.9 ------	UNKNOWN
319.1685 -16.7174    0.4  49.8 -142.0  35.1425  28.4 ------	UNKNOWN
Post-slew image of 15-350 keV band
Time interval of the image:
423.772600 962.322000

# RAcent  DECcent POSerr Theta    Phi  PeakCts   SNR AngSep     Name
#  [deg]    [deg]    ['] [deg]  [deg]                   [']
 66.0841  15.5464    3.7  37.8  120.7   4.6536   3.1 ------	UNKNOWN
 65.0310  31.6174    2.7  25.9   99.9   3.4338   4.2 ------	UNKNOWN
189.2179  81.3149    2.9  54.9   -1.8   8.0934   4.0 ------	UNKNOWN
325.9618  53.5262    3.5  45.6  -57.7   7.8254   3.3 ------	UNKNOWN
356.1887   9.4395    2.7  48.0 -129.0   9.1013   4.3 ------	UNKNOWN