Analysis Summary
Notes:
- 1) No attempt has been made to eliminate the non-significant decimal places.
- 2) This batgrbproduct analysis is done using the HEASARC data.
- 3) This batgrbproduct analysis is using the flight position for the mask-weighting calculation.
======================================================================
                  BAT GRB EVENT DATA PROCESSING REPORT
    Process Script Ver: batgrbproduct v2.47
    Process Start Time: Mon May 18 15:10:11 EDT 2020
             Host Name: bat1
   Current Working Dir: /local/data/bat1/alien/Swift_3rdBATcatalog/event/batevent_reproc/trigger946476
======================================================================

  Trigger: 00946476      Segment: 000

  BAT Trigger Time: 599184104   [s; MET]
      Trigger Stop: 599184176   [s; MET]
               UTC: 2019-12-28T00:01:19.837560    [includes UTCF correction]
       Where From?: TDRSS position message

  BAT
    RA: 5.3392435854354   Dec: -8.67033493468903  [deg; J2000]

     Catalogged Source?: NO
     Point Source?:      YES
     GRB Indicated?:     YES    [ by BAT flight software ]
     Image S/N Ratio:    12.82
     Image Trigger?:     YES
     Rate S/N Ratio:     0  [ if not an image trigger ]
     Image S/N Ratio:    12.82

  Analysis Position:   [ source = BAT ]
    RA: 5.3392435854354   Dec: -8.67033493468903  [deg; J2000]

  Refined Position:   [ source = BAT pre-slew burst ]
    RA: 5.36285866931138   Dec: -8.67732460528768  [deg; J2000]
        { 00h 21m 27.1s , -08d 40' 38.4" }
         +/- 1.39565357880773 [arcmin] (estimated 90% radius based on SNR)
         +/- 0.649113647308929 [arcmin] (formal 1-sigma fit error)
    SNR: 18.8926634927409

  Angular difference between the analysis and refined position is 1.462135 arcmin

  Partial Coding Fraction: 0.90625    [ including projection effects ]

  Duration
     T90: 193.815999984741 +/- 29.8751412512363
        Measured from: -31.9639999866486
                   to: 161.851999998093     [s; relative to TRIGTIME]
     T50: 116.37199985981 +/- 13.0497353837348
        Measured from: 1.51600003242493
                   to: 117.887999892235     [s; relative to TRIGTIME]


  Fluence
     Peak Flux  (peak 1 second)
        Measured from: 54.5920000076294
                   to: 55.5920000076294     [s; relative to TRIGTIME]
     Total Fluence
        Measured from: -39.3480000495911
                   to: 191.284000039101     [s; relative to TRIGTIME]

             Band 1     Band 2     Band 3     Band 4
              15-25      25-50     50-100    100-350     keV
 Total     1.756200   1.743578   0.930778   0.088128
           0.100414   0.103984   0.091824   0.085409 [error]
 Peak      0.024668   0.032610   0.017262   0.005691
           0.006902   0.007102   0.006243   0.005646 [error]

     [ fluence units of on-axis counts / fully illuminated detector ]

======================================================================


====== Table of the duration information =============================

        Value   tstart    tstop
T100  230.632  -39.348  191.284
T90   193.816  -31.964  161.852
T50   116.372    1.516  117.888
Peak    1.000   54.592   55.592


====== Spectral Analysis Summary =====================================

Model      : spectral model: simple power-law (PL) and cutoff power-law (CPL)
Ph_index   : photon index: E^{Ph_index}
Ph_90err   : 90% error of the photon index
Epeak      : Epeak in keV
Epeak_90err: 90% error of Epeak
Norm       : normalization at 50 keV in both the PL model and CPL model
Nomr_90err : 90% error of the normalization
chi2       : Chi-Squared
dof        : degree of freedo

=== Time-averaged spectral analysis ===
(Best model with acceptable fit: PL)

Model Ph_index Ph_90err_low Ph_90err_hi  Epeak  Epeak_90err_low  Epeak_90err_hi  Norm       Nomr_90err_low    Norm_90err_hi    chi2    dof
PL      -2.027    -0.146      0.141       -           -               -         1.08e-03     -9.79e-05          9.62e-05      52.420   57
CPL     -1.784    -0.328      0.595       37.667     -32.644       -37.667      1.48e-03     -6.33e-04          1.71e-03      51.820   56


=== 1-s peak spectral analysis ===
(Best model with acceptable fit: N/A)

Model Ph_index Ph_90err_low Ph_90err_hi  Epeak  Epeak_90err_low  Epeak_90err_hi  Norm       Nomr_90err_low    Norm_90err_hi    chi2    dof
PL      -1.930     -0.551     0.462       -           -               -         4.30e-03     -1.50e-03          1.40e-03      79.520   57
CPL     -1.430     -0.747     2.696       49.902      N/A           N/A         8.23e-03        N/A               N/A         79.300   56


=== Fluence/Peak Flux Summary ===

              Model    Band1     Band2     Band3     Band4     Band5     Total
                       15-25     25-50    50-100    100-350    15-150    15-350    keV
Fluence         PL   5.22e-07  6.96e-07  6.83e-07  1.20e-06  2.30e-06  3.10e-06   erg/cm2
      90%_error_low -5.39e-08 -4.85e-08 -8.63e-08 -2.81e-07 -1.92e-07 -3.77e-07   erg/cm2
      90%_error_hi   5.52e-08  4.85e-08  8.78e-08  3.36e-07  1.95e-07  4.20e-07   erg/cm2
Peak flux       PL   2.68e-01  2.09e-01  1.10e-01  8.34e-02  6.25e-01  6.70e-01   ph/cm2/s
      90%_error_low -9.20e-02 -5.37e-02 -4.79e-02 -5.36e-02 -1.58e-01 -1.75e-01   ph/cm2/s
      90%_error_hi   9.77e-02  5.34e-02  4.94e-02  8.96e-02  1.58e-01  1.78e-01   ph/cm2/s

Fluence        CPL   5.08e-07  7.15e-07  6.76e-07  7.64e-07  2.23e-06  3.12e-06   erg/cm2
      90%_error_low -6.15e-08 -6.00e-08 -9.41e-08 -4.60e-07 -2.32e-07 -3.37e-07   erg/cm2
      90%_error_hi   5.89e-08  6.35e-08  9.18e-08  8.94e-07  2.25e-07  9.04e-07   erg/cm2
Peak flux      CPL   2.54e-01  2.22e-01  1.11e-01  4.42e-02  6.16e-01  6.32e-01   ph/cm2/s
      90%_error_low -1.09e-01     N/A   -5.30e-02 -4.42e-02 -1.61e-01     N/A     ph/cm2/s
      90%_error_hi   1.02e-01     N/A    5.36e-02  5.83e-02  1.62e-01     N/A     ph/cm2/s

======================================================================
Image
Pre-slew 15.0-350.0 keV image (Event data)
#   RAcent    DECcent   POSerr    Theta     Phi              Peak Cts       SNR   Name
    5.3629    -8.6773   0.0102    11.3235    76.6261         3.1448828     18.893 TRIG_00946476

Foreground time interval of the image:
-39.348  81.501 (delta_t = 120.849 [sec])
Background time interval of the image:
-239.000 -39.348 (delta_t = 199.652 [sec])
Light Curves
Note: The mask-weighted lightcurves have units of either count/det or counts/sec/det, where a det is 0.4 x 0.4 = 0.16 sq cm.
Full-time range; 1 s binning
Other quick-look light curves:
- 64 ms binning (zoomed)
- 16 ms binning (zoomed)
- 8 ms binning (zoomed)
- 2 ms binning (zoomed)
- SN=5 or 10 s binning (full-time range)
- Raw light curve
Spectra
- 64 ms binning (zoomed)
- 16 ms binning (zoomed)
- 8 ms binning (zoomed)
- 2 ms binning (zoomed)
- SN=5 or 10 s binning (full-time range)
- Raw light curve
Spectra
Notes:
- 1) The fitting includes the systematic errors.
- 2) When the burst includes telescope slew time periods, the fitting uses an average response file made from multiple 5-s response files through out the slew time plus single time preiod for the non-slew times, and weighted by the total counts in the corresponding time period using addrmf. An average response file is needed becuase a spectral fit using the pre-slew DRM will introduce some errors in both a spectral shape and a normalization if the PHA file contains a lot of the slew/post-slew time interval.
- 3) For fits to more complicated models (e.g. a power-law over a cutoff power-law), the BAT team has decided to require a chi-square improvement of more than 6 for each extra dof.
Time averaged spectrum fit using the average DRM
Power-law model
Time interval is from  -39.348 sec. to  191.284 sec.
XSPEC12>exit
 XSPEC: quit


Photon index: -2.02682     ( -0.146305   0.140997 )
------------------------------------------------------------
Parameters  : value       lower 90%   higher 90%
Photon index: 2.02682     ( -0.140997   0.146305 )
Norm@50keV  : 1.07745E-03    ( -9.79231e-05   9.62159e-05 )
------------------------------------------------------------

Photon flux (15-150 keV)    in 230.6 sec: 0.163655 ( -0.011443  0.011455 ) ph/cm2/s
Energy fluence (15-150 keV)             : 2.29525e-06 ( -1.9186e-07  1.95498e-07 ) ergs/cm2
Cutoff power-law model
Time interval is from  -39.348 sec. to  191.284 sec.
 XSPEC: quit


Photon index: -1.78432     ( -0.327625   0.595415 )
------------------------------------------------------------
Parameters  : value       lower 90%   higher 90%
Photon index: 1.78432     ( -0.595415   0.327625 )
Epeak [keV] : 37.6667      ( -32.6442 -37.6666 )
Norm@50keV  : 1.47876E-03    ( -0.000633115   0.00170776 )
------------------------------------------------------------

Photon flux (15-150 keV)    in 230.6 sec: 0.161468 ( -0.012368  0.006193 ) ph/cm2/s
Energy fluence (15-150 keV)             : 2.23064e-06 ( -2.31979e-07  2.25196e-07 ) ergs/cm2
1-s peak spectrum fit
Power-law model
Time interval is from   54.592 sec. to   55.592 sec.
XSPEC12>exit
 XSPEC: quit


Photon index: -1.93019     ( -0.550931   0.461585 )
------------------------------------------------------------
Parameters  : value       lower 90%   higher 90%
Photon index: 1.93019     ( -0.461585   0.550931 )
Norm@50keV  : 4.29825E-03    ( -0.00150003   0.00139847 )
------------------------------------------------------------

Photon flux (15-150 keV)    in 1 sec: 0.624944 ( -0.158371  0.158384 ) ph/cm2/s
Energy fluence (15-150 keV)             : 3.95412e-08 ( -1.25613e-08  1.32887e-08 ) ergs/cm2
Cutoff power-law model
Time interval is from   54.592 sec. to   55.592 sec.
 XSPEC: quit


Photon index: -1.42993     ( -0.746774   2.69589 )
------------------------------------------------------------
Parameters  : value       lower 90%   higher 90%
Photon index: 1.42993     ( -2.69589   0.746774 )
Epeak [keV] : 49.9023      (   )
Norm@50keV  : 8.23236E-03    (     )
------------------------------------------------------------

Photon flux (15-150 keV)    in 1 sec: 0.615942 ( -0.1614  0.161513 ) ph/cm2/s
Energy fluence (15-150 keV)             : 3.79857e-08 ( -1.27398e-08  1.22613e-08 ) ergs/cm2
Time-resolved spectra
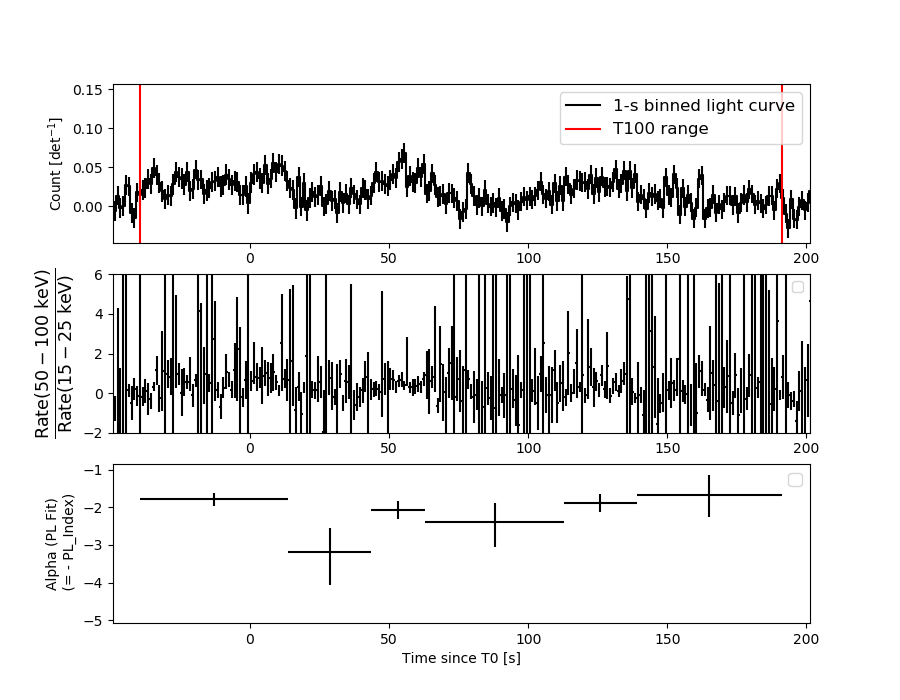
Distribution
T90 vs. Hardness ratio plot
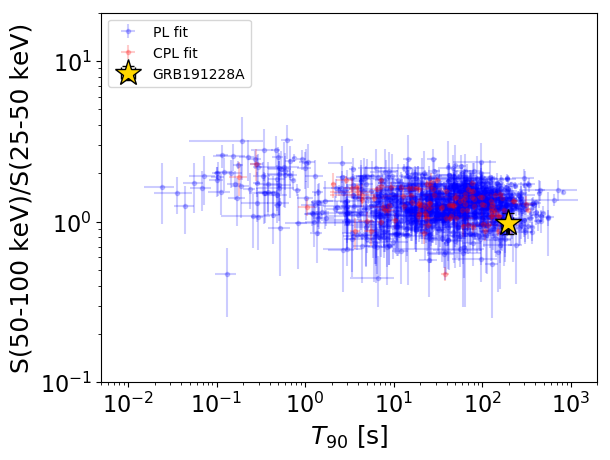
T90                                   = 193.816 sec.
Hardness ratio (energy fluence ratio) = 0.981612365907
S(15-50 keV) vs. S(50-150 keV) plot
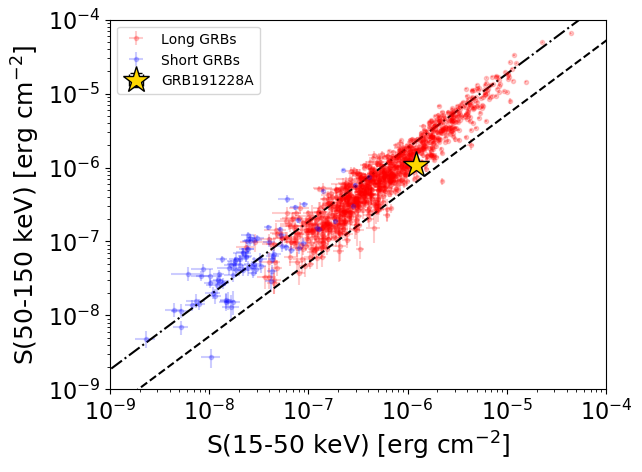
S(15-50 keV)  = 1.2178306e-06
S(50-150 keV) = 1.0774338e-06
The dash-dotted line and the dashed line traces the fluences calculated from the Band function with Epeak = 15 and 150 keV, respectively. Both lines assume a canonical values of alpha = -1 and beta = -2.5.
Mask shadow pattern
IMX = 4.631772827169977E-02, IMY = -1.948152686115756E-01
Spacecraft aspect plot
Bright source in the pre-burst/pre-slew/post-slew images
Pre-burst image of 15-350 keV band
Time interval of the image:
-239.000000 -39.348000

# RAcent  DECcent POSerr Theta    Phi  PeakCts   SNR AngSep     Name
#  [deg]    [deg]    ['] [deg]  [deg]                   [']
 37.5272 -39.0809    2.6  43.4  152.7   2.5461   4.4 ------	UNKNOWN
 29.5720 -52.4776    2.2  45.7  173.1   2.5731   5.2 ------	UNKNOWN
310.9222   0.8358    3.1  47.3  -53.1   3.5263   3.7 ------	UNKNOWN
Pre-slew background subtracted image of 15-350 keV band
Time interval of the image:
-39.348000 81.500590

# RAcent  DECcent POSerr Theta    Phi  PeakCts   SNR AngSep     Name
#  [deg]    [deg]    ['] [deg]  [deg]                   [']
  5.3629  -8.6773    0.6  11.3   76.6   3.1451  18.9 ------	UNKNOWN
310.0226  13.5233    2.5  53.8  -38.8   4.3886   4.6 ------	UNKNOWN
Post-slew image of 15-350 keV band
Time interval of the image:
112.900590 963.085500

# RAcent  DECcent POSerr Theta    Phi  PeakCts   SNR AngSep     Name
#  [deg]    [deg]    ['] [deg]  [deg]                   [']
 39.8878  -2.4285    4.2  35.0  104.9   7.8131   2.8 ------	UNKNOWN
 26.2493 -12.5137    2.8  20.9  125.5   6.4969   4.2 ------	UNKNOWN
 36.6189 -35.8499    2.3  39.4  161.5  11.0137   5.0 ------	UNKNOWN
359.3827 -52.7586    3.3  44.4 -151.8   8.7957   3.5 ------	UNKNOWN
331.8666 -24.5736    2.8  35.6  -97.5  12.5643   4.1 ------	UNKNOWN
333.6903 -48.6155    2.8  48.0 -129.1  24.4564   4.1 ------	UNKNOWN