Analysis Summary
Notes:
- 1) No attempt has been made to eliminate the non-significant decimal places.
- 2) This batgrbproduct analysis is done using the HEASARC data.
- 3) This batgrbproduct analysis is using the flight position for the mask-weighting calculation.
======================================================================
BAT GRB EVENT DATA PROCESSING REPORT
Process Script Ver: batgrbproduct v2.47
Process Start Time: Mon May 18 15:07:56 EDT 2020
Host Name: bat1
Current Working Dir: /local/data/bat1/alien/Swift_3rdBATcatalog/event/batevent_reproc/trigger948219
======================================================================
Trigger: 00948219 Segment: 000
BAT Trigger Time: 600118012.928 [s; MET]
Trigger Stop: 600118017.024 [s; MET]
UTC: 2020-01-07T19:26:28.705120 [includes UTCF correction]
Where From?: TDRSS position message
BAT
RA: 107.065612914004 Dec: -83.7157659956246 [deg; J2000]
Catalogged Source?: NO
Point Source?: YES
GRB Indicated?: YES [ by BAT flight software ]
Image S/N Ratio: 9.77
Image Trigger?: NO
Rate S/N Ratio: 11.2694276695846 [ if not an image trigger ]
Image S/N Ratio: 9.77
Analysis Position: [ source = BAT ]
RA: 107.065612914004 Dec: -83.7157659956246 [deg; J2000]
Refined Position: [ source = BAT pre-slew burst ]
RA: 107.05875321311 Dec: -83.7149580023457 [deg; J2000]
{ 07h 08m 14.1s , -83d 42' 53.8" }
+/- 1.16872807944568 [arcmin] (estimated 90% radius based on SNR)
+/- 0.425311638302923 [arcmin] (formal 1-sigma fit error)
SNR: 24.3436020249427
Angular difference between the analysis and refined position is 0.066183 arcmin
Partial Coding Fraction: 0.78125 [ including projection effects ]
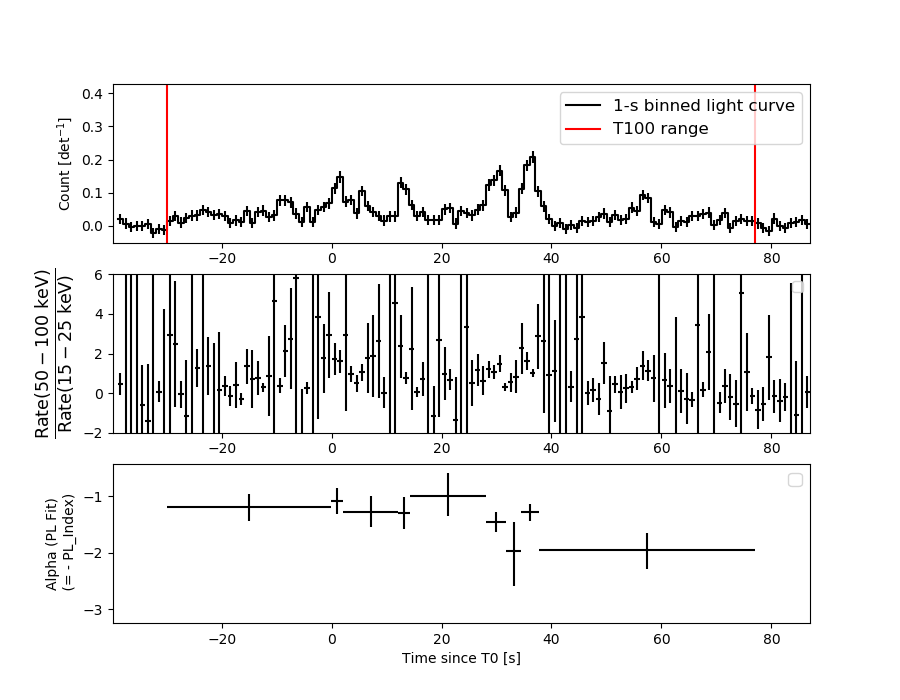
Duration
T90: 86.675999879837 +/- 11.6602347772905
Measured from: -21.8399999141693
to: 64.8359999656677 [s; relative to TRIGTIME]
T50: 35.0520000457764 +/- 1.78381155821153
Measured from: 1.07599997520447
to: 36.1280000209808 [s; relative to TRIGTIME]
Fluence
Peak Flux (peak 1 second)
Measured from: 36.0920000076294
to: 37.0920000076294 [s; relative to TRIGTIME]
Total Fluence
Measured from: -29.8559999465942
to: 77.0360000133514 [s; relative to TRIGTIME]
Band 1 Band 2 Band 3 Band 4
15-25 25-50 50-100 100-350 keV
Total 1.206544 1.684729 1.380532 0.432174
0.087020 0.087964 0.077555 0.070835 [error]
Peak 0.061540 0.083125 0.064409 0.003533
0.009338 0.009930 0.008724 0.007619 [error]
[ fluence units of on-axis counts / fully illuminated detector ]
======================================================================
====== Table of the duration information =============================
Value tstart tstop
T100 106.892 -29.856 77.036
T90 86.676 -21.840 64.836
T50 35.052 1.076 36.128
Peak 1.000 36.092 37.092
====== Spectral Analysis Summary =====================================
Model : spectral model: simple power-law (PL) and cutoff power-law (CPL)
Ph_index : photon index: E^{Ph_index}
Ph_90err : 90% error of the photon index
Epeak : Epeak in keV
Epeak_90err: 90% error of Epeak
Norm : normalization at 50 keV in both the PL model and CPL model
Nomr_90err : 90% error of the normalization
chi2 : Chi-Squared
dof : degree of freedo
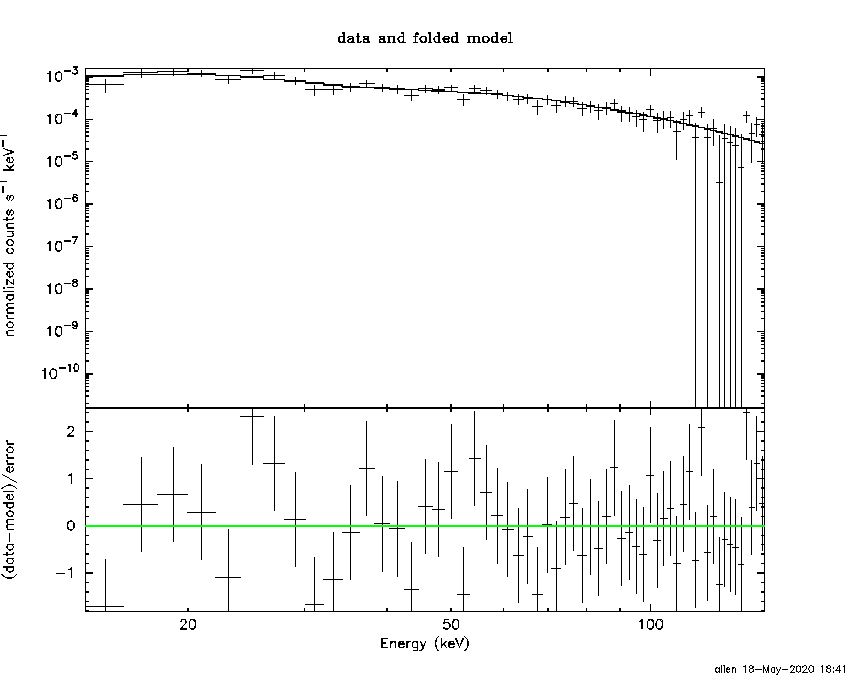
=== Time-averaged spectral analysis ===
(Best model with acceptable fit: PL)
Model Ph_index Ph_90err_low Ph_90err_hi Epeak Epeak_90err_low Epeak_90err_hi Norm Nomr_90err_low Norm_90err_hi chi2 dof
PL -1.398 -0.104 0.105 - - - 2.91e-03 -1.65e-04 1.65e-04 51.630 57
CPL -1.399 -0.101 0.319 9999.200 -9999.200 -9999.200 2.92e-03 -1.62e-04 1.18e-03 51.640 56
=== 1-s peak spectral analysis ===
(Best model with acceptable fit: PL)
Model Ph_index Ph_90err_low Ph_90err_hi Epeak Epeak_90err_low Epeak_90err_hi Norm Nomr_90err_low Norm_90err_hi chi2 dof
PL -1.604 -0.230 0.224 - - - 1.44e-02 -1.99e-03 1.95e-03 45.640 57
CPL -1.258 -0.554 0.990 103.541 -78.429 -103.541 2.18e-02 N/A N/A 45.140 56
=== Fluence/Peak Flux Summary ===
Model Band1 Band2 Band3 Band4 Band5 Total
15-25 25-50 50-100 100-350 15-150 15-350 keV
Fluence PL 3.62e-07 7.07e-07 1.07e-06 3.54e-06 3.01e-06 5.69e-06 erg/cm2
90%_error_low -3.85e-08 -4.48e-08 -7.67e-08 -5.38e-07 -1.87e-07 -5.91e-07 erg/cm2
90%_error_hi 3.97e-08 4.45e-08 7.63e-08 6.05e-07 1.88e-07 6.45e-07 erg/cm2
Peak flux PL 6.55e-01 6.19e-01 4.07e-01 4.16e-01 1.85e+00 2.10e+00 ph/cm2/s
90%_error_low -1.33e-01 -8.15e-02 -7.24e-02 -1.32e-01 -2.38e-01 -2.72e-01 ph/cm2/s
90%_error_hi 1.40e-01 8.10e-02 7.18e-02 1.64e-01 2.38e-01 2.74e-01 ph/cm2/s
Fluence CPL 3.61e-07 7.03e-07 1.07e-06 3.53e-06 3.03e-06 5.83e-06 erg/cm2
90%_error_low N/A -5.15e-08 -9.69e-08 N/A -2.53e-07 -1.49e-06 erg/cm2
90%_error_hi N/A 5.92e-08 1.10e-07 N/A 2.19e-07 1.56e-07 erg/cm2
Peak flux CPL 6.20e-01 6.42e-01 4.17e-01 2.74e-01 1.83e+00 1.95e+00 ph/cm2/s
90%_error_low -1.58e-01 -9.59e-02 -7.71e-02 -1.73e-01 -2.47e-01 -3.20e-01 ph/cm2/s
90%_error_hi 1.61e-01 1.01e-01 7.95e-02 1.86e-01 2.46e-01 3.57e-01 ph/cm2/s
======================================================================
Image
Pre-slew 15.0-350.0 keV image (Event data)
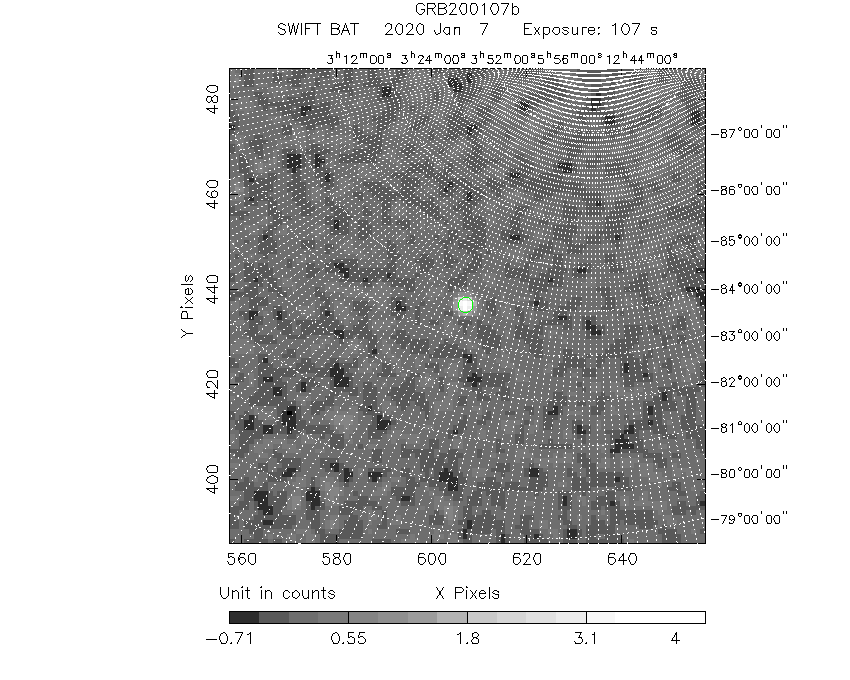
#   RAcent    DECcent   POSerr    Theta     Phi              Peak Cts       SNR   Name
  107.0588   -83.7150   0.0079    30.0595     8.3312         4.6590076     24.344 TRIG_00948219

Foreground time interval of the image:
-29.856  77.036 (delta_t = 106.892 [sec])
Background time interval of the image:
-239.928 -29.856 (delta_t = 210.072 [sec])
Light Curves
Note: The mask-weighted lightcurves have units of either count/det or counts/sec/det, where a det is 0.4 x 0.4 = 0.16 sq cm.
Full-time range; 1 s binning
Other quick-look light curves:
- 64 ms binning (zoomed)
- 16 ms binning (zoomed)
- 8 ms binning (zoomed)
- 2 ms binning (zoomed)
- SN=5 or 10 s binning (full-time range)
- Raw light curve
Spectra
- 64 ms binning (zoomed)
- 16 ms binning (zoomed)
- 8 ms binning (zoomed)
- 2 ms binning (zoomed)
- SN=5 or 10 s binning (full-time range)
- Raw light curve
Spectra
Notes:
- 1) The fitting includes the systematic errors.
- 2) When the burst includes telescope slew time periods, the fitting uses an average response file made from multiple 5-s response files through out the slew time plus single time preiod for the non-slew times, and weighted by the total counts in the corresponding time period using addrmf. An average response file is needed becuase a spectral fit using the pre-slew DRM will introduce some errors in both a spectral shape and a normalization if the PHA file contains a lot of the slew/post-slew time interval.
- 3) For fits to more complicated models (e.g. a power-law over a cutoff power-law), the BAT team has decided to require a chi-square improvement of more than 6 for each extra dof.
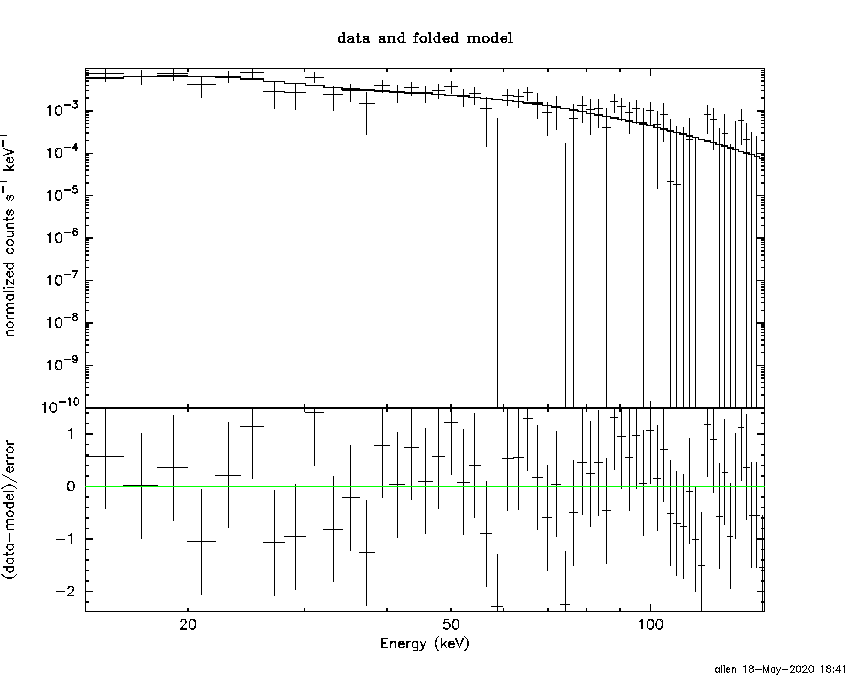
Time averaged spectrum fit using the average DRM
Power-law model
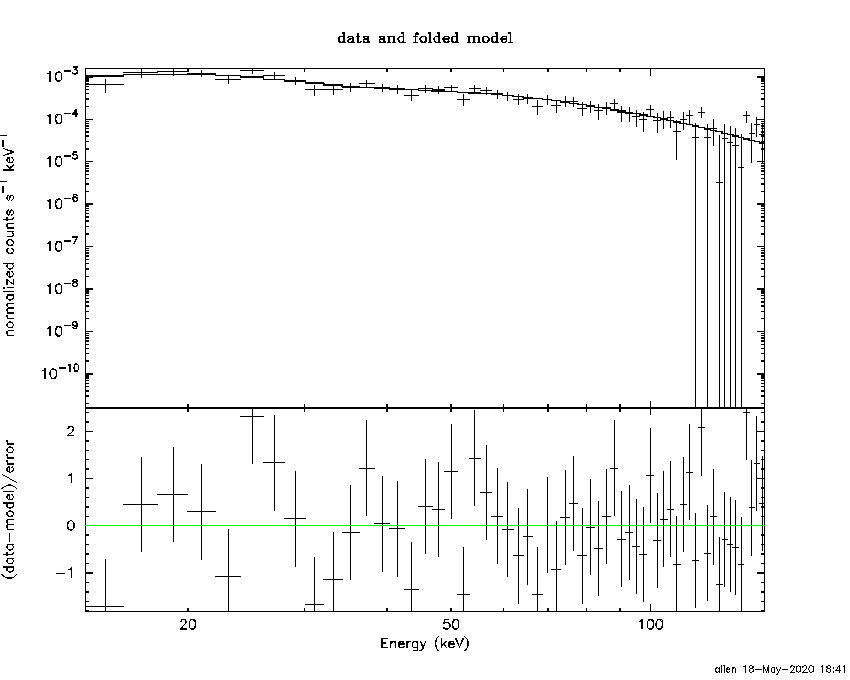
Time interval is from  -29.856 sec. to   77.036 sec.
XSPEC12>exit
 XSPEC: quit


Photon index: -1.39765     ( -0.10419   0.10466 )
------------------------------------------------------------
Parameters  : value       lower 90%   higher 90%
Photon index: 1.39765     ( -0.10466   0.10419 )
Norm@50keV  : 2.91490E-03    ( -0.000164952   0.000164805 )
------------------------------------------------------------

Photon flux (15-150 keV)    in 106.9 sec: 0.354798 ( -0.021009  0.021071 ) ph/cm2/s
Energy fluence (15-150 keV)             : 3.01271e-06 ( -1.86934e-07  1.87938e-07 ) ergs/cm2
Cutoff power-law model
Time interval is from  -29.856 sec. to   77.036 sec.
 XSPEC: quit


Photon index: -1.39881     ( -0.10226   0.31699 )
------------------------------------------------------------
Parameters  : value       lower 90%   higher 90%
Photon index: 1.39881     ( -0.31699   0.10226 )
Epeak [keV] : 9999.20      ( -9999.36 -9999.36 )
Norm@50keV  : 2.92220E-03    ( -0.000163647   0.00118154 )
------------------------------------------------------------

Photon flux (15-150 keV)    in 106.9 sec: 0.355960 ( -0.026543  0.023728 ) ph/cm2/s
Energy fluence (15-150 keV)             : 3.02571e-06 ( -2.52978e-07  2.19464e-07 ) ergs/cm2
1-s peak spectrum fit
Power-law model
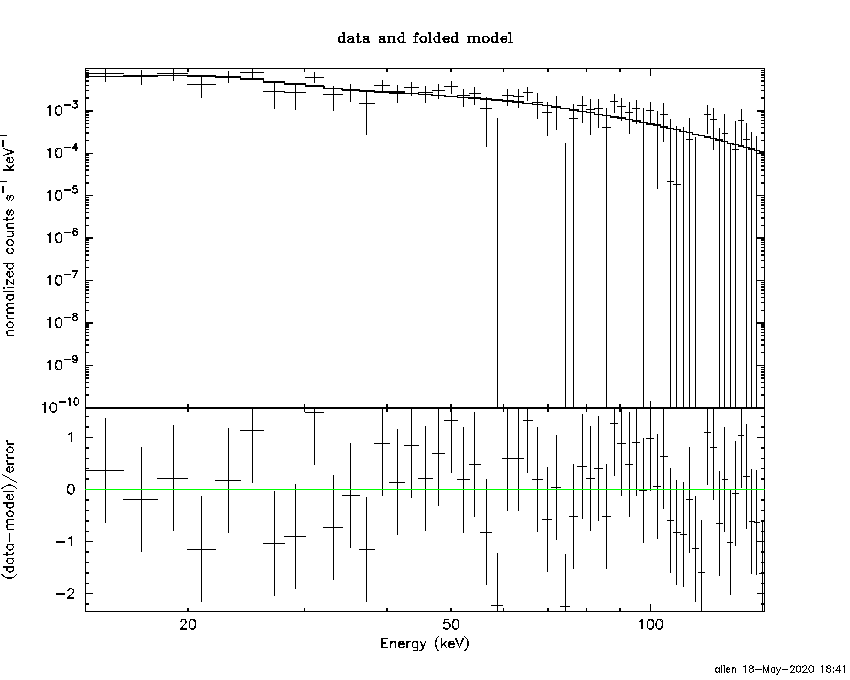
Time interval is from   36.092 sec. to   37.092 sec.
XSPEC12>exit
 XSPEC: quit


Photon index: -1.60448     ( -0.230464   0.22416 )
------------------------------------------------------------
Parameters  : value       lower 90%   higher 90%
Photon index: 1.60448     ( -0.22416   0.230464 )
Norm@50keV  : 1.43878E-02    ( -0.00198555   0.00195411 )
------------------------------------------------------------

Photon flux (15-150 keV)    in 1 sec: 1.85153 ( -0.23774  0.23795 ) ph/cm2/s
Energy fluence (15-150 keV)             : 1.34502e-07 ( -1.98452e-08  2.01623e-08 ) ergs/cm2
Cutoff power-law model
Time interval is from   36.092 sec. to   37.092 sec.
 XSPEC: quit


Photon index: -1.2582     ( -0.553619   0.989986 )
------------------------------------------------------------
Parameters  : value       lower 90%   higher 90%
Photon index: 1.25820     ( -0.989986   0.553619 )
Epeak [keV] : 103.541      ( -78.4294 -103.541 )
Norm@50keV  : 2.18146E-02    (     )
------------------------------------------------------------

Photon flux (15-150 keV)    in 1 sec: 1.82513 ( -0.24717  0.24608 ) ph/cm2/s
Energy fluence (15-150 keV)             : 1.30834e-07 ( -2.0477e-08  2.19156e-08 ) ergs/cm2
Time-resolved spectra
Distribution
T90 vs. Hardness ratio plot
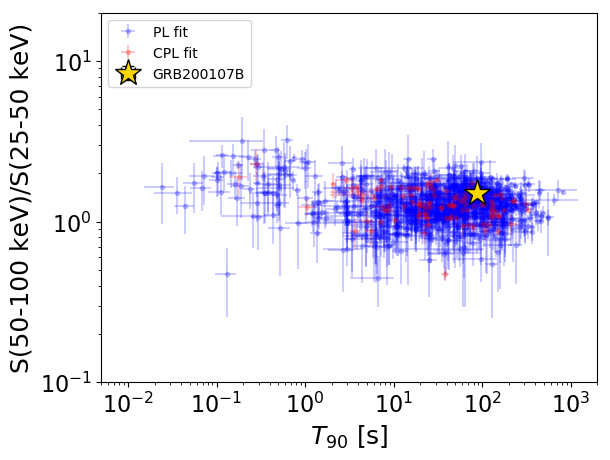
T90                                   = 86.676 sec.
Hardness ratio (energy fluence ratio) = 1.51820439245
S(15-50 keV) vs. S(50-150 keV) plot
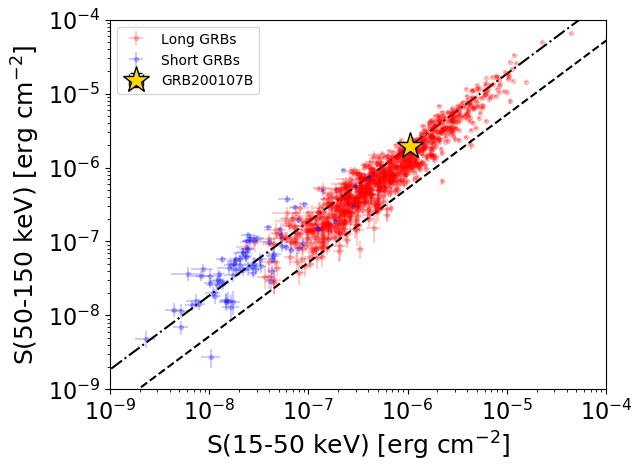
S(15-50 keV)  = 1.0687575e-06
S(50-150 keV) = 1.9439743e-06
The dash-dotted line and the dashed line traces the fluences calculated from the Band function with Epeak = 15 and 150 keV, respectively. Both lines assume a canonical values of alpha = -1 and beta = -2.5.
Mask shadow pattern
IMX = 5.726285106819353E-01, IMY = -8.385580134223859E-02
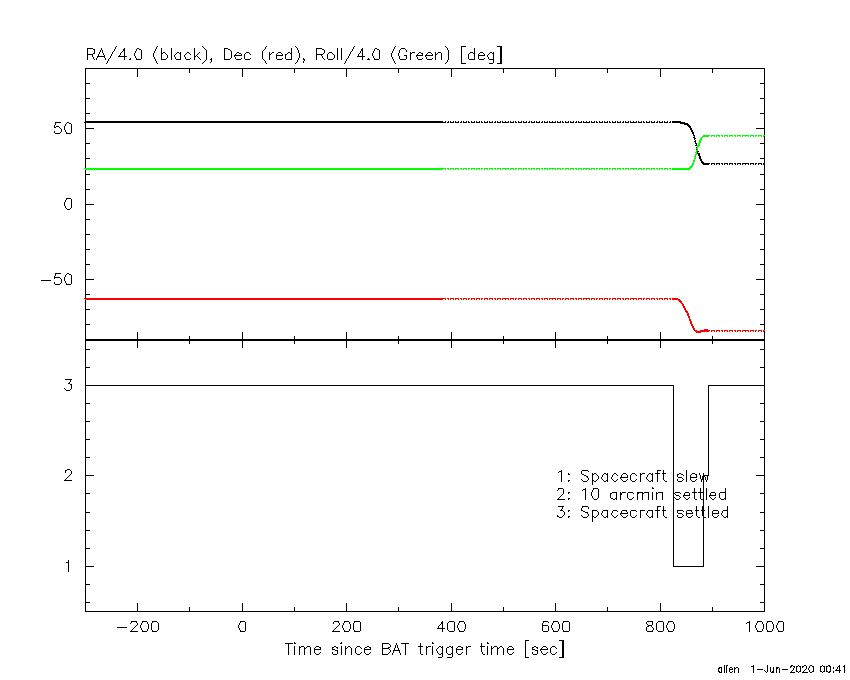
Spacecraft aspect plot
Bright source in the pre-burst/pre-slew/post-slew images
Pre-burst image of 15-350 keV band
Time interval of the image:
-239.928000 -29.856000

# RAcent  DECcent POSerr Theta    Phi  PeakCts   SNR AngSep     Name
#  [deg]    [deg]    ['] [deg]  [deg]                   [']
170.2424 -60.5908    7.0  22.0   70.5   0.5297   1.6    2.9	Cen X-3
186.4844 -62.8323    2.9  14.0   72.0   1.1807   4.0    6.0	GX 301-2
244.9525 -15.6402    1.5  50.8 -148.5   5.9657   7.9    1.6	Sco X-1
255.9875 -37.8466   43.9  34.0 -122.0  -0.1128  -0.3    0.2	4U 1700-377
256.4352 -36.4230    7.3  35.4 -122.7   0.7148   1.6    0.0	GX 349+2
264.6395 -44.4043    6.1  32.4 -105.3   0.8171   1.9    5.2	4U 1735-44
262.9231 -33.9970    0.0  40.2 -117.2   1.0516   1.7   10.3	GX 354-0
156.8925 -51.5600    2.7  33.3   77.3   2.6167   4.2 ------	UNKNOWN
122.0388 -70.6510    2.9  34.5   32.1   1.5668   4.0 ------	UNKNOWN
210.9738 -12.4918    2.7  50.4  168.3   3.9997   4.3 ------	UNKNOWN
214.9893  -6.1959    2.9  56.5  173.6   5.4318   4.0 ------	UNKNOWN
Pre-slew background subtracted image of 15-350 keV band
Time interval of the image:
-29.856000 77.036000

# RAcent  DECcent POSerr Theta    Phi  PeakCts   SNR AngSep     Name
#  [deg]    [deg]    ['] [deg]  [deg]                   [']
170.1899 -60.4732   15.3  22.1   70.7   0.1545   0.8    9.7	Cen X-3
186.3895 -62.7549    7.6  14.1   72.3  -0.2762  -1.5    7.4	GX 301-2
244.9197 -15.6005   16.4  50.9 -148.5   0.3987   0.7    4.2	Sco X-1
255.7649 -37.8337   18.3  34.0 -122.3  -0.1746  -0.6   10.5	4U 1700-377
256.1794 -36.3642    0.0  35.4 -123.1   0.4491   1.5   12.9	GX 349+2
264.7835 -44.3248    3.9  32.5 -105.3  -0.8955  -3.0    7.7	4U 1735-44
262.8007 -33.7732    7.3  40.4 -117.5   0.7384   1.6   10.1	GX 354-0
148.0985 -47.7055    2.1  40.0   75.0   3.8187   5.4 ------	UNKNOWN
186.7191 -19.1717    2.7  48.4  136.3   3.7431   4.3 ------	UNKNOWN
214.2090 -12.7205    2.3  50.0  172.4   2.4793   5.1 ------	UNKNOWN
107.0587 -83.7150    0.5  30.1    8.3   4.6590  24.3 ------	UNKNOWN
350.7652 -79.4813    2.0  35.3  -16.8   1.2912   5.9 ------	UNKNOWN
Post-slew image of 15-350 keV band
Time interval of the image:
882.672600 962.122000

# RAcent  DECcent POSerr Theta    Phi  PeakCts   SNR AngSep     Name
#  [deg]    [deg]    ['] [deg]  [deg]                   [']
170.1970 -60.7604    5.2  27.0  163.0   0.3350   2.2    9.0	Cen X-3
186.6007 -62.9184    5.3  26.6 -179.2   0.3263   2.1    9.0	GX 301-2
 50.6785 -42.7825    2.5  44.0   27.3   1.3659   4.6 ------	UNKNOWN
211.3339 -40.2796    2.3  51.5 -161.9   1.7815   5.0 ------	UNKNOWN
359.5700 -42.2157    2.3  49.9  -23.7   1.5368   4.9 ------	UNKNOWN
312.0514 -58.3062    2.5  37.4  -69.7   1.3531   4.6 ------	UNKNOWN