Analysis Summary
Notes:
- 1) No attempt has been made to eliminate the non-significant decimal places.
- 2) This batgrbproduct analysis is done using the HEASARC data.
- 3) This batgrbproduct analysis is using the flight position for the mask-weighting calculation.
======================================================================
BAT GRB EVENT DATA PROCESSING REPORT
Process Script Ver: batgrbproduct v2.47
Process Start Time: Mon May 18 15:05:44 EDT 2020
Host Name: bat1
Current Working Dir: /local/data/bat1/alien/Swift_3rdBATcatalog/event/batevent_reproc/trigger948361
======================================================================
Trigger: 00948361 Segment: 000
BAT Trigger Time: 600227200.448 [s; MET]
Trigger Stop: 600227208.64 [s; MET]
UTC: 2020-01-09T01:46:16.218040 [includes UTCF correction]
Where From?: TDRSS position message
BAT
RA: 307.170901934691 Dec: 53.0032235193214 [deg; J2000]
Catalogged Source?: NO
Point Source?: YES
GRB Indicated?: YES [ by BAT flight software ]
Image S/N Ratio: 12.72
Image Trigger?: NO
Rate S/N Ratio: 19.5703857907809 [ if not an image trigger ]
Image S/N Ratio: 12.72
Analysis Position: [ source = BAT ]
RA: 307.170901934691 Dec: 53.0032235193214 [deg; J2000]
Refined Position: [ source = BAT pre-slew burst ]
RA: 307.115141759145 Dec: 52.9890950301936 [deg; J2000]
{ 20h 28m 27.6s , +52d 59' 20.7" }
+/- 1.17107677000977 [arcmin] (estimated 90% radius based on SNR)
+/- 0.461953979689776 [arcmin] (formal 1-sigma fit error)
SNR: 24.2738847378558
Angular difference between the analysis and refined position is 2.184781 arcmin
Partial Coding Fraction: 1 [ including projection effects ]
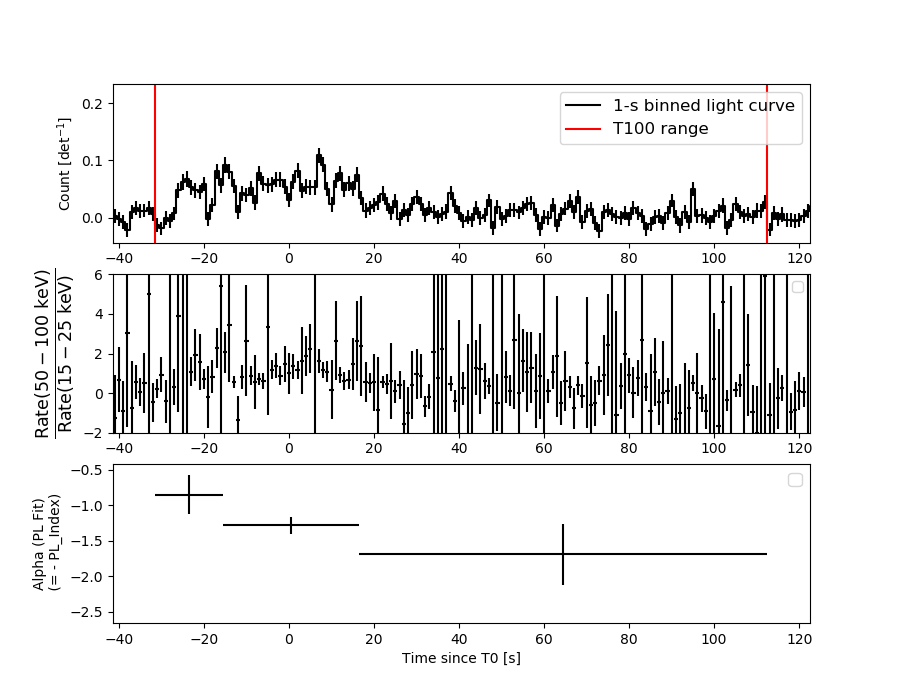
Duration
T90: 112 +/- 32
Measured from: -31.4479999542236
to: 80.5520000457764 [s; relative to TRIGTIME]
T50: 32 +/- 16
Measured from: -15.4479999542236
to: 16.5520000457764 [s; relative to TRIGTIME]
Fluence
Peak Flux (peak 1 second)
Measured from: 8.05200004577637
to: 9.05200004577637 [s; relative to TRIGTIME]
Total Fluence
Measured from: -31.4479999542236
to: 112.552000045776 [s; relative to TRIGTIME]
Band 1 Band 2 Band 3 Band 4
15-25 25-50 50-100 100-350 keV
Total 0.818485 1.150226 0.987526 0.272596
0.080014 0.082252 0.072051 0.063038 [error]
Peak 0.025130 0.032785 0.029477 -0.001019
0.006887 0.007191 0.006239 0.005549 [error]
[ fluence units of on-axis counts / fully illuminated detector ]
======================================================================
====== Table of the duration information =============================
Value tstart tstop
T100 144.000 -31.448 112.552
T90 112.000 -31.448 80.552
T50 32.000 -15.448 16.552
Peak 1.000 8.052 9.052
====== Spectral Analysis Summary =====================================
Model : spectral model: simple power-law (PL) and cutoff power-law (CPL)
Ph_index : photon index: E^{Ph_index}
Ph_90err : 90% error of the photon index
Epeak : Epeak in keV
Epeak_90err: 90% error of Epeak
Norm : normalization at 50 keV in both the PL model and CPL model
Nomr_90err : 90% error of the normalization
chi2 : Chi-Squared
dof : degree of freedo
=== Time-averaged spectral analysis ===
(Best model with acceptable fit: PL)
Model Ph_index Ph_90err_low Ph_90err_hi Epeak Epeak_90err_low Epeak_90err_hi Norm Nomr_90err_low Norm_90err_hi chi2 dof
PL -1.305 -0.136 0.137 - - - 1.49e-03 -1.09e-04 1.09e-04 45.470 57
CPL -1.306 -0.132 0.143 9999.360 -9999.360 -9999.360 1.50e-03 -1.07e-04 5.73e-04 45.500 56
=== 1-s peak spectral analysis ===
(Best model with acceptable fit: PL)
Model Ph_index Ph_90err_low Ph_90err_hi Epeak Epeak_90err_low Epeak_90err_hi Norm Nomr_90err_low Norm_90err_hi chi2 dof
PL -1.301 -0.364 0.374 - - - 5.87e-03 -1.33e-03 1.33e-03 70.310 57
CPL -0.204 -1.264 2.193 78.757 -28.228 -78.757 2.20e-02 -2.20e-02 2.62e-01 68.820 56
=== Fluence/Peak Flux Summary ===
Model Band1 Band2 Band3 Band4 Band5 Total
15-25 25-50 50-100 100-350 15-150 15-350 keV
Fluence PL 2.29e-07 4.74e-07 7.67e-07 2.79e-06 2.12e-06 4.25e-06 erg/cm2
90%_error_low -3.18e-08 -3.92e-08 -7.10e-08 -5.43e-07 -1.74e-07 -5.93e-07 erg/cm2
90%_error_hi 3.32e-08 3.88e-08 7.03e-08 6.33e-07 1.75e-07 6.68e-07 erg/cm2
Peak flux PL 2.00e-01 2.26e-01 1.84e-01 2.49e-01 7.00e-01 8.58e-01 ph/cm2/s
90%_error_low -7.34e-02 -5.65e-02 -4.94e-02 -1.12e-01 -1.60e-01 -1.99e-01 ph/cm2/s
90%_error_hi 8.10e-02 5.54e-02 4.90e-02 1.60e-01 1.60e-01 2.05e-01 ph/cm2/s
Fluence CPL 2.32e-07 4.70e-07 7.61e-07 2.96e-06 2.13e-06 4.08e-06 erg/cm2
90%_error_low N/A -4.76e-08 -8.62e-08 -1.23e-06 -2.36e-07 -9.31e-07 erg/cm2
90%_error_hi N/A 5.39e-08 9.61e-08 9.95e-08 2.15e-07 1.28e-06 erg/cm2
Peak flux CPL 1.69e-01 2.54e-01 1.96e-01 7.98e-02 6.75e-01 6.99e-01 ph/cm2/s
90%_error_low -8.45e-02 -6.91e-02 -5.82e-02 -7.98e-02 -1.63e-01 -1.81e-01 ph/cm2/s
90%_error_hi 9.16e-02 7.48e-02 5.86e-02 2.22e-01 1.64e-01 2.77e-01 ph/cm2/s
======================================================================
Image
Pre-slew 15.0-350.0 keV image (Event data)
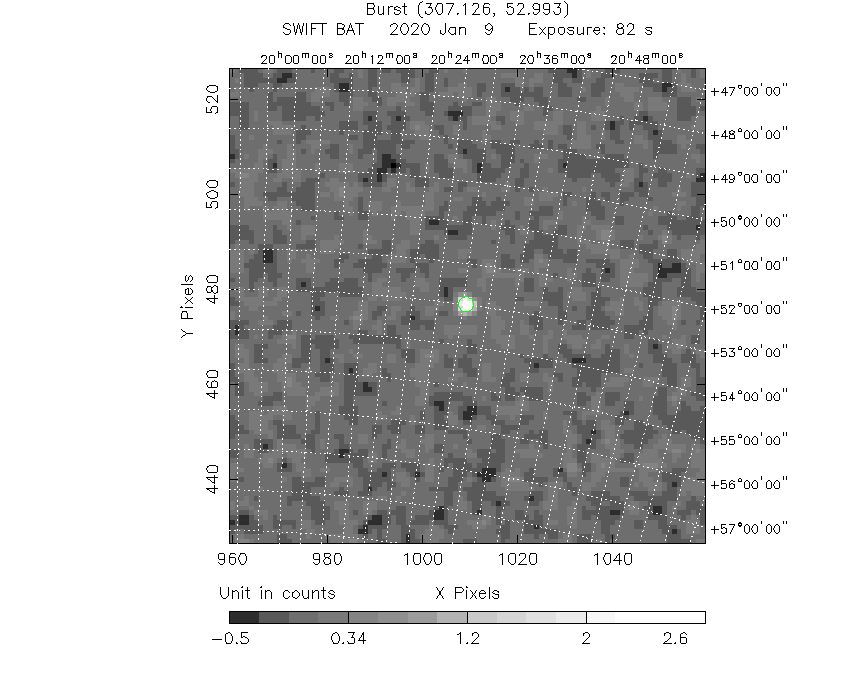
#   RAcent    DECcent   POSerr    Theta     Phi              Peak Cts       SNR   Name
  307.1151    52.9891   0.0080    15.2268  -179.9059         3.0567484     24.274 TRIG_00948361

Foreground time interval of the image:
-31.448  50.653 (delta_t =  82.101 [sec])
Background time interval of the image:
-239.448 -31.448 (delta_t = 208.000 [sec])
Light Curves
Note: The mask-weighted lightcurves have units of either count/det or counts/sec/det, where a det is 0.4 x 0.4 = 0.16 sq cm.
Full-time range; 1 s binning
Other quick-look light curves:
- 64 ms binning (zoomed)
- 16 ms binning (zoomed)
- 8 ms binning (zoomed)
- 2 ms binning (zoomed)
- SN=5 or 10 s binning (full-time range)
- Raw light curve
Spectra
- 64 ms binning (zoomed)
- 16 ms binning (zoomed)
- 8 ms binning (zoomed)
- 2 ms binning (zoomed)
- SN=5 or 10 s binning (full-time range)
- Raw light curve
Spectra
Notes:
- 1) The fitting includes the systematic errors.
- 2) When the burst includes telescope slew time periods, the fitting uses an average response file made from multiple 5-s response files through out the slew time plus single time preiod for the non-slew times, and weighted by the total counts in the corresponding time period using addrmf. An average response file is needed becuase a spectral fit using the pre-slew DRM will introduce some errors in both a spectral shape and a normalization if the PHA file contains a lot of the slew/post-slew time interval.
- 3) For fits to more complicated models (e.g. a power-law over a cutoff power-law), the BAT team has decided to require a chi-square improvement of more than 6 for each extra dof.
Time averaged spectrum fit using the average DRM
Power-law model
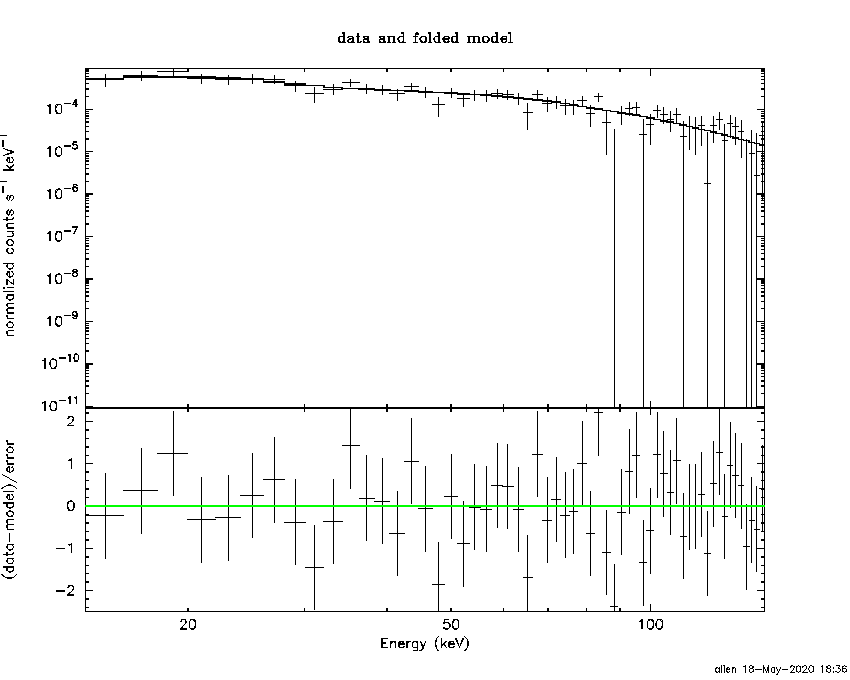
Time interval is from  -31.448 sec. to  112.552 sec.
XSPEC12>exit
 XSPEC: quit


Photon index: -1.30504     ( -0.136229   0.137286 )
------------------------------------------------------------
Parameters  : value       lower 90%   higher 90%
Photon index: 1.30504     ( -0.137286   0.136229 )
Norm@50keV  : 1.49306E-03    ( -0.00010931   0.00010922 )
------------------------------------------------------------

Photon flux (15-150 keV)    in 144 sec: 0.178295 ( -0.013477  0.013522 ) ph/cm2/s
Energy fluence (15-150 keV)             : 2.12223e-06 ( -1.73988e-07  1.7536e-07 ) ergs/cm2
Cutoff power-law model
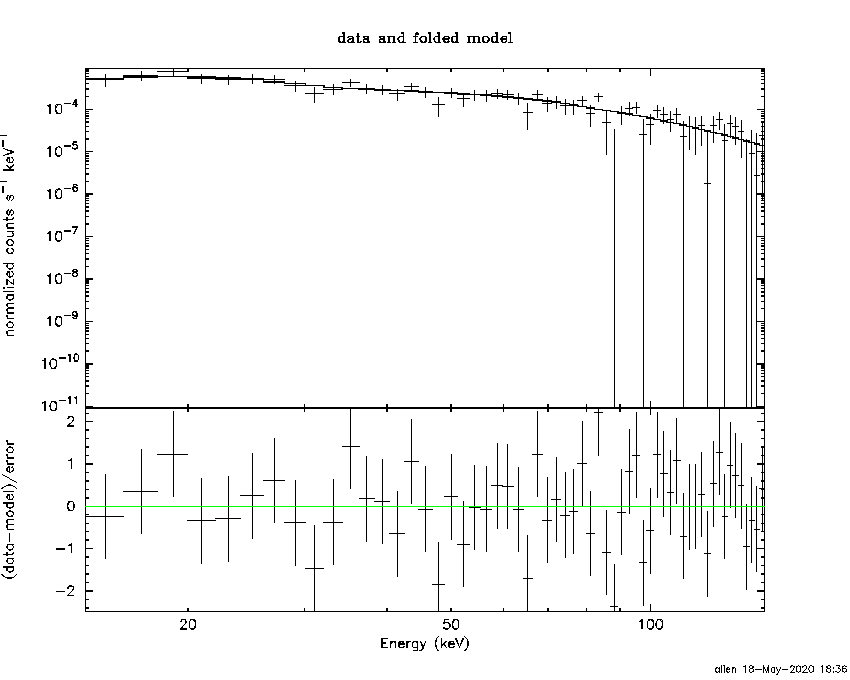
Time interval is from  -31.448 sec. to  112.552 sec.
 XSPEC: quit


Photon index: -1.30629     ( -0.132644   0.142683 )
------------------------------------------------------------
Parameters  : value       lower 90%   higher 90%
Photon index: 1.30629     ( -0.142683   0.132644 )
Epeak [keV] : 9999.36      ( -9999.36 -9999.36 )
Norm@50keV  : 1.49626E-03    ( -0.000109275   0.000570617 )
------------------------------------------------------------

Photon flux (15-150 keV)    in 144 sec: 0.179262 (    ) ph/cm2/s
Energy fluence (15-150 keV)             : 2.13306e-06 ( -2.36254e-07  2.15182e-07 ) ergs/cm2
1-s peak spectrum fit
Power-law model
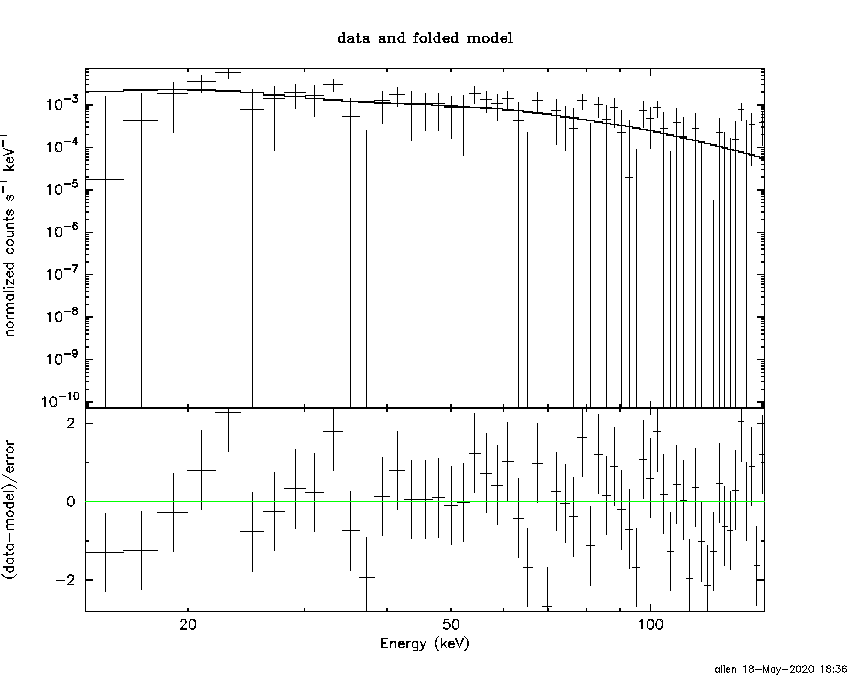
Time interval is from    8.052 sec. to    9.052 sec.
XSPEC12>exit
 XSPEC: quit


Photon index: -1.30127     ( -0.364142   0.373948 )
------------------------------------------------------------
Parameters  : value       lower 90%   higher 90%
Photon index: 1.30127     ( -0.373948   0.364142 )
Norm@50keV  : 5.86953E-03    ( -0.00132906   0.00132552 )
------------------------------------------------------------

Photon flux (15-150 keV)    in 1 sec: 0.700427 ( -0.159503  0.159912 ) ph/cm2/s
Energy fluence (15-150 keV)             : 5.79896e-08 ( -1.44163e-08  1.47197e-08 ) ergs/cm2
Cutoff power-law model

Time interval is from    8.052 sec. to    9.052 sec.
 XSPEC: quit


Photon index: -0.203971     ( -1.26409   2.19253 )
------------------------------------------------------------
Parameters  : value       lower 90%   higher 90%
Photon index: 0.203971     ( -2.19253   1.26409 )
Epeak [keV] : 78.7575      ( -28.2282 -78.7575 )
Norm@50keV  : 2.19539E-02    ( -0.0219538   0.261604 )
------------------------------------------------------------

Photon flux (15-150 keV)    in 1 sec: 0.674839 ( -0.16324  0.16394 ) ph/cm2/s
Energy fluence (15-150 keV)             : 5.27036e-08 ( -1.52908e-08  1.64285e-08 ) ergs/cm2
Time-resolved spectra
Distribution
T90 vs. Hardness ratio plot
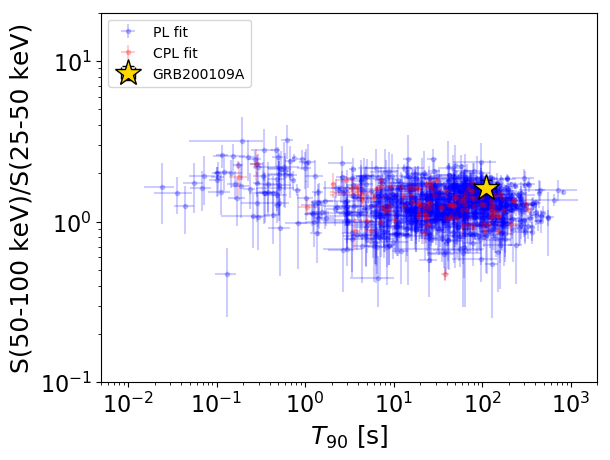
T90                                   = 112.0 sec.
Hardness ratio (energy fluence ratio) = 1.61889963481
S(15-50 keV) vs. S(50-150 keV) plot
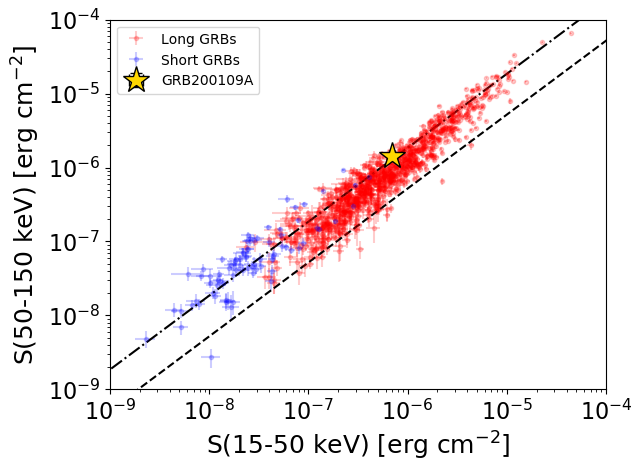
S(15-50 keV)  = 7.024551e-07
S(50-150 keV) = 1.4198101e-06
The dash-dotted line and the dashed line traces the fluences calculated from the Band function with Epeak = 15 and 150 keV, respectively. Both lines assume a canonical values of alpha = -1 and beta = -2.5.
Mask shadow pattern
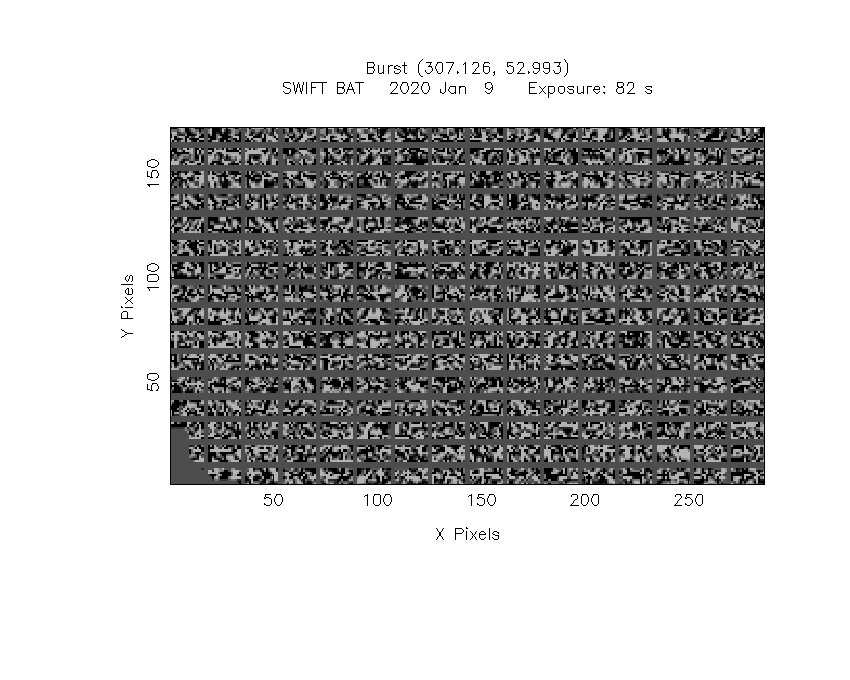
IMX = -2.721954509414319E-01, IMY = 4.470945750418586E-04
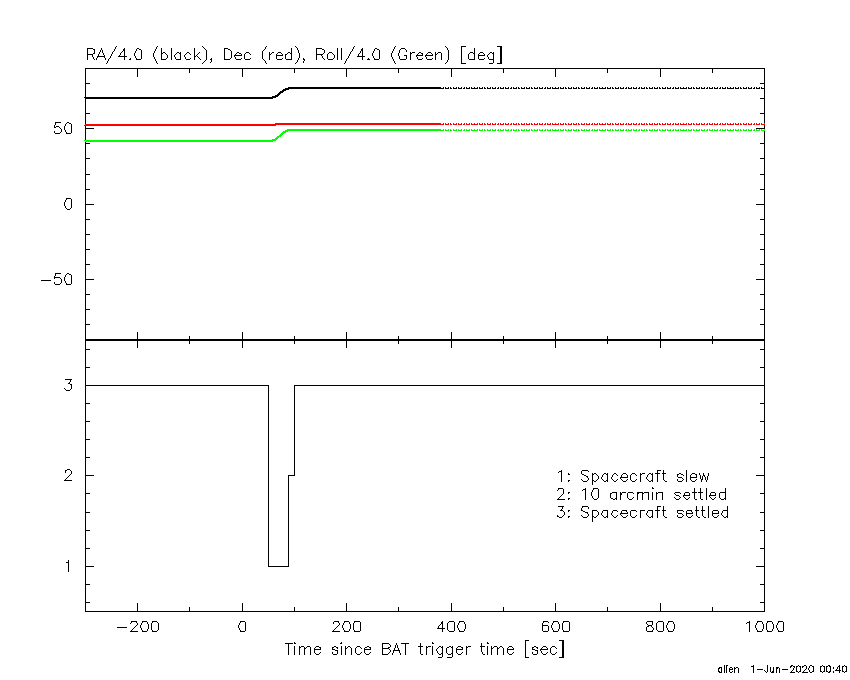
Spacecraft aspect plot
Bright source in the pre-burst/pre-slew/post-slew images
Pre-burst image of 15-350 keV band
Time interval of the image:
-239.448000 -31.448000

# RAcent  DECcent POSerr Theta    Phi  PeakCts   SNR AngSep     Name
#  [deg]    [deg]    ['] [deg]  [deg]                   [']
254.4644  35.3360  404.5  25.8  -17.9   0.0066   0.0    0.5	Her X-1
299.6511  35.1615    3.4  21.3 -120.8   0.9424   3.4    3.8	Cyg X-1
308.0308  41.1017    6.2  21.0 -145.5  -0.4177  -1.9    9.6	Cyg X-3
326.2176  38.1773   41.9  33.6 -160.5   0.0838   0.3    8.9	Cyg X-2
 40.0314  81.4553    2.3  42.2  113.7   4.7675   4.9 ------	UNKNOWN
235.4964  20.3405    2.1  47.9  -11.4   2.3405   5.4 ------	UNKNOWN
277.8106  10.3284    3.1  42.2  -71.6   3.8372   3.7 ------	UNKNOWN
Pre-slew background subtracted image of 15-350 keV band
Time interval of the image:
-31.448000 50.652600

# RAcent  DECcent POSerr Theta    Phi  PeakCts   SNR AngSep     Name
#  [deg]    [deg]    ['] [deg]  [deg]                   [']
254.6980  35.3037   81.6  25.7  -18.3   0.0207   0.1   12.0	Her X-1
299.5734  35.3336    9.2  21.2 -120.9   0.1993   1.3    8.0	Cyg X-1
308.1433  41.0942   16.8  21.1 -145.6   0.0947   0.7    8.6	Cyg X-3
325.9260  38.2450    0.0  33.4 -160.3   0.1520   1.0   12.4	Cyg X-2
307.1151  52.9891    0.5  15.2 -179.9   3.0568  24.2 ------	UNKNOWN
237.3201  11.8851    2.6  53.9  -19.4   1.9711   4.5 ------	UNKNOWN
328.1570  15.0088    2.2  52.2 -139.6   3.5139   5.3 ------	UNKNOWN
Post-slew image of 15-350 keV band
Time interval of the image:
89.252590 962.593700

# RAcent  DECcent POSerr Theta    Phi  PeakCts   SNR AngSep     Name
#  [deg]    [deg]    ['] [deg]  [deg]                   [']
254.4644  35.3502   68.1  40.6  -20.4  -0.1868  -0.2    0.6	Her X-1
299.5628  35.1686    2.4  18.6  -86.6   4.7188   4.8    2.4	Cyg X-1
308.1928  41.0200    4.7  12.0 -110.1   1.9887   2.4    5.5	Cyg X-3
326.1256  38.4029    3.6  19.6 -155.7   2.4574   3.2    5.3	Cyg X-2
 41.0307  74.7226    3.9  40.6   97.5   8.5783   3.0 ------	UNKNOWN
230.2918  35.6158    4.0  54.8   -1.9   7.7537   2.9 ------	UNKNOWN
354.1965  11.9970    2.9  55.5 -166.7  10.4748   4.0 ------	UNKNOWN