Analysis Summary
Notes:
- 1) No attempt has been made to eliminate the non-significant decimal places.
- 2) This batgrbproduct analysis is done using the HEASARC data.
- 3) This batgrbproduct analysis is using the flight position for the mask-weighting calculation.
======================================================================
BAT GRB EVENT DATA PROCESSING REPORT
Process Script Ver: batgrbproduct v2.47
Process Start Time: Mon May 18 15:01:12 EDT 2020
Host Name: bat1
Current Working Dir: /local/data/bat1/alien/Swift_3rdBATcatalog/event/batevent_reproc/trigger949361
======================================================================
Trigger: 00949361 Segment: 000
BAT Trigger Time: 600781848 [s; MET]
Trigger Stop: 600781912 [s; MET]
UTC: 2020-01-15T11:50:23.734140 [includes UTCF correction]
Where From?: TDRSS position message
BAT
RA: 56.4539329277401 Dec: 5.61281785041262 [deg; J2000]
Catalogged Source?: NO
Point Source?: YES
GRB Indicated?: YES [ by BAT flight software ]
Image S/N Ratio: 15.01
Image Trigger?: YES
Rate S/N Ratio: 0 [ if not an image trigger ]
Image S/N Ratio: 15.01
Analysis Position: [ source = BAT ]
RA: 56.4539329277401 Dec: 5.61281785041262 [deg; J2000]
Refined Position: [ source = BAT pre-slew burst ]
RA: 56.4518326005438 Dec: 5.60776455911605 [deg; J2000]
{ 03h 45m 48.4s , +05d 36' 28.0" }
+/- 1.13035909116946 [arcmin] (estimated 90% radius based on SNR)
+/- 0.377095709742856 [arcmin] (formal 1-sigma fit error)
SNR: 25.5325920508074
Angular difference between the analysis and refined position is 0.328113 arcmin
Partial Coding Fraction: 0.828125 [ including projection effects ]
Duration
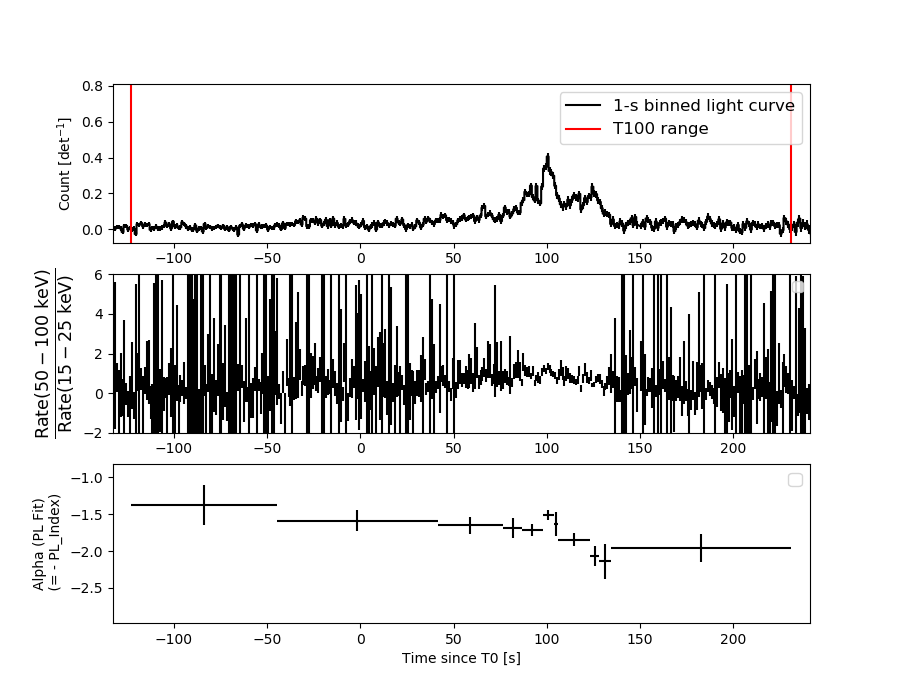
T90: 242.139999985695 +/- 27.2340727025964
Measured from: -54.3519999980927
to: 187.787999987602 [s; relative to TRIGTIME]
T50: 64.067999958992 +/- 6.30407527055165
Measured from: 56.2680000066757
to: 120.335999965668 [s; relative to TRIGTIME]
Fluence
Peak Flux (peak 1 second)
Measured from: 99.7480000257492
to: 100.748000025749 [s; relative to TRIGTIME]
Total Fluence
Measured from: -122.904000043869
to: 231.18799996376 [s; relative to TRIGTIME]
Band 1 Band 2 Band 3 Band 4
15-25 25-50 50-100 100-350 keV
Total 5.675779 7.322475 4.753215 0.782666
0.156855 0.162595 0.139983 0.118669 [error]
Peak 0.115763 0.148657 0.151272 0.029834
0.010487 0.011775 0.010501 0.007492 [error]
[ fluence units of on-axis counts / fully illuminated detector ]
======================================================================
====== Table of the duration information =============================
Value tstart tstop
T100 354.092 -122.904 231.188
T90 242.140 -54.352 187.788
T50 64.068 56.268 120.336
Peak 1.000 99.748 100.748
====== Spectral Analysis Summary =====================================
Model : spectral model: simple power-law (PL) and cutoff power-law (CPL)
Ph_index : photon index: E^{Ph_index}
Ph_90err : 90% error of the photon index
Epeak : Epeak in keV
Epeak_90err: 90% error of Epeak
Norm : normalization at 50 keV in both the PL model and CPL model
Nomr_90err : 90% error of the normalization
chi2 : Chi-Squared
dof : degree of freedo
=== Time-averaged spectral analysis ===
(Best model with acceptable fit: CPL)
Model Ph_index Ph_90err_low Ph_90err_hi Epeak Epeak_90err_low Epeak_90err_hi Norm Nomr_90err_low Norm_90err_hi chi2 dof
PL -1.774 -0.055 0.055 - - - 3.42e-03 -1.03e-04 1.03e-04 53.920 57
CPL -1.212 -0.236 0.249 70.826 -8.354 16.335 6.46e-03 -1.48e-03 2.05e-03 36.190 56
=== 1-s peak spectral analysis ===
(Best model with acceptable fit: PL)
Model Ph_index Ph_90err_low Ph_90err_hi Epeak Epeak_90err_low Epeak_90err_hi Norm Nomr_90err_low Norm_90err_hi chi2 dof
PL -1.391 -0.127 0.127 - - - 2.95e-02 -2.28e-03 2.28e-03 60.840 57
CPL -0.812 -0.509 0.574 111.445 -31.086 323.213 5.55e-02 -2.32e-02 4.57e-02 56.990 56
=== Fluence/Peak Flux Summary ===
Model Band1 Band2 Band3 Band4 Band5 Total
15-25 25-50 50-100 100-350 15-150 15-350 keV
Fluence PL 1.99e-06 3.10e-06 3.63e-06 8.19e-06 1.11e-05 1.69e-05 erg/cm2
90%_error_low -1.06e-07 -9.78e-08 -1.44e-07 -6.89e-07 -3.43e-07 -7.94e-07 erg/cm2
90%_error_hi 1.08e-07 9.75e-08 1.44e-07 7.31e-07 3.43e-07 8.24e-07 erg/cm2
Peak flux PL 1.09e+00 1.17e+00 8.94e-01 1.11e+00 3.58e+00 4.27e+00 ph/cm2/s
90%_error_low -1.47e-01 -1.01e-01 -8.21e-02 -1.95e-01 -2.85e-01 -3.34e-01 ph/cm2/s
90%_error_hi 1.53e-01 1.00e-01 8.14e-02 2.17e-01 2.85e-01 3.35e-01 ph/cm2/s
Fluence CPL 1.78e-06 3.23e-06 3.73e-06 3.94e-06 1.06e-05 1.27e-05 erg/cm2
90%_error_low -1.33e-07 -1.13e-07 -1.57e-07 -9.41e-07 -3.95e-07 -1.03e-06 erg/cm2
90%_error_hi 1.35e-07 1.14e-07 1.58e-07 1.30e-06 3.95e-07 1.35e-06 erg/cm2
Peak flux CPL 9.62e-01 1.23e+00 9.58e-01 6.54e-01 3.51e+00 3.80e+00 ph/cm2/s
90%_error_low -1.82e-01 -1.15e-01 -1.00e-01 -2.35e-01 -2.93e-01 -3.89e-01 ph/cm2/s
90%_error_hi 1.88e-01 1.17e-01 1.02e-01 3.96e-01 2.93e-01 4.73e-01 ph/cm2/s
======================================================================
Image
Pre-slew 15.0-350.0 keV image (Event data)
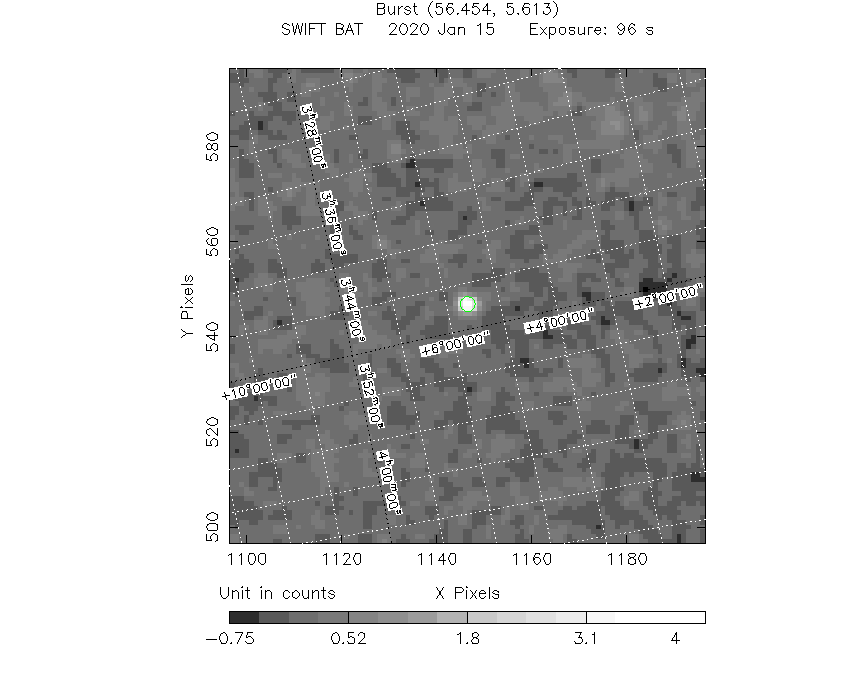
#   RAcent    DECcent   POSerr    Theta     Phi              Peak Cts       SNR   Name
   56.4518     5.6078   0.0075    30.1069  -165.2481         4.6212126     25.533 TRIG_00949361

Foreground time interval of the image:
-10.899  84.701 (delta_t =  95.600 [sec])
Background time interval of the image:
Light Curves
Note: The mask-weighted lightcurves have units of either count/det or counts/sec/det, where a det is 0.4 x 0.4 = 0.16 sq cm.
Full-time range; 1 s binning
Other quick-look light curves:
- 64 ms binning (zoomed)
- 16 ms binning (zoomed)
- 8 ms binning (zoomed)
- 2 ms binning (zoomed)
- SN=5 or 10 s binning (full-time range)
- Raw light curve
Spectra
- 64 ms binning (zoomed)
- 16 ms binning (zoomed)
- 8 ms binning (zoomed)
- 2 ms binning (zoomed)
- SN=5 or 10 s binning (full-time range)
- Raw light curve
Spectra
Notes:
- 1) The fitting includes the systematic errors.
- 2) When the burst includes telescope slew time periods, the fitting uses an average response file made from multiple 5-s response files through out the slew time plus single time preiod for the non-slew times, and weighted by the total counts in the corresponding time period using addrmf. An average response file is needed becuase a spectral fit using the pre-slew DRM will introduce some errors in both a spectral shape and a normalization if the PHA file contains a lot of the slew/post-slew time interval.
- 3) For fits to more complicated models (e.g. a power-law over a cutoff power-law), the BAT team has decided to require a chi-square improvement of more than 6 for each extra dof.
Time averaged spectrum fit using the average DRM
Power-law model
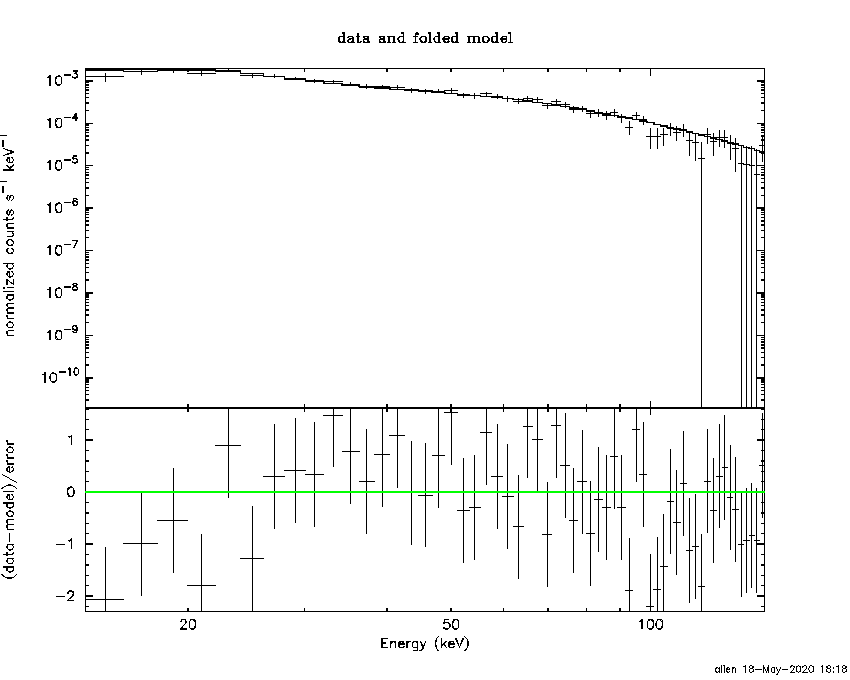
Multiple GTIs in the spectrum
tstart tstop
-122.904000 148.626800
150.000000 231.188000
XSPEC12>exit
 XSPEC: quit


Photon index: -1.77401     ( -0.0553888   0.0551125 )
------------------------------------------------------------
Parameters  : value       lower 90%   higher 90%
Photon index: 1.77401     ( -0.0551125   0.0553888 )
Norm@50keV  : 3.42302E-03    ( -0.000103211   0.000103058 )
------------------------------------------------------------

Photon flux (15-150 keV)    in 352.7 sec: 0.467039 ( -0.015092  0.015143 ) ph/cm2/s
Energy fluence (15-150 keV)             : 1.1128e-05 ( -3.42587e-07  3.43407e-07 ) ergs/cm2
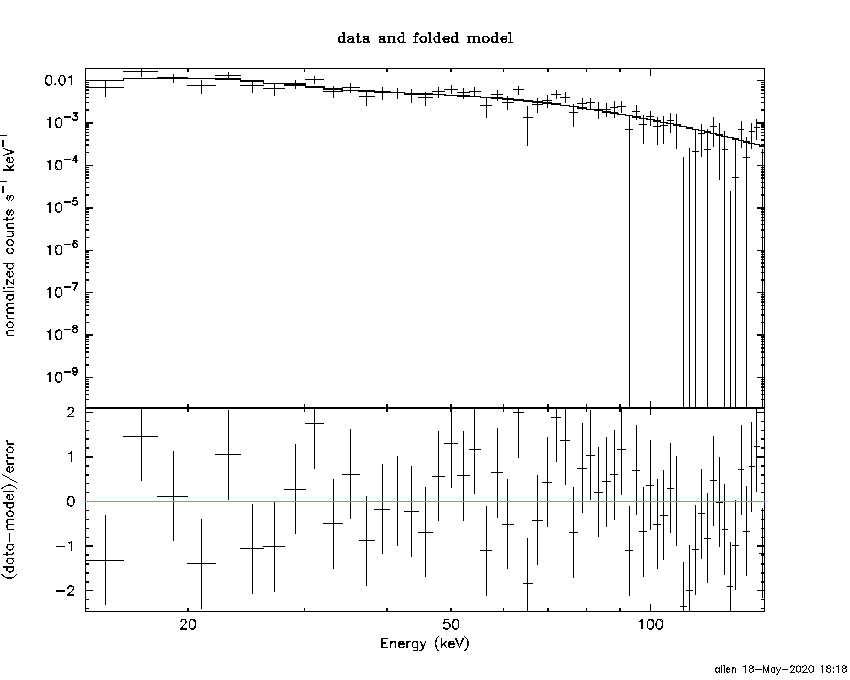
Cutoff power-law model

Multiple GTIs in the spectrum
tstart tstop
-122.904000 148.626800
150.000000 231.188000
 XSPEC: quit


Photon index: -1.21205     ( -0.236036   0.249358 )
------------------------------------------------------------
Parameters  : value       lower 90%   higher 90%
Photon index: 1.21205     ( -0.249358   0.236036 )
Epeak [keV] : 70.8263      ( -8.35355 16.3353 )
Norm@50keV  : 6.45937E-03    ( -0.00147924   0.00205247 )
------------------------------------------------------------

Photon flux (15-150 keV)    in 352.7 sec: 0.448127 ( -0.016735  0.016806 ) ph/cm2/s
Energy fluence (15-150 keV)             : 1.06447e-05 ( -3.94932e-07  3.94922e-07 ) ergs/cm2
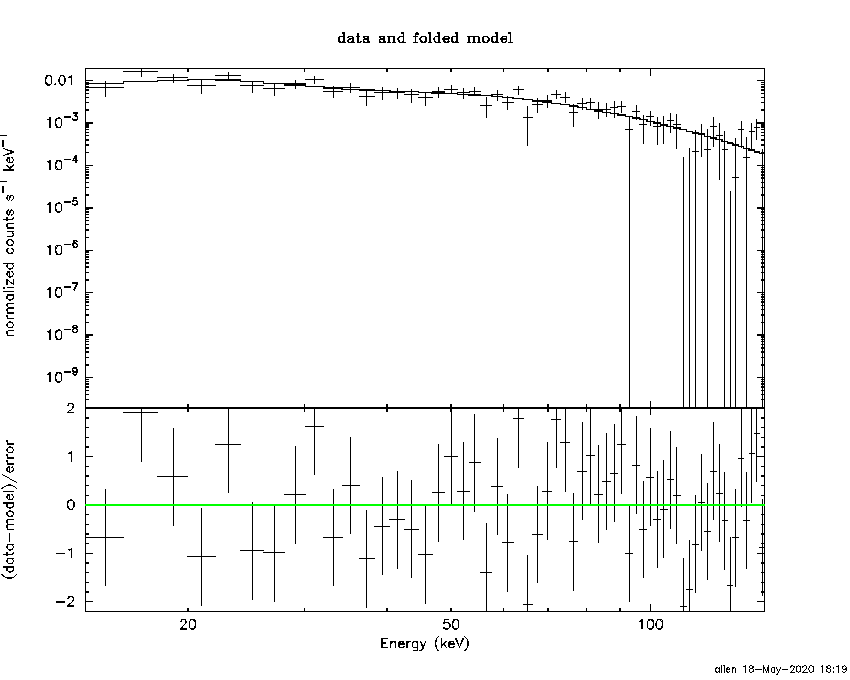
1-s peak spectrum fit
Power-law model
Time interval is from   99.748 sec. to  100.748 sec.
XSPEC12>exit
 XSPEC: quit


Photon index: -1.39135     ( -0.127255   0.126818 )
------------------------------------------------------------
Parameters  : value       lower 90%   higher 90%
Photon index: 1.39135     ( -0.126818   0.127255 )
Norm@50keV  : 2.94505E-02    ( -0.00227859   0.00227567 )
------------------------------------------------------------

Photon flux (15-150 keV)    in 1 sec: 3.57961 ( -0.28501  0.28542 ) ph/cm2/s
Energy fluence (15-150 keV)             : 2.85115e-07 ( -2.38868e-08  2.39928e-08 ) ergs/cm2
Cutoff power-law model
Time interval is from   99.748 sec. to  100.748 sec.
 XSPEC: quit


Photon index: -0.811558     ( -0.508641   0.573597 )
------------------------------------------------------------
Parameters  : value       lower 90%   higher 90%
Photon index: 0.811558     ( -0.573597   0.508641 )
Epeak [keV] : 111.445      ( -31.0865 323.213 )
Norm@50keV  : 5.55027E-02    ( -0.0232214   0.0456659 )
------------------------------------------------------------

Photon flux (15-150 keV)    in 1 sec: 3.50811 ( -0.29286  0.29261 ) ph/cm2/s
Energy fluence (15-150 keV)             : 2.78914e-07 ( -2.48284e-08  2.48386e-08 ) ergs/cm2
Time-resolved spectra
Distribution
T90 vs. Hardness ratio plot
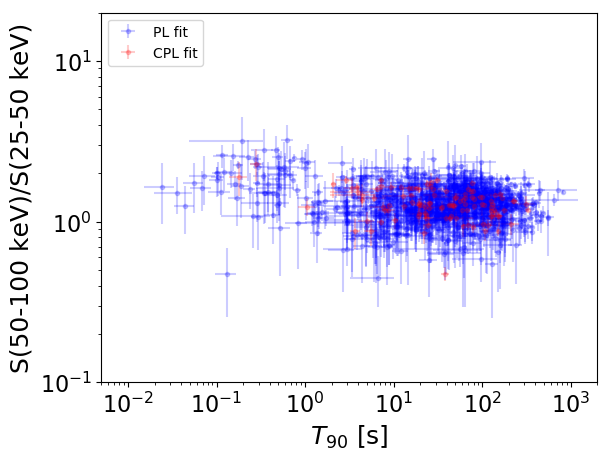
T90                                   = N/A sec.
Hardness ratio (energy fluence ratio) = N/A
S(15-50 keV) vs. S(50-150 keV) plot
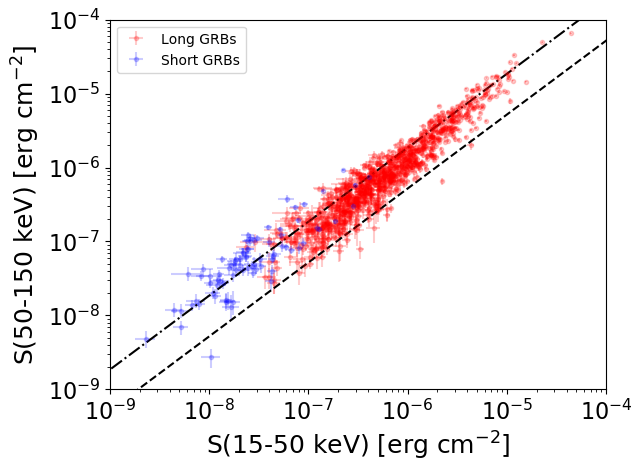
S(15-50 keV)  = N/A
S(50-150 keV) = N/A
The dash-dotted line and the dashed line traces the fluences calculated from the Band function with Epeak = 15 and 150 keV, respectively. Both lines assume a canonical values of alpha = -1 and beta = -2.5.
Mask shadow pattern
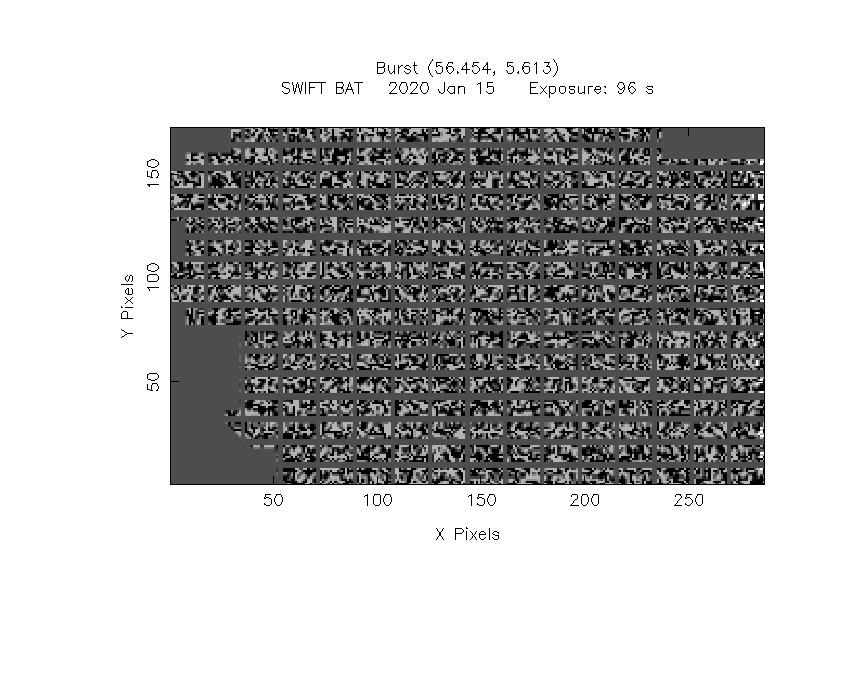
IMX = -5.607287817869183E-01, IMY = 1.476473434765085E-01
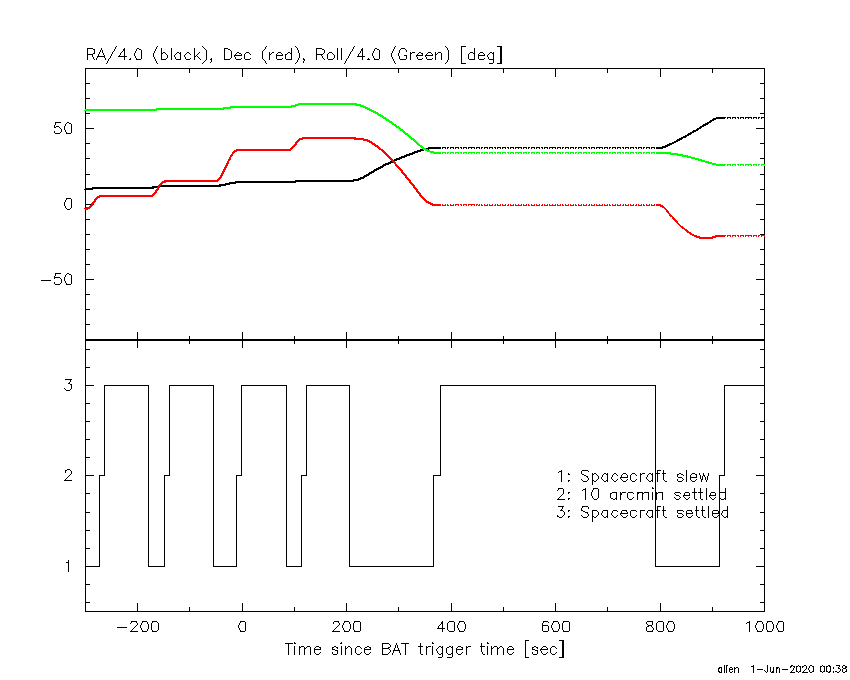
Spacecraft aspect plot
Bright source in the pre-burst/pre-slew/post-slew images
Pre-burst image of 15-350 keV band
Time interval of the image:
Pre-slew background subtracted image of 15-350 keV band
Time interval of the image:
-10.899400 84.700600

# RAcent  DECcent POSerr Theta    Phi  PeakCts   SNR AngSep     Name
#  [deg]    [deg]    ['] [deg]  [deg]                   [']
 83.6412  22.0171    0.7  26.3  126.3   3.7519  16.8    0.5	Crab
 17.7203  76.4124    3.0  44.5   -0.4   1.2008   3.9 ------	UNKNOWN
 56.4518   5.6077    0.5  30.1 -165.2   4.6210  25.6 ------	UNKNOWN
 53.4295   2.2978    3.1  33.6 -160.0   0.7355   3.8 ------	UNKNOWN
329.8511  59.4692    2.9  58.9  -24.3   4.6618   4.0 ------	UNKNOWN
 26.6600   0.8002    3.0  45.3 -121.3   2.9980   3.8 ------	UNKNOWN
Post-slew image of 15-350 keV band
Time interval of the image:
113.500590 148.626800
150.000000 204.700600

# RAcent  DECcent POSerr Theta    Phi  PeakCts   SNR AngSep     Name
#  [deg]    [deg]    ['] [deg]  [deg]                   [']
 83.6547  22.0056    0.7  27.9  138.6   3.4546  16.7    1.3	Crab
116.0010  40.1874    2.6  39.4   80.6   2.9615   4.4 ------	UNKNOWN
 99.7764  15.9907    3.8  42.0  123.9   1.8590   3.0 ------	UNKNOWN
 57.6124  61.5941    2.8  18.2   -2.4   0.6727   4.2 ------	UNKNOWN
 65.7142 -14.0225    2.1  57.7 -179.1   5.3588   5.6 ------	UNKNOWN
 61.9003   0.7548    2.7  42.8 -174.6   1.1343   4.3 ------	UNKNOWN
 48.8447  43.0228    2.6   9.8  -83.9   0.6847   4.4 ------	UNKNOWN
 56.4397   5.6105    0.5  38.3 -165.8   5.1991  24.6 ------	UNKNOWN