Analysis Summary
Notes:
- 1) No attempt has been made to eliminate the non-significant decimal places.
- 2) This batgrbproduct analysis is done using the HEASARC data.
- 3) This batgrbproduct analysis is using the flight position for the mask-weighting calculation.
======================================================================
                  BAT GRB EVENT DATA PROCESSING REPORT
    Process Script Ver: batgrbproduct v2.47
    Process Start Time: Mon May 18 14:59:11 EDT 2020
             Host Name: bat1
   Current Working Dir: /local/data/bat1/alien/Swift_3rdBATcatalog/event/batevent_reproc/trigger950330
======================================================================

  Trigger: 00950330      Segment: 000

  BAT Trigger Time: 601350084.672   [s; MET]
      Trigger Stop: 601350085.184   [s; MET]
               UTC: 2020-01-22T01:41:00.369360    [includes UTCF correction]
       Where From?: TDRSS position message

  BAT
    RA: 209.981071360137   Dec: 27.5655722784293  [deg; J2000]

     Catalogged Source?: NO
     Point Source?:      YES
     GRB Indicated?:     YES    [ by BAT flight software ]
     Image S/N Ratio:    11.46
     Image Trigger?:     NO
     Rate S/N Ratio:     20.0997512422418  [ if not an image trigger ]
     Image S/N Ratio:    11.46

  Analysis Position:   [ source = BAT ]
    RA: 209.981071360137   Dec: 27.5655722784293  [deg; J2000]

  Refined Position:   [ source = BAT pre-slew burst ]
    RA: 210.011650510127   Dec: 27.5474091429259  [deg; J2000]
        { 14h 00m 02.8s , +27d 32' 50.7" }
         +/- 0.641947341924366 [arcmin] (estimated 90% radius based on SNR)
         +/- 0.205608609553126 [arcmin] (formal 1-sigma fit error)
    SNR: 57.2953306502242

  Angular difference between the analysis and refined position is 1.957929 arcmin

  Partial Coding Fraction: 0.78125    [ including projection effects ]

  Duration
     T90: 190.595999956131 +/- 4.51451347
        Measured from: 1.88399994373322
                   to: 192.479999899864     [s; relative to TRIGTIME]
     T50: 18.7999999523163 +/- 1.13329958254393
        Measured from: 8.7279999256134
                   to: 27.5279998779297     [s; relative to TRIGTIME]


  Fluence
     Peak Flux  (peak 1 second)
        Measured from: 10.1799999475479
                   to: 11.1799999475479     [s; relative to TRIGTIME]
     Total Fluence
        Measured from: -8.82000005245209
                   to: 229.075999975204     [s; relative to TRIGTIME]

             Band 1     Band 2     Band 3     Band 4
              15-25      25-50     50-100    100-350     keV
 Total     5.488153   6.752031   4.933901   1.181403
           0.114260   0.119561   0.104084   0.086199 [error]
 Peak      0.220643   0.385478   0.405462   0.119006
           0.012488   0.015301   0.015030   0.010682 [error]

     [ fluence units of on-axis counts / fully illuminated detector ]

======================================================================


====== Table of the duration information =============================

        Value   tstart    tstop
T100  237.896   -8.820  229.076
T90   190.596    1.884  192.480
T50    18.800    8.728   27.528
Peak    1.000   10.180   11.180


====== Spectral Analysis Summary =====================================

Model      : spectral model: simple power-law (PL) and cutoff power-law (CPL)
Ph_index   : photon index: E^{Ph_index}
Ph_90err   : 90% error of the photon index
Epeak      : Epeak in keV
Epeak_90err: 90% error of Epeak
Norm       : normalization at 50 keV in both the PL model and CPL model
Nomr_90err : 90% error of the normalization
chi2       : Chi-Squared
dof        : degree of freedo

=== Time-averaged spectral analysis ===
(Best model with acceptable fit: PL)

Model Ph_index Ph_90err_low Ph_90err_hi  Epeak  Epeak_90err_low  Epeak_90err_hi  Norm       Nomr_90err_low    Norm_90err_hi    chi2    dof
PL      -1.608    -0.046      0.046       -           -               -         5.04e-03     -1.17e-04          1.17e-04      43.310   57
CPL     -1.533    -0.101      0.184      345.794    -345.794      -345.794      5.44e-03     -4.97e-04          1.12e-03      42.810   56


=== 1-s peak spectral analysis ===
(Best model with acceptable fit: N/A)

Model Ph_index Ph_90err_low Ph_90err_hi  Epeak  Epeak_90err_low  Epeak_90err_hi  Norm       Nomr_90err_low    Norm_90err_hi    chi2    dof
PL      -1.138     -0.071     0.072       -           -               -         7.82e-02     -3.23e-03          3.23e-03      44.730   57
CPL     -0.772     -0.287     0.307      190.276     -61.599       427.094      1.15e-01     -2.91e-02          4.17e-02      39.940   56


=== Fluence/Peak Flux Summary ===

              Model    Band1     Band2     Band3     Band4     Band5     Total
                       15-25     25-50    50-100    100-350    15-150    15-350    keV
Fluence         PL   1.69e-06  2.91e-06  3.82e-06  1.02e-05  1.12e-05  1.86e-05   erg/cm2
      90%_error_low -8.11e-08 -7.98e-08 -1.12e-07 -6.80e-07 -2.70e-07 -7.35e-07   erg/cm2
      90%_error_hi   8.29e-08  7.96e-08  1.12e-07  7.13e-07  2.71e-07  7.60e-07   erg/cm2
Peak flux       PL   6.00e-04  9.12e-03  1.06e-01  9.21e+00  4.77e-01  9.24e+00   ph/cm2/s
      90%_error_low     N/A       N/A       N/A       N/A       N/A       N/A     ph/cm2/s
      90%_error_hi      N/A       N/A       N/A       N/A       N/A       N/A     ph/cm2/s

Fluence        CPL   1.66e-06  2.92e-06  3.84e-06  9.21e-06  1.11e-05  1.76e-05   erg/cm2
      90%_error_low -1.09e-07 -8.37e-08 -1.23e-07 -1.94e-06 -3.06e-07 -1.97e-06   erg/cm2
      90%_error_hi   8.59e-08  8.40e-08  1.24e-07  1.72e-06  3.05e-07  1.24e-06   erg/cm2
Peak flux      CPL   2.08e+00  2.91e+00  2.70e+00  2.86e+00  8.97e+00  1.05e+01   ph/cm2/s
      90%_error_low -2.34e-01 -1.55e-01 -1.49e-01 -6.70e-01 -4.02e-01 -7.93e-01   ph/cm2/s
      90%_error_hi   2.40e-01  1.56e-01  1.51e-01  9.32e-01  4.03e-01  9.97e-01   ph/cm2/s

======================================================================
Image
Pre-slew 15.0-350.0 keV image (Event data)
#   RAcent    DECcent   POSerr    Theta     Phi              Peak Cts       SNR   Name
  210.0117    27.5474   0.0034    31.0486  -156.8966         5.5724251     57.295 TRIG_00950330

Foreground time interval of the image:
 -8.820  10.229 (delta_t =  19.049 [sec])
Background time interval of the image:
-239.672  -8.820 (delta_t = 230.852 [sec])
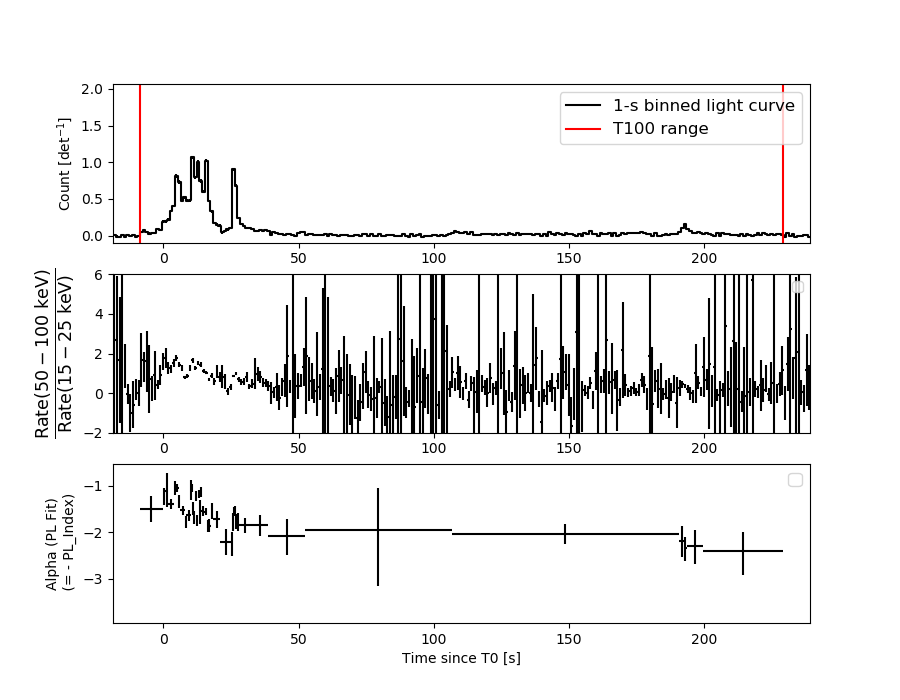
Light Curves
Note: The mask-weighted lightcurves have units of either count/det or counts/sec/det, where a det is 0.4 x 0.4 = 0.16 sq cm.
Full-time range; 1 s binning
Other quick-look light curves:
- 64 ms binning (zoomed)
- 16 ms binning (zoomed)
- 8 ms binning (zoomed)
- 2 ms binning (zoomed)
- SN=5 or 10 s binning (full-time range)
- Raw light curve
Spectra
- 64 ms binning (zoomed)
- 16 ms binning (zoomed)
- 8 ms binning (zoomed)
- 2 ms binning (zoomed)
- SN=5 or 10 s binning (full-time range)
- Raw light curve
Spectra
Notes:
- 1) The fitting includes the systematic errors.
- 2) When the burst includes telescope slew time periods, the fitting uses an average response file made from multiple 5-s response files through out the slew time plus single time preiod for the non-slew times, and weighted by the total counts in the corresponding time period using addrmf. An average response file is needed becuase a spectral fit using the pre-slew DRM will introduce some errors in both a spectral shape and a normalization if the PHA file contains a lot of the slew/post-slew time interval.
- 3) For fits to more complicated models (e.g. a power-law over a cutoff power-law), the BAT team has decided to require a chi-square improvement of more than 6 for each extra dof.
Time averaged spectrum fit using the average DRM
Power-law model
Time interval is from   -8.820 sec. to  229.076 sec.
XSPEC12>exit
 XSPEC: quit


Photon index: -1.6079     ( -0.0462334   0.046169 )
------------------------------------------------------------
Parameters  : value       lower 90%   higher 90%
Photon index: 1.60790     ( -0.046169   0.0462334 )
Norm@50keV  : 5.03621E-03    ( -0.000117471   0.000117463 )
------------------------------------------------------------

Photon flux (15-150 keV)    in 237.9 sec: 0.648793 ( -0.017439  0.017513 ) ph/cm2/s
Energy fluence (15-150 keV)             : 1.11958e-05 ( -2.70461e-07  2.70806e-07 ) ergs/cm2
Cutoff power-law model
Time interval is from   -8.820 sec. to  229.076 sec.
 XSPEC: quit


Photon index: -1.53349     ( -0.101333   0.184252 )
------------------------------------------------------------
Parameters  : value       lower 90%   higher 90%
Photon index: 1.53349     ( -0.184252   0.101333 )
Epeak [keV] : 345.794      ( -345.801 -345.801 )
Norm@50keV  : 5.44326E-03    ( -0.000496635   0.00112127 )
------------------------------------------------------------

Photon flux (15-150 keV)    in 237.9 sec: 0.644519 ( -0.02001  0.019447 ) ph/cm2/s
Energy fluence (15-150 keV)             : 1.11354e-05 ( -3.05961e-07  3.04598e-07 ) ergs/cm2
1-s peak spectrum fit
Power-law model
Time interval is from   10.180 sec. to   11.180 sec.
XSPEC12>exit
 XSPEC: quit


Photon index: -1.13804     ( -0.0712034   0.0715814 )
------------------------------------------------------------
Parameters  : value       lower 90%   higher 90%
Photon index: 1.13804     ( -0.0715814   0.0712034 )
Norm@50keV  : 7.81800E-02    ( -0.00323421   0.00323324 )
------------------------------------------------------------

Photon flux (15-150 keV)    in 1 sec: 0.476923 (    ) ph/cm2/s
Energy fluence (15-150 keV)             : 8.0783e-07 ( -3.63761e-08  3.64568e-08 ) ergs/cm2
Cutoff power-law model
Time interval is from   10.180 sec. to   11.180 sec.
 XSPEC: quit


Photon index: -0.772387     ( -0.287296   0.306874 )
------------------------------------------------------------
Parameters  : value       lower 90%   higher 90%
Photon index: 0.772387     ( -0.306874   0.287296 )
Epeak [keV] : 190.276      ( -61.5992 427.094 )
Norm@50keV  : 0.114545    ( -0.0290724   0.0417011 )
------------------------------------------------------------

Photon flux (15-150 keV)    in 1 sec: 8.97285 ( -0.4025  0.40272 ) ph/cm2/s
Energy fluence (15-150 keV)             : 7.94877e-07 ( -3.83403e-08  3.82093e-08 ) ergs/cm2
Time-resolved spectra
Distribution
T90 vs. Hardness ratio plot
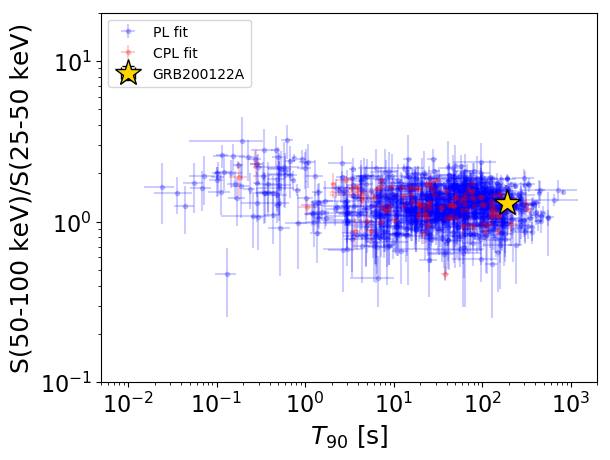
T90                                   = 190.596 sec.
Hardness ratio (energy fluence ratio) = 1.31235101835
S(15-50 keV) vs. S(50-150 keV) plot
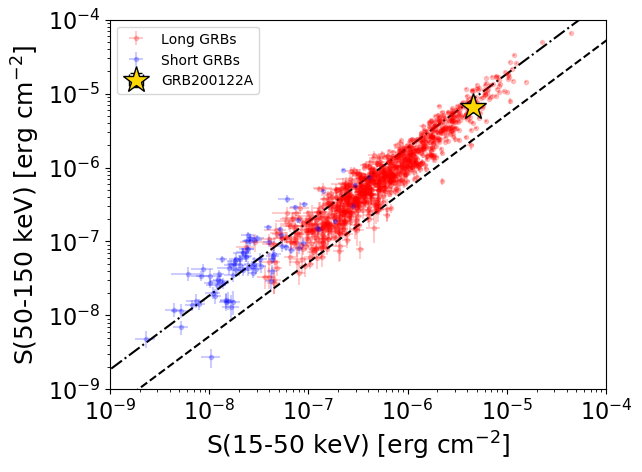
S(15-50 keV)  = 4.605681e-06
S(50-150 keV) = 6.590145e-06
The dash-dotted line and the dashed line traces the fluences calculated from the Band function with Epeak = 15 and 150 keV, respectively. Both lines assume a canonical values of alpha = -1 and beta = -2.5.
Mask shadow pattern
IMX = -5.537327771790653E-01, IMY = 2.362261566597713E-01
Spacecraft aspect plot
Bright source in the pre-burst/pre-slew/post-slew images
Pre-burst image of 15-350 keV band
Time interval of the image:
-239.672000 -8.820000

# RAcent  DECcent POSerr Theta    Phi  PeakCts   SNR AngSep     Name
#  [deg]    [deg]    ['] [deg]  [deg]                   [']
158.3950 -28.9222    3.5  44.2   30.4   1.9804   3.3 ------	UNKNOWN
Pre-slew background subtracted image of 15-350 keV band
Time interval of the image:
-8.820000 10.228620

# RAcent  DECcent POSerr Theta    Phi  PeakCts   SNR AngSep     Name
#  [deg]    [deg]    ['] [deg]  [deg]                   [']
157.9719 -30.4025    2.6  45.4   29.1   1.1057   4.5 ------	UNKNOWN
210.0116  27.5474    0.2  31.0 -156.9   5.5723  57.3 ------	UNKNOWN
214.8421  41.2873    2.5  44.4 -165.5   0.6891   4.7 ------	UNKNOWN
231.7206   0.8079    1.8  41.1  -99.9   2.3308   6.2 ------	UNKNOWN
Post-slew image of 15-350 keV band
Time interval of the image:
61.428590 962.400600
1772.328000 1862.424800

# RAcent  DECcent POSerr Theta    Phi  PeakCts   SNR AngSep     Name
#  [deg]    [deg]    ['] [deg]  [deg]                   [']
254.3911  35.3357    3.6  38.4 -129.0   4.5909   3.2    3.3	Her X-1
190.7315 -15.2267    3.7  46.7    9.9   5.0916   3.2 ------	UNKNOWN
218.0990  52.4126    2.5  25.6  175.6   4.9276   4.6 ------	UNKNOWN
266.9944  35.4583    3.7  48.6 -130.3  12.4742   3.2 ------	UNKNOWN
267.9977  36.5887    2.4  49.3 -131.9  20.5655   4.8 ------	UNKNOWN