Analysis Summary
Notes:
- 1) No attempt has been made to eliminate the non-significant decimal places.
- 2) This batgrbproduct analysis is done using the HEASARC data.
- 3) This batgrbproduct analysis is using the flight position for the mask-weighting calculation.
======================================================================
BAT GRB EVENT DATA PROCESSING REPORT
Process Script Ver: batgrbproduct v2.47
Process Start Time: Mon May 18 14:56:25 EDT 2020
Host Name: bat1
Current Working Dir: /local/data/bat1/alien/Swift_3rdBATcatalog/event/batevent_reproc/trigger952164
======================================================================
Trigger: 00952164 Segment: 000
BAT Trigger Time: 601644723.52 [s; MET]
Trigger Stop: 601644731.712 [s; MET]
UTC: 2020-01-25T11:31:39.198280 [includes UTCF correction]
Where From?: TDRSS position message
BAT
RA: 228.046615901226 Dec: -8.14842299022016 [deg; J2000]
Catalogged Source?: NO
Point Source?: YES
GRB Indicated?: YES [ by BAT flight software ]
Image S/N Ratio: 7.97
Image Trigger?: NO
Rate S/N Ratio: 12.2065556157337 [ if not an image trigger ]
Image S/N Ratio: 7.97
Analysis Position: [ source = BAT ]
RA: 228.046615901226 Dec: -8.14842299022016 [deg; J2000]
Refined Position: [ source = BAT pre-slew burst ]
RA: 228.067911024607 Dec: -8.1430974325944 [deg; J2000]
{ 15h 12m 16.3s , -08d 08' 35.2" }
+/- 1.76284880357712 [arcmin] (estimated 90% radius based on SNR)
+/- 0.77932839887792 [arcmin] (formal 1-sigma fit error)
SNR: 13.532641364843
Angular difference between the analysis and refined position is 1.304554 arcmin
Partial Coding Fraction: 0.4296875 [ including projection effects ]
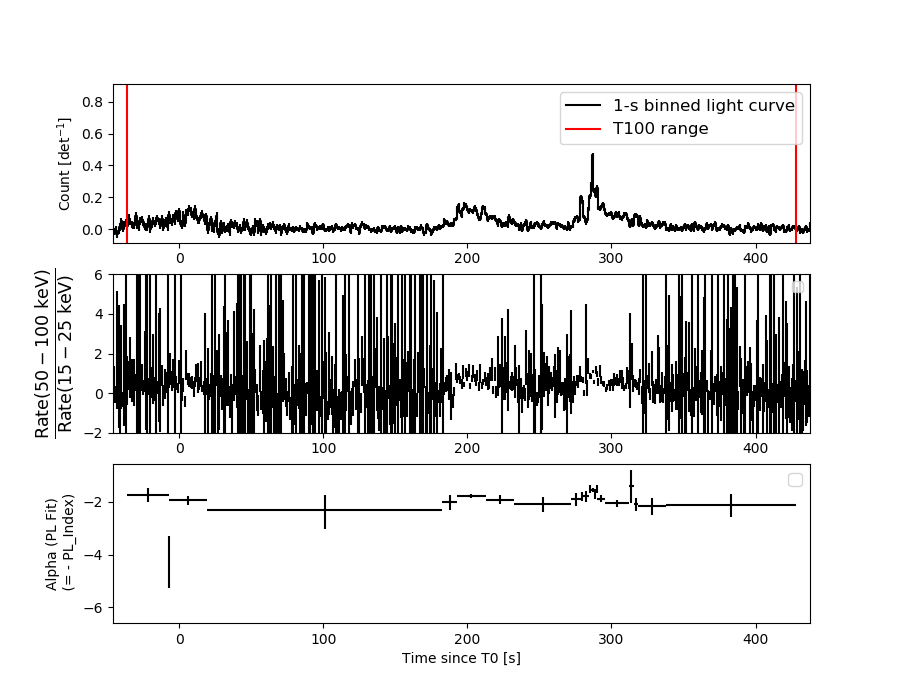
Duration
T90: 350.335999965668 +/- 32.9667786948281
Measured from: -15.472000002861
to: 334.863999962807 [s; relative to TRIGTIME]
T50: 203.567999958992 +/- 97.4935448830085
Measured from: 86.6319999694824
to: 290.199999928474 [s; relative to TRIGTIME]
Fluence
Peak Flux (peak 1 second)
Measured from: 286.667999982834
to: 287.667999982834 [s; relative to TRIGTIME]
Total Fluence
Measured from: -36.2239999771118
to: 427.736000061035 [s; relative to TRIGTIME]
Band 1 Band 2 Band 3 Band 4
15-25 25-50 50-100 100-350 keV
Total 5.754344 6.107282 3.486750 0.325476
0.173227 0.169513 0.160615 0.177839 [error]
Peak 0.134782 0.179606 0.141984 0.019489
0.008327 0.009012 0.008233 0.007304 [error]
[ fluence units of on-axis counts / fully illuminated detector ]
======================================================================
====== Table of the duration information =============================
Value tstart tstop
T100 463.960 -36.224 427.736
T90 350.336 -15.472 334.864
T50 203.568 86.632 290.200
Peak 1.000 286.668 287.668
====== Spectral Analysis Summary =====================================
Model : spectral model: simple power-law (PL) and cutoff power-law (CPL)
Ph_index : photon index: E^{Ph_index}
Ph_90err : 90% error of the photon index
Epeak : Epeak in keV
Epeak_90err: 90% error of Epeak
Norm : normalization at 50 keV in both the PL model and CPL model
Nomr_90err : 90% error of the normalization
chi2 : Chi-Squared
dof : degree of freedo
=== Time-averaged spectral analysis ===
(Best model with acceptable fit: PL)
Model Ph_index Ph_90err_low Ph_90err_hi Epeak Epeak_90err_low Epeak_90err_hi Norm Nomr_90err_low Norm_90err_hi chi2 dof
PL -1.926 -0.080 0.079 - - - 1.97e-03 -8.48e-05 8.42e-05 43.250 57
CPL -1.819 -0.281 0.307 76.929 -76.649 -76.929 2.25e-03 -6.17e-04 9.95e-04 42.860 56
=== 1-s peak spectral analysis ===
(Best model with acceptable fit: CPL)
Model Ph_index Ph_90err_low Ph_90err_hi Epeak Epeak_90err_low Epeak_90err_hi Norm Nomr_90err_low Norm_90err_hi chi2 dof
PL -1.428 -0.098 0.098 - - - 3.09e-02 -1.78e-03 1.77e-03 55.530 57
CPL -0.857 -0.402 0.444 98.824 -23.832 110.031 6.03e-02 -2.22e-02 3.98e-02 49.410 56
=== Fluence/Peak Flux Summary ===
Model Band1 Band2 Band3 Band4 Band5 Total
15-25 25-50 50-100 100-350 15-150 15-350 keV
Fluence PL 1.75e-06 2.48e-06 2.61e-06 5.07e-06 8.43e-06 1.19e-05 erg/cm2
90%_error_low -1.13e-07 -9.27e-08 -1.60e-07 -6.42e-07 -3.52e-07 -7.74e-07 erg/cm2
90%_error_hi 1.16e-07 9.27e-08 1.62e-07 7.08e-07 3.55e-07 8.26e-07 erg/cm2
Peak flux PL 1.19e+00 1.25e+00 9.27e-01 1.11e+00 3.79e+00 4.47e+00 ph/cm2/s
90%_error_low -1.14e-01 -7.47e-02 -6.71e-02 -1.57e-01 -2.14e-01 -2.59e-01 ph/cm2/s
90%_error_hi 1.17e-01 7.44e-02 6.68e-02 1.73e-01 2.14e-01 2.61e-01 ph/cm2/s
Fluence CPL 1.72e-06 2.50e-06 2.60e-06 4.18e-06 8.32e-06 1.10e-05 erg/cm2
90%_error_low -1.37e-07 -1.07e-07 -1.65e-07 -1.64e-06 -4.57e-07 -1.74e-06 erg/cm2
90%_error_hi 1.39e-07 1.10e-07 1.64e-07 1.05e-06 3.65e-07 1.20e-06 erg/cm2
Peak flux CPL 1.07e+00 1.31e+00 9.62e-01 5.85e-01 3.68e+00 3.93e+00 ph/cm2/s
90%_error_low -1.38e-01 -8.84e-02 -7.43e-02 -2.01e-01 -2.26e-01 -3.12e-01 ph/cm2/s
90%_error_hi 1.40e-01 9.00e-02 7.53e-02 3.24e-01 2.26e-01 3.85e-01 ph/cm2/s
======================================================================
Image
Pre-slew 15.0-350.0 keV image (Event data)
#   RAcent    DECcent   POSerr    Theta     Phi              Peak Cts       SNR   Name
  228.0679    -8.1431   0.0142    28.9555   102.3775         3.7006276     13.533 TRIG_00952164

Foreground time interval of the image:
-36.224  51.181 (delta_t =  87.405 [sec])
Background time interval of the image:
-179.520 -36.224 (delta_t = 143.296 [sec])
Light Curves
Note: The mask-weighted lightcurves have units of either count/det or counts/sec/det, where a det is 0.4 x 0.4 = 0.16 sq cm.
Full-time range; 1 s binning
Other quick-look light curves:
- 64 ms binning (zoomed)
- 16 ms binning (zoomed)
- 8 ms binning (zoomed)
- 2 ms binning (zoomed)
- SN=5 or 10 s binning (full-time range)
- Raw light curve
Spectra
- 64 ms binning (zoomed)
- 16 ms binning (zoomed)
- 8 ms binning (zoomed)
- 2 ms binning (zoomed)
- SN=5 or 10 s binning (full-time range)
- Raw light curve
Spectra
Notes:
- 1) The fitting includes the systematic errors.
- 2) When the burst includes telescope slew time periods, the fitting uses an average response file made from multiple 5-s response files through out the slew time plus single time preiod for the non-slew times, and weighted by the total counts in the corresponding time period using addrmf. An average response file is needed becuase a spectral fit using the pre-slew DRM will introduce some errors in both a spectral shape and a normalization if the PHA file contains a lot of the slew/post-slew time interval.
- 3) For fits to more complicated models (e.g. a power-law over a cutoff power-law), the BAT team has decided to require a chi-square improvement of more than 6 for each extra dof.
Time averaged spectrum fit using the average DRM
Power-law model
Time interval is from  -36.224 sec. to  427.736 sec.
XSPEC12>exit
 XSPEC: quit


Photon index: -1.92625     ( -0.0803958   0.0794065 )
------------------------------------------------------------
Parameters  : value       lower 90%   higher 90%
Photon index: 1.92625     ( -0.0794065   0.0803958 )
Norm@50keV  : 1.97480E-03    ( -8.48055e-05   8.41574e-05 )
------------------------------------------------------------

Photon flux (15-150 keV)    in 464 sec: 0.286635 ( -0.011211  0.011264 ) ph/cm2/s
Energy fluence (15-150 keV)             : 8.42884e-06 ( -3.52435e-07  3.55276e-07 ) ergs/cm2
Cutoff power-law model
Time interval is from  -36.224 sec. to  427.736 sec.
 XSPEC: quit


Photon index: -1.81938     ( -0.280538   0.307464 )
------------------------------------------------------------
Parameters  : value       lower 90%   higher 90%
Photon index: 1.81938     ( -0.307464   0.280538 )
Epeak [keV] : 76.9287      ( -76.6492 -76.9287 )
Norm@50keV  : 2.24982E-03    ( -0.000617302   0.000995471 )
------------------------------------------------------------

Photon flux (15-150 keV)    in 464 sec: 0.284136 ( -0.012999  0.012157 ) ph/cm2/s
Energy fluence (15-150 keV)             : 8.3178e-06 ( -4.568e-07  3.65361e-07 ) ergs/cm2
1-s peak spectrum fit
Power-law model
Time interval is from  286.668 sec. to  287.668 sec.
XSPEC12>exit
 XSPEC: quit


Photon index: -1.42834     ( -0.0980997   0.0976247 )
------------------------------------------------------------
Parameters  : value       lower 90%   higher 90%
Photon index: 1.42834     ( -0.0976247   0.0980997 )
Norm@50keV  : 3.09016E-02    ( -0.00177604   0.00177093 )
------------------------------------------------------------

Photon flux (15-150 keV)    in 1 sec: 3.78824 ( -0.21397  0.2141 ) ph/cm2/s
Energy fluence (15-150 keV)             : 2.96955e-07 ( -1.90861e-08  1.92364e-08 ) ergs/cm2
Cutoff power-law model
Time interval is from  286.668 sec. to  287.668 sec.
 XSPEC: quit


Photon index: -0.857137     ( -0.401904   0.444487 )
------------------------------------------------------------
Parameters  : value       lower 90%   higher 90%
Photon index: 0.857137     ( -0.444487   0.401904 )
Epeak [keV] : 98.8243      ( -23.8325 110.031 )
Norm@50keV  : 6.02877E-02    ( -0.0221856   0.0397545 )
------------------------------------------------------------

Photon flux (15-150 keV)    in 1 sec: 3.68417 ( -0.22607  0.2258 ) ph/cm2/s
Energy fluence (15-150 keV)             : 2.82319e-07 ( -2.15776e-08  2.17135e-08 ) ergs/cm2
Time-resolved spectra
Distribution
T90 vs. Hardness ratio plot
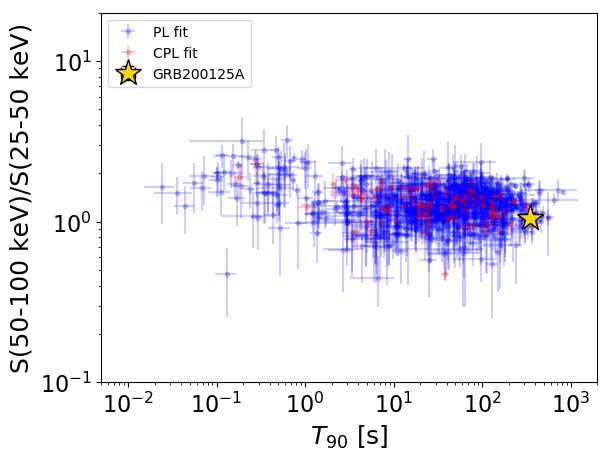
T90                                   = 350.336 sec.
Hardness ratio (energy fluence ratio) = 1.0524706167
S(15-50 keV) vs. S(50-150 keV) plot
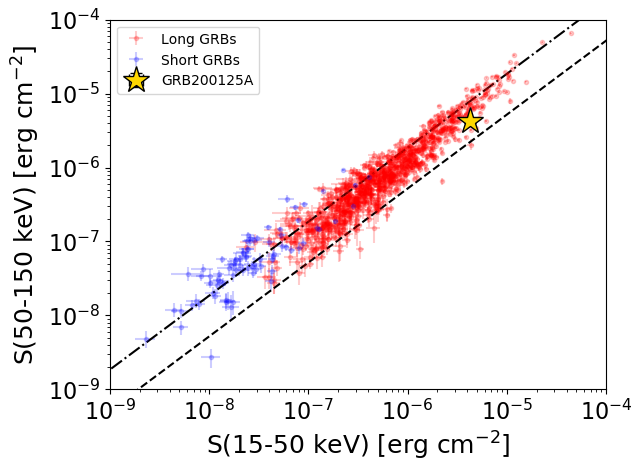
S(15-50 keV)  = 4.228619e-06
S(50-150 keV) = 4.200178e-06
The dash-dotted line and the dashed line traces the fluences calculated from the Band function with Epeak = 15 and 150 keV, respectively. Both lines assume a canonical values of alpha = -1 and beta = -2.5.
Mask shadow pattern
IMX = -1.185997824627540E-01, IMY = -5.404326637733795E-01
Spacecraft aspect plot
Bright source in the pre-burst/pre-slew/post-slew images
Pre-burst image of 15-350 keV band
Time interval of the image:
-179.520000 -36.224000

# RAcent  DECcent POSerr Theta    Phi  PeakCts   SNR AngSep     Name
#  [deg]    [deg]    ['] [deg]  [deg]                   [']
244.9755 -15.6410    0.5  10.8  104.3   5.5615  22.0    0.2	Sco X-1
254.3954  35.4952    0.0  55.5  171.1  -1.1240  -0.7    9.7	Her X-1
255.9863 -37.8613    2.9  17.8   -9.5   0.9725   4.0    1.0	4U 1700-377
256.4615 -36.4294    1.9  16.4  -11.1   1.3953   5.9    1.3	GX 349+2
262.9936 -24.7345   14.2   8.5  -62.8   0.1954   0.8    1.1	GX 1+4
264.7523 -44.4250    7.2  25.6  -23.6   0.3940   1.6    1.6	4U 1735-44
268.5175  -1.3230    0.0  22.7 -151.8  -0.0605  -0.2   11.9	SW J1753.5-0127
270.4547 -24.9776   17.3  14.8  -75.6  -0.1762  -0.7   11.1	GX 5-1
270.3413 -25.6568    6.3  14.9  -72.9  -0.4858  -1.8    5.6	GRS 1758-258
274.1613 -13.9451   10.2  19.0 -113.7   0.3127   1.1   10.6	GX 17+2
275.7544 -30.2755    5.3  21.1  -64.8   0.5637   2.2   10.4	H1820-303
285.0513 -24.8738   12.4  27.8  -82.4  -0.3263  -0.9    2.9	HT1900.1-2455
288.6534  11.1198    0.0  45.2 -138.6   1.3566   2.1   13.5	GRS 1915+105
263.1464 -33.9913   13.8  15.6  -32.6   0.2041   0.8   12.2	GX 354-0
223.3780  -3.9909    3.7  35.0  105.1   1.6630   3.1 ------	UNKNOWN
224.4589  -7.7782    3.0  32.3   99.9   1.7382   3.9 ------	UNKNOWN
255.2504 -18.1935    2.9   1.8  168.6   0.8906   4.0 ------	UNKNOWN
243.7030 -63.1354    3.1  43.8   -0.4   1.6892   3.8 ------	UNKNOWN
255.3754 -41.7330    2.6  21.7   -8.0   1.1251   4.5 ------	UNKNOWN
267.3076 -48.5928    2.3  30.1  -23.8   1.3224   5.0 ------	UNKNOWN
272.9033  17.1526    2.4  41.0 -161.9   1.8968   4.8 ------	UNKNOWN
	UNKNOWN
	UNKNOWN
Pre-slew background subtracted image of 15-350 keV band
Time interval of the image:
-36.224000 51.180590

# RAcent  DECcent POSerr Theta    Phi  PeakCts   SNR AngSep     Name
#  [deg]    [deg]    ['] [deg]  [deg]                   [']
245.1089 -15.7807    8.8  10.6  103.9   0.2333   1.3   11.3	Sco X-1
254.5284  35.2159    3.9  55.2  171.2   2.7554   3.0    8.3	Her X-1
256.1396 -38.0102    0.0  18.0   -9.9  -0.4126  -2.4   12.3	4U 1700-377
256.6244 -36.3751    7.8  16.4  -11.5  -0.2538  -1.5    9.6	GX 349+2
263.0089 -24.7460  945.2   8.5  -62.8  -0.0019  -0.0    0.0	GX 1+4
264.6188 -44.5966   10.1  25.7  -23.2   0.2088   1.1   10.3	4U 1735-44
268.5175  -1.3230    0.0  22.7 -151.8   0.2361   1.3   11.9	SW J1753.5-0127
270.4567 -24.9384    0.0  14.8  -75.7   0.3123   1.7   12.6	GX 5-1
270.4536 -25.8920    8.3  15.1  -72.2   0.2604   1.4   12.1	GRS 1758-258
274.0818 -14.1846   11.1  18.8 -113.1   0.2070   1.0    9.9	GX 17+2
275.8186 -30.5129    6.1  21.2  -64.3   0.3668   1.9   10.3	H1820-303
285.0902 -24.9341   16.8  27.8  -82.2   0.1845   0.7    3.1	HT1900.1-2455
288.6556  11.0945   11.7  45.2 -138.5  -0.4198  -1.0   12.3	GRS 1915+105
263.0113 -33.8372   11.4  15.4  -32.6   0.1732   1.0    1.1	GX 354-0
228.0679  -8.1431    0.9  29.0  102.4   3.7002  13.5 ------	UNKNOWN
301.7538 -37.5935    1.8  43.7  -64.0   4.3607   6.3 ------	UNKNOWN
Post-slew image of 15-350 keV band
Time interval of the image:
100.980580 412.980600

# RAcent  DECcent POSerr Theta    Phi  PeakCts   SNR AngSep     Name
#  [deg]    [deg]    ['] [deg]  [deg]                   [']
244.9633 -15.6312    0.4  18.1  -81.7  11.5118  27.3    1.1	Sco X-1
254.4588  35.3668    8.7  50.1 -169.4   1.3358   1.3    1.5	Her X-1
255.9880 -37.8431    3.4  38.9  -53.6   2.6302   3.4    0.1	4U 1700-377
256.4786 -36.4817    3.8  38.3  -55.7   2.3577   3.1    4.1	GX 349+2
263.0377 -24.8007    3.1  37.3  -76.8   3.5579   3.7    3.7	GX 1+4
268.2231  -1.4455    9.7  40.5 -115.0  -1.2762  -1.2    8.7	SW J1753.5-0127
262.8856 -33.7172    7.0  41.0  -64.0  -1.8609  -1.7    8.7	GX 354-0
217.6388  30.3898    3.5  39.8  148.3   2.6426   3.3 ------	UNKNOWN
228.0377  -8.1547    0.4   0.0   85.5  12.0567  32.6 ------	UNKNOWN
227.5276 -38.5248    3.2  30.4  -16.7   1.5995   3.6 ------	UNKNOWN