Analysis Summary
Notes:
- 1) No attempt has been made to eliminate the non-significant decimal places.
- 2) This batgrbproduct analysis is done using the HEASARC data.
- 3) This batgrbproduct analysis is using the flight position for the mask-weighting calculation.
======================================================================
BAT GRB EVENT DATA PROCESSING REPORT
Process Script Ver: batgrbproduct v2.47
Process Start Time: Tue Jun 2 00:12:58 EDT 2020
Host Name: bat1
Current Working Dir: /local/data/bat1/alien/Swift_3rdBATcatalog/event/batevent_reproc/trigger953689
======================================================================
Trigger: 00953689 Segment: 000
BAT Trigger Time: 602203300.352 [s; MET]
Trigger Stop: 602203301.376 [s; MET]
UTC: 2020-01-31T22:41:15.994140 [includes UTCF correction]
Where From?: TDRSS position message
BAT
RA: 3.09544610319421 Dec: 51.123636218354 [deg; J2000]
Catalogged Source?: NO
Point Source?: YES
GRB Indicated?: YES [ by BAT flight software ]
Image S/N Ratio: 25.71
Image Trigger?: NO
Rate S/N Ratio: 255.998046867549 [ if not an image trigger ]
Image S/N Ratio: 25.71
Analysis Position: [ source = BAT ]
RA: 3.09544610319421 Dec: 51.123636218354 [deg; J2000]
Refined Position: [ source = BAT pre-slew burst ]
RA: 3.08896096317396 Dec: 51.1248790912871 [deg; J2000]
{ 00h 12m 21.4s , +51d 07' 29.6" }
+/- 0.471353036202913 [arcmin] (estimated 90% radius based on SNR)
+/- 0.137591063685911 [arcmin] (formal 1-sigma fit error)
SNR: 89.077190335919
Angular difference between the analysis and refined position is 0.255349 arcmin
Partial Coding Fraction: 0.9609375 [ including projection effects ]
Duration
T90: 32.7399998903275 +/- 0.879054111945978
Measured from: -1.96399998664856
to: 30.7759999036789 [s; relative to TRIGTIME]
T50: 1.7279999256134 +/- 0.0509117071272196
Measured from: -0.547999978065491
to: 1.17999994754791 [s; relative to TRIGTIME]
Fluence
Peak Flux (peak 1 second)
Measured from: 0.0160000324249268
to: 1.01600003242493 [s; relative to TRIGTIME]
Total Fluence
Measured from: -3.45200002193451
to: 46.555999994278 [s; relative to TRIGTIME]
Band 1 Band 2 Band 3 Band 4
15-25 25-50 50-100 100-350 keV
Total 2.440416 3.793163 3.287559 0.869917
0.047341 0.051926 0.047015 0.036720 [error]
Peak 0.619115 1.194116 1.211314 0.341292
0.013797 0.018504 0.019321 0.012540 [error]
[ fluence units of on-axis counts / fully illuminated detector ]
======================================================================
====== Table of the duration information =============================
Value tstart tstop
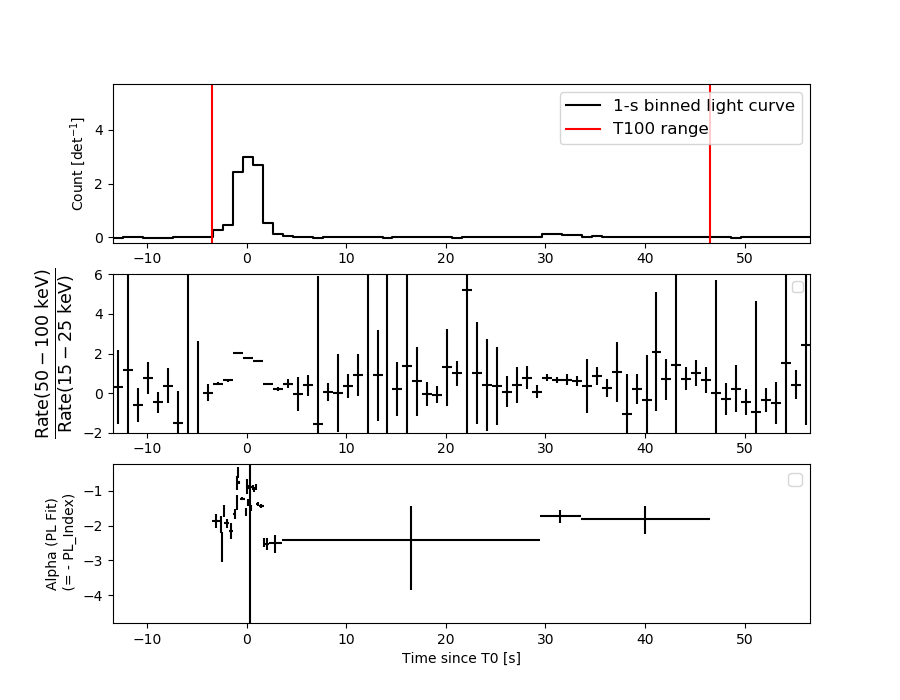
T100 50.008 -3.452 46.556
T90 32.740 -1.964 30.776
T50 1.728 -0.548 1.180
Peak 1.000 0.016 1.016
====== Spectral Analysis Summary =====================================
Model : spectral model: simple power-law (PL) and cutoff power-law (CPL)
Ph_index : photon index: E^{Ph_index}
Ph_90err : 90% error of the photon index
Epeak : Epeak in keV
Epeak_90err: 90% error of Epeak
Norm : normalization at 50 keV in both the PL model and CPL model
Nomr_90err : 90% error of the normalization
chi2 : Chi-Squared
dof : degree of freedo
=== Time-averaged spectral analysis ===
(Best model with acceptable fit: PL)
Model Ph_index Ph_90err_low Ph_90err_hi Epeak Epeak_90err_low Epeak_90err_hi Norm Nomr_90err_low Norm_90err_hi chi2 dof
PL -1.315 -0.035 0.036 - - - 1.41e-02 -2.66e-04 2.66e-04 41.540 57
CPL -1.174 -0.072 0.145 348.736 -145.137 7122.904 1.62e-02 -1.90e-03 2.39e-03 38.620 56
=== 1-s peak spectral analysis ===
(Best model with acceptable fit: CPL)
Model Ph_index Ph_90err_low Ph_90err_hi Epeak Epeak_90err_low Epeak_90err_hi Norm Nomr_90err_low Norm_90err_hi chi2 dof
PL -1.082 -0.035 0.035 - - - 2.32e-01 -4.71e-03 4.71e-03 77.030 57
CPL -0.616 -0.150 0.155 179.646 -29.951 55.292 3.64e-01 -4.83e-02 5.74e-02 47.390 56
=== Fluence/Peak Flux Summary ===
Model Band1 Band2 Band3 Band4 Band5 Total
15-25 25-50 50-100 100-350 15-150 15-350 keV
Fluence PL 7.59e-07 1.56e-06 2.51e-06 9.03e-06 6.96e-06 1.39e-05 erg/cm2
90%_error_low -3.11e-08 -3.74e-08 -5.20e-08 -4.40e-07 -1.32e-07 -4.58e-07 erg/cm2
90%_error_hi 3.17e-08 3.73e-08 5.19e-08 4.56e-07 1.32e-07 4.71e-07 erg/cm2
Peak flux PL 1.82e-03 2.17e-02 3.43e-01 2.98e+01 1.55e+00 3.00e+01 ph/cm2/s
90%_error_low N/A N/A N/A N/A N/A N/A ph/cm2/s
90%_error_hi N/A N/A N/A N/A N/A N/A ph/cm2/s
Fluence CPL 7.28e-07 1.57e-06 2.55e-06 7.61e-06 6.91e-06 1.25e-05 erg/cm2
90%_error_low -4.24e-08 -3.84e-08 -6.29e-08 -1.17e-06 -1.41e-07 -1.17e-06 erg/cm2
90%_error_hi 4.33e-08 3.84e-08 6.33e-08 1.42e-06 1.41e-07 1.15e-06 erg/cm2
Peak flux CPL 5.56e+00 8.38e+00 8.28e+00 8.80e+00 2.63e+01 3.10e+01 ph/cm2/s
90%_error_low -3.56e-01 -2.26e-01 -2.21e-01 -9.89e-01 -5.93e-01 -1.19e+00 ph/cm2/s
90%_error_hi 3.64e-01 2.26e-01 2.22e-01 1.15e+00 5.95e-01 1.31e+00 ph/cm2/s
======================================================================
Image
Pre-slew 15.0-350.0 keV image (Event data)
#   RAcent    DECcent   POSerr    Theta     Phi              Peak Cts       SNR   Name
    3.0890    51.1249   0.0021    23.1579   -16.4227         9.8400643     89.077 TRIG_00953689

Foreground time interval of the image:
 -3.452  13.549 (delta_t =  17.001 [sec])
Background time interval of the image:
-239.352  -3.452 (delta_t = 235.900 [sec])
Light Curves
Note: The mask-weighted lightcurves have units of either count/det or counts/sec/det, where a det is 0.4 x 0.4 = 0.16 sq cm.
Full-time range; 1 s binning
Other quick-look light curves:
- 64 ms binning (zoomed)
- 16 ms binning (zoomed)
- 8 ms binning (zoomed)
- 2 ms binning (zoomed)
- SN=5 or 10 s binning (full-time range)
- Raw light curve
Spectra
- 64 ms binning (zoomed)
- 16 ms binning (zoomed)
- 8 ms binning (zoomed)
- 2 ms binning (zoomed)
- SN=5 or 10 s binning (full-time range)
- Raw light curve
Spectra
Notes:
- 1) The fitting includes the systematic errors.
- 2) When the burst includes telescope slew time periods, the fitting uses an average response file made from multiple 5-s response files through out the slew time plus single time preiod for the non-slew times, and weighted by the total counts in the corresponding time period using addrmf. An average response file is needed becuase a spectral fit using the pre-slew DRM will introduce some errors in both a spectral shape and a normalization if the PHA file contains a lot of the slew/post-slew time interval.
- 3) For fits to more complicated models (e.g. a power-law over a cutoff power-law), the BAT team has decided to require a chi-square improvement of more than 6 for each extra dof.
Time averaged spectrum fit using the average DRM
Power-law model
Time interval is from   -3.452 sec. to   46.556 sec.
XSPEC12>exit
 XSPEC: quit


Photon index: -1.31477     ( -0.0354386   0.0355306 )
------------------------------------------------------------
Parameters  : value       lower 90%   higher 90%
Photon index: 1.31477     ( -0.0355306   0.0354386 )
Norm@50keV  : 1.41323E-02    ( -0.000266309   0.000266095 )
------------------------------------------------------------

Photon flux (15-150 keV)    in 50.01 sec: 1.69071 ( -0.03592  0.03604 ) ph/cm2/s
Energy fluence (15-150 keV)             : 6.95994e-06 ( -1.32046e-07  1.32354e-07 ) ergs/cm2
Cutoff power-law model

Time interval is from   -3.452 sec. to   46.556 sec.
 XSPEC: quit


Photon index: -1.17354     ( -0.0718057   0.145021 )
------------------------------------------------------------
Parameters  : value       lower 90%   higher 90%
Photon index: 1.17354     ( -0.145021   0.0718057 )
Epeak [keV] : 348.736      ( -145.146 7122.89 )
Norm@50keV  : 1.62116E-02    ( -0.00189892   0.00238784 )
------------------------------------------------------------

Photon flux (15-150 keV)    in 50.01 sec: 1.67206 ( -0.03999  0.04019 ) ph/cm2/s
Energy fluence (15-150 keV)             : 6.90998e-06 ( -1.41413e-07  1.41118e-07 ) ergs/cm2
1-s peak spectrum fit
Power-law model
Time interval is from    0.016 sec. to    1.016 sec.
XSPEC12>exit
 XSPEC: quit


Photon index: -1.08205     ( -0.0351305   0.0352274 )
------------------------------------------------------------
Parameters  : value       lower 90%   higher 90%
Photon index: 1.08205     ( -0.0352274   0.0351305 )
Norm@50keV  : 0.231958    ( -0.00471093   0.00470681 )
------------------------------------------------------------

Photon flux (15-150 keV)    in 1 sec: 1.55392 (    ) ph/cm2/s
Energy fluence (15-150 keV)             : 2.4395e-06 ( -5.13588e-08  5.13639e-08 ) ergs/cm2
Cutoff power-law model
Time interval is from    0.016 sec. to    1.016 sec.
 XSPEC: quit


Photon index: -0.616037     ( -0.150435   0.155306 )
------------------------------------------------------------
Parameters  : value       lower 90%   higher 90%
Photon index: 0.616037     ( -0.155306   0.150435 )
Epeak [keV] : 179.646      ( -29.9509 55.2923 )
Norm@50keV  : 0.364429    ( -0.0482875   0.0573725 )
------------------------------------------------------------

Photon flux (15-150 keV)    in 1 sec: 26.2606 ( -0.5932  0.5946 ) ph/cm2/s
Energy fluence (15-150 keV)             : 2.40392e-06 ( -5.34755e-08  5.33903e-08 ) ergs/cm2
Time-resolved spectra
Distribution
T90 vs. Hardness ratio plot
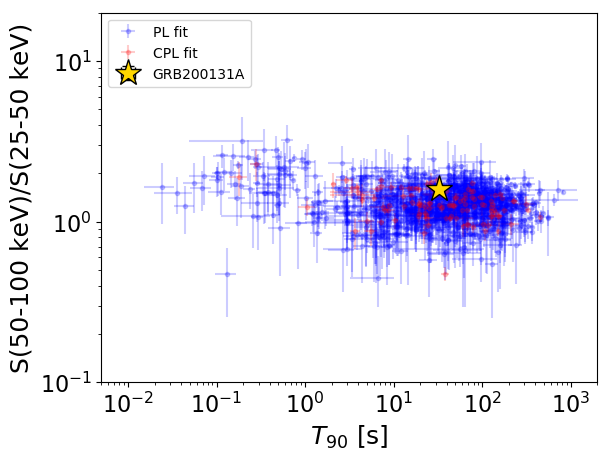
T90                                   = 32.74 sec.
Hardness ratio (energy fluence ratio) = 1.60797774166
S(15-50 keV) vs. S(50-150 keV) plot
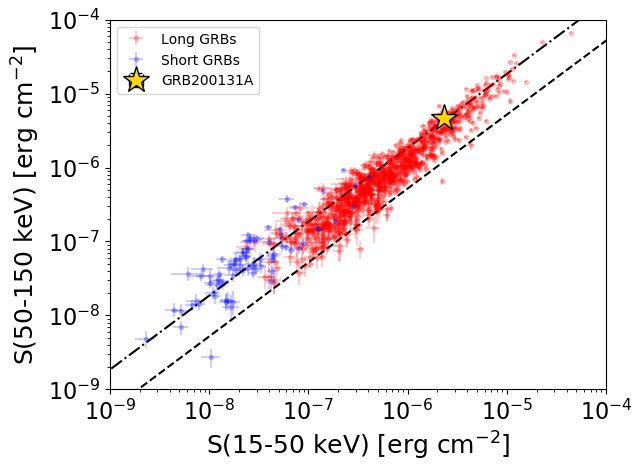
S(15-50 keV)  = 2.3208552e-06
S(50-150 keV) = 4.639182e-06
The dash-dotted line and the dashed line traces the fluences calculated from the Band function with Epeak = 15 and 150 keV, respectively. Both lines assume a canonical values of alpha = -1 and beta = -2.5.
Mask shadow pattern
IMX = 4.102801948967180E-01, IMY = 1.209286996380831E-01
Spacecraft aspect plot
Bright source in the pre-burst/pre-slew/post-slew images
Pre-burst image of 15-350 keV band
Time interval of the image:
-239.352000 -3.452000

# RAcent  DECcent POSerr Theta    Phi  PeakCts   SNR AngSep     Name
#  [deg]    [deg]    ['] [deg]  [deg]                   [']
326.1198  38.4952   21.6  48.7  -40.2   0.3498   0.5   10.7	Cyg X-2
349.5442  68.5676    3.3  38.2    5.7   0.8973   3.5 ------	UNKNOWN
302.6055  66.0729    3.5  55.2   -1.8   2.1549   3.3 ------	UNKNOWN
 49.5291 -15.3176    3.3  55.8 -176.5   2.8272   3.5 ------	UNKNOWN
 40.4257 -12.4290    3.3  50.6 -166.8   1.7083   3.5 ------	UNKNOWN
326.8378  52.0468    3.1  45.2  -22.2   1.2402   3.7 ------	UNKNOWN
  1.7439  25.0999    3.4  26.0  -81.6   0.9043   3.4 ------	UNKNOWN
339.9262  36.3834    2.6  38.9  -47.9   1.5484   4.5 ------	UNKNOWN
 22.0217 -16.1559    2.7  53.5 -144.0   4.7608   4.3 ------	UNKNOWN
Pre-slew background subtracted image of 15-350 keV band
Time interval of the image:
-3.452000 13.548610

# RAcent  DECcent POSerr Theta    Phi  PeakCts   SNR AngSep     Name
#  [deg]    [deg]    ['] [deg]  [deg]                   [']
326.2395  38.1975    5.6  48.7  -40.6  -0.6550  -2.0    8.1	Cyg X-2
  3.0890  51.1249    0.1  23.2  -16.4   9.8400  89.1 ------	UNKNOWN
  6.3532  30.2837    3.2  19.9  -75.3   0.4504   3.6 ------	UNKNOWN
301.3977  55.0610    3.6  59.2  -14.1   2.2017   3.2 ------	UNKNOWN
311.9636  51.8132    2.2  54.3  -20.2   1.8197   5.1 ------	UNKNOWN
Post-slew image of 15-350 keV band
Time interval of the image:
57.948590 406.748600

# RAcent  DECcent POSerr Theta    Phi  PeakCts   SNR AngSep     Name
#  [deg]    [deg]    ['] [deg]  [deg]                   [']
299.6848  35.0756    6.8  47.4  -40.9   1.9510   1.7    8.9	Cyg X-1
308.1558  40.8593    8.7  38.6  -40.1  -0.6934  -1.3    6.0	Cyg X-3
326.0376  38.4463   24.6  28.8  -58.3   0.2042   0.5    9.8	Cyg X-2
301.3538  68.5686    2.8  33.6    7.6   1.6583   4.2 ------	UNKNOWN
263.8814  53.9743    3.3  55.2   -1.8   3.7515   3.5 ------	UNKNOWN
 27.7030  13.2122    2.4  42.8 -173.4   2.3519   4.8 ------	UNKNOWN
 20.1234  -3.3561    3.0  56.4 -157.3   6.6594   3.9 ------	UNKNOWN
357.8255   3.2176    3.3  48.1 -129.7   5.4205   3.7  233.0	UNKNOWN
357.3317   3.3944    2.2  48.0 -129.0   7.8674   5.4  259.0	UNKNOWN
357.5091   3.1030    3.7  48.3 -129.3   5.8186   4.0  238.7	UNKNOWN