Analysis Summary
Notes:
- 1) No attempt has been made to eliminate the non-significant decimal places.
- 2) This batgrbproduct analysis is done using the HEASARC data.
- 3) This batgrbproduct analysis is using the flight position for the mask-weighting calculation.
======================================================================
BAT GRB EVENT DATA PROCESSING REPORT
Process Script Ver: batgrbproduct v2.47
Process Start Time: Sun Jun 28 23:55:31 EDT 2020
Host Name: bat1
Current Working Dir: /local/data/bat1/alien/Swift_3rdBATcatalog/event/batevent_reproc/trigger954519
======================================================================
Trigger: 00954519 Segment: 000
BAT Trigger Time: 602623328 [s; MET]
Trigger Stop: 602623592 [s; MET]
UTC: 2020-02-05T19:21:43.614940 [includes UTCF correction]
Where From?: TDRSS position message
BAT
RA: 107.802609552217 Dec: -56.4806300131178 [deg; J2000]
Catalogged Source?: NO
Point Source?: YES
GRB Indicated?: YES [ by BAT flight software ]
Image S/N Ratio: 11.12
Image Trigger?: YES
Rate S/N Ratio: 0 [ if not an image trigger ]
Image S/N Ratio: 11.12
Analysis Position: [ source = BAT ]
RA: 107.802609552217 Dec: -56.4806300131178 [deg; J2000]
Refined Position: [ source = BAT pre-slew burst ]
RA: 107.768928724194 Dec: -56.497765962071 [deg; J2000]
{ 07h 11m 04.5s , -56d 29' 52.0" }
+/- 2.85497230928642 [arcmin] (estimated 90% radius based on SNR)
+/- 1.30424408721128 [arcmin] (formal 1-sigma fit error)
SNR: 6.79608062364203
Angular difference between the analysis and refined position is 1.517199 arcmin
Partial Coding Fraction: 0.4765625 [ including projection effects ]
Duration
T90: 453.912000060081 +/- 4.49853877102946
Measured from: 54.0320000648499
to: 507.944000124931 [s; relative to TRIGTIME]
T50: 46.8559999465942 +/- 5.35733816059304
Measured from: 395.948000073433
to: 442.804000020027 [s; relative to TRIGTIME]
Fluence
Peak Flux (peak 1 second)
Measured from: 437.891999959946
to: 438.891999959946 [s; relative to TRIGTIME]
Total Fluence
Measured from: 47.1000000238419
to: 520.396000027657 [s; relative to TRIGTIME]
Band 1 Band 2 Band 3 Band 4
15-25 25-50 50-100 100-350 keV
Total 4.283738 5.110085 2.961877 0.541291
0.139121 0.141159 0.121884 0.109220 [error]
Peak 0.083466 0.110168 0.072343 0.014007
0.006754 0.007244 0.006345 0.004747 [error]
[ fluence units of on-axis counts / fully illuminated detector ]
======================================================================
====== Table of the duration information =============================
Value tstart tstop
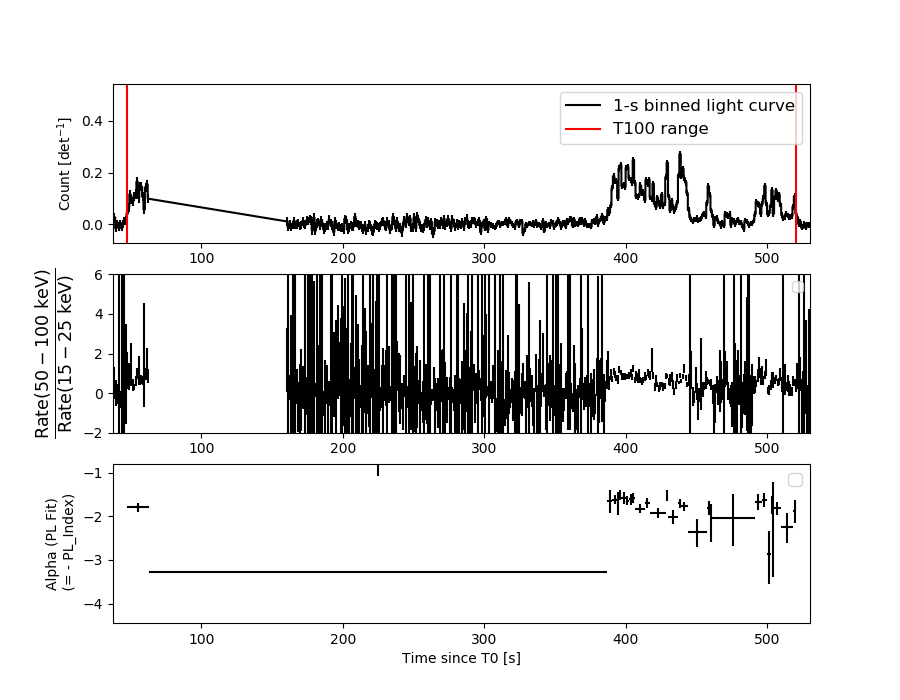
T100 473.296 47.100 520.396
T90 453.912 54.032 507.944
T50 46.856 395.948 442.804
Peak 1.000 437.892 438.892
====== Spectral Analysis Summary =====================================
Model : spectral model: simple power-law (PL) and cutoff power-law (CPL)
Ph_index : photon index: E^{Ph_index}
Ph_90err : 90% error of the photon index
Epeak : Epeak in keV
Epeak_90err: 90% error of Epeak
Norm : normalization at 50 keV in both the PL model and CPL model
Nomr_90err : 90% error of the normalization
chi2 : Chi-Squared
dof : degree of freedo
=== Time-averaged spectral analysis ===
(Best model with acceptable fit: CPL)
Model Ph_index Ph_90err_low Ph_90err_hi Epeak Epeak_90err_low Epeak_90err_hi Norm Nomr_90err_low Norm_90err_hi chi2 dof
PL -1.851 -0.070 0.070 - - - 2.06e-03 -8.01e-05 7.98e-05 61.780 57
CPL -1.346 -0.299 0.321 61.078 -8.699 22.659 3.76e-03 -1.11e-03 1.72e-03 53.120 56
=== 1-s peak spectral analysis ===
(Best model with acceptable fit: PL)
Model Ph_index Ph_90err_low Ph_90err_hi Epeak Epeak_90err_low Epeak_90err_hi Norm Nomr_90err_low Norm_90err_hi chi2 dof
PL -1.616 -0.133 0.130 - - - 1.69e-02 -1.39e-03 1.38e-03 51.610 57
CPL -1.099 -0.499 0.566 82.750 -22.596 468.034 3.18e-02 -1.42e-02 3.07e-02 48.440 56
=== Fluence/Peak Flux Summary ===
Model Band1 Band2 Band3 Band4 Band5 Total
15-25 25-50 50-100 100-350 15-150 15-350 keV
Fluence PL 1.37e-06 2.04e-06 2.26e-06 4.74e-06 7.12e-06 1.04e-05 erg/cm2
90%_error_low -8.46e-08 -7.51e-08 -1.21e-07 -5.22e-07 -2.79e-07 -6.22e-07 erg/cm2
90%_error_hi 8.63e-08 7.50e-08 1.21e-07 5.64e-07 2.80e-07 6.55e-07 erg/cm2
Peak flux PL 7.79e-01 7.33e-01 4.78e-01 4.83e-01 2.19e+00 2.47e+00 ph/cm2/s
90%_error_low -9.33e-02 -5.70e-02 -5.02e-02 -9.38e-02 -1.67e-01 -1.91e-01 ph/cm2/s
90%_error_hi 9.61e-02 5.68e-02 5.01e-02 1.07e-01 1.67e-01 1.92e-01 ph/cm2/s
Fluence CPL 1.26e-06 2.13e-06 2.27e-06 2.25e-06 6.77e-06 7.91e-06 erg/cm2
90%_error_low -1.05e-07 -9.11e-08 -1.30e-07 -7.30e-07 -3.38e-07 -8.17e-07 erg/cm2
90%_error_hi 1.06e-07 9.21e-08 1.30e-07 1.17e-06 3.40e-07 1.21e-06 erg/cm2
Peak flux CPL 7.22e-01 7.74e-01 4.93e-01 2.64e-01 2.14e+00 2.25e+00 ph/cm2/s
90%_error_low -1.09e-01 -6.94e-02 -5.48e-02 -1.16e-01 -1.73e-01 -2.14e-01 ph/cm2/s
90%_error_hi 1.11e-01 7.13e-02 5.56e-02 2.13e-01 1.72e-01 2.60e-01 ph/cm2/s
======================================================================
Image
Pre-slew 15.0-350.0 keV image (Event data)
#   RAcent    DECcent   POSerr    Theta     Phi              Peak Cts       SNR   Name
  107.7689   -56.4978   0.0282    39.0885    15.4950         1.7639307      6.796 TRIG_00954519

Foreground time interval of the image:
 47.100  63.055 (delta_t =  15.955 [sec])
160.000 274.701 (delta_t = 114.701 [sec])
Background time interval of the image:
-239.000 -56.296 (delta_t = 182.704 [sec])
-55.000  47.100 (delta_t = 102.100 [sec])
Light Curves
Note: The mask-weighted lightcurves have units of either count/det or counts/sec/det, where a det is 0.4 x 0.4 = 0.16 sq cm.
Full-time range; 1 s binning
Other quick-look light curves:
- 64 ms binning (zoomed)
- 16 ms binning (zoomed)
- 8 ms binning (zoomed)
- 2 ms binning (zoomed)
- SN=5 or 10 s binning (full-time range)
- Raw light curve
Spectra
- 64 ms binning (zoomed)
- 16 ms binning (zoomed)
- 8 ms binning (zoomed)
- 2 ms binning (zoomed)
- SN=5 or 10 s binning (full-time range)
- Raw light curve
Spectra
Notes:
- 1) The fitting includes the systematic errors.
- 2) When the burst includes telescope slew time periods, the fitting uses an average response file made from multiple 5-s response files through out the slew time plus single time preiod for the non-slew times, and weighted by the total counts in the corresponding time period using addrmf. An average response file is needed becuase a spectral fit using the pre-slew DRM will introduce some errors in both a spectral shape and a normalization if the PHA file contains a lot of the slew/post-slew time interval.
- 3) For fits to more complicated models (e.g. a power-law over a cutoff power-law), the BAT team has decided to require a chi-square improvement of more than 6 for each extra dof.
Time averaged spectrum fit using the average DRM
Power-law model

Multiple GTIs in the spectrum
tstart tstop
47.100000 63.055400
160.000000 520.396000
XSPEC12>exit
 XSPEC: quit


Photon index: -1.85062     ( -0.0703098   0.0696082 )
------------------------------------------------------------
Parameters  : value       lower 90%   higher 90%
Photon index: 1.85062     ( -0.0696082   0.0703098 )
Norm@50keV  : 2.05602E-03    ( -8.01399e-05   7.9765e-05 )
------------------------------------------------------------

Photon flux (15-150 keV)    in 376.4 sec: 0.289085 ( -0.011005  0.011034 ) ph/cm2/s
Energy fluence (15-150 keV)             : 7.1169e-06 ( -2.7873e-07  2.79832e-07 ) ergs/cm2
Cutoff power-law model

Multiple GTIs in the spectrum
tstart tstop
47.100000 63.055400
160.000000 520.396000
 XSPEC: quit


Photon index: -1.34579     ( -0.299   0.321052 )
------------------------------------------------------------
Parameters  : value       lower 90%   higher 90%
Photon index: 1.34579     ( -0.321052   0.299 )
Epeak [keV] : 61.0776      ( -8.69946 22.6588 )
Norm@50keV  : 3.75580E-03    ( -0.00110589   0.00171994 )
------------------------------------------------------------

Photon flux (15-150 keV)    in 376.4 sec: 0.278936 ( -0.012363  0.012423 ) ph/cm2/s
Energy fluence (15-150 keV)             : 6.77174e-06 ( -3.38203e-07  3.40392e-07 ) ergs/cm2
1-s peak spectrum fit
Power-law model
Time interval is from  437.892 sec. to  438.892 sec.
XSPEC12>exit
 XSPEC: quit


Photon index: -1.6157     ( -0.132528   0.130059 )
------------------------------------------------------------
Parameters  : value       lower 90%   higher 90%
Photon index: 1.61570     ( -0.130059   0.132528 )
Norm@50keV  : 1.69466E-02    ( -0.00138846   0.00137628 )
------------------------------------------------------------

Photon flux (15-150 keV)    in 1 sec: 2.18852 ( -0.16694  0.16701 ) ph/cm2/s
Energy fluence (15-150 keV)             : 1.58216e-07 ( -1.38816e-08  1.40303e-08 ) ergs/cm2
Cutoff power-law model
Time interval is from  437.892 sec. to  438.892 sec.
 XSPEC: quit


Photon index: -1.09885     ( -0.498518   0.566309 )
------------------------------------------------------------
Parameters  : value       lower 90%   higher 90%
Photon index: 1.09885     ( -0.566309   0.498518 )
Epeak [keV] : 82.7503      ( -22.5964 468.034 )
Norm@50keV  : 3.17985E-02    ( -0.0141618   0.0307197 )
------------------------------------------------------------

Photon flux (15-150 keV)    in 1 sec: 2.14430 ( -0.17252  0.17233 ) ph/cm2/s
Energy fluence (15-150 keV)             : 1.51607e-07 ( -1.52775e-08  1.53982e-08 ) ergs/cm2
Time-resolved spectra
Distribution
T90 vs. Hardness ratio plot
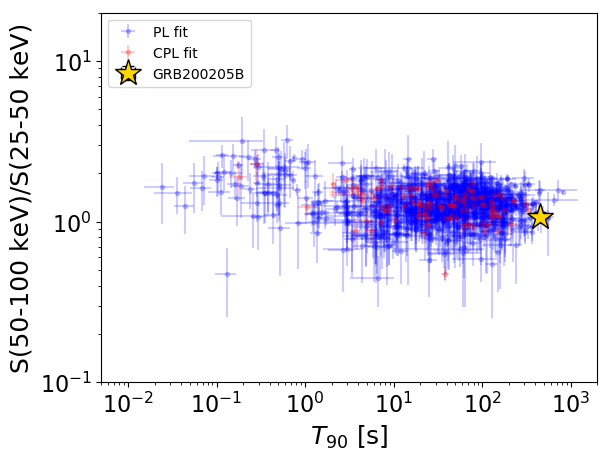
T90                                   = 453.912 sec.
Hardness ratio (energy fluence ratio) = 1.0682423426
S(15-50 keV) vs. S(50-150 keV) plot
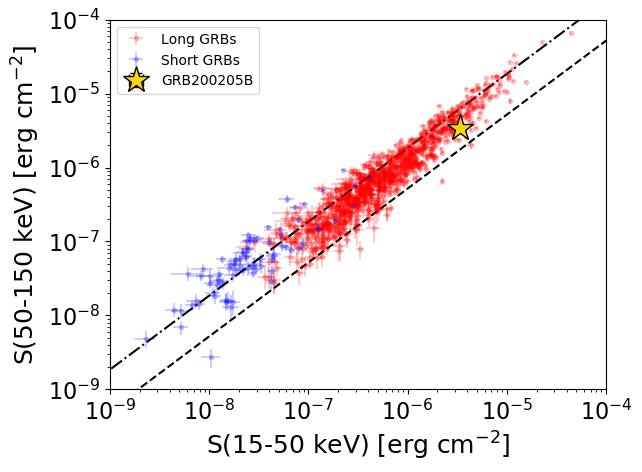
S(15-50 keV)  = 3.392834e-06
S(50-150 keV) = 3.378848e-06
The dash-dotted line and the dashed line traces the fluences calculated from the Band function with Epeak = 15 and 150 keV, respectively. Both lines assume a canonical values of alpha = -1 and beta = -2.5.
Mask shadow pattern
IMX = 7.828181020773868E-01, IMY = -2.170211686413401E-01
Spacecraft aspect plot
Bright source in the pre-burst/pre-slew/post-slew images
Pre-burst image of 15-350 keV band
Time interval of the image:
-239.000000 -56.295600
-55.000000 47.100000

# RAcent  DECcent POSerr Theta    Phi  PeakCts   SNR AngSep     Name
#  [deg]    [deg]    ['] [deg]  [deg]                   [']
135.5772 -40.5223    2.2  37.9   54.6   3.6774   5.2    2.9	Vela X-1
170.5685 -60.5396    4.7   8.7   45.3   0.6617   2.5    9.0	Cen X-3
186.6393 -62.7931    2.7   1.4   -6.5   1.2929   4.3    1.5	GX 301-2
255.9567 -37.8404    3.7  46.9 -132.4   3.3085   3.1    1.4	4U 1700-377
256.4333 -36.4390   30.1  48.2 -133.1   0.5051   0.4    1.0	GX 349+2
124.3010 -36.3471    5.0  46.5   47.9   2.5416   2.3 ------	UNKNOWN
227.5577 -13.4361    3.3  55.7 -176.5   4.2565   3.5 ------	UNKNOWN
245.8269 -19.9728    5.0  57.2 -154.1   3.8240   2.3 ------	UNKNOWN
252.3777 -27.1370    2.5  54.0 -143.5   7.7211   4.6 ------	UNKNOWN
259.3007 -38.3964    3.3  48.0 -129.1   4.8601   3.5 ------	UNKNOWN
Pre-slew background subtracted image of 15-350 keV band
Time interval of the image:
47.100000 63.055400
160.000000 274.700600

# RAcent  DECcent POSerr Theta    Phi  PeakCts   SNR AngSep     Name
#  [deg]    [deg]    ['] [deg]  [deg]                   [']
135.6809 -40.4277    4.2  37.9   54.8  -1.1148  -2.8   10.3	Vela X-1
170.4777 -60.7493    6.3   8.7   43.9   0.2773   1.8    9.0	Cen X-3
186.5106 -62.6625    6.5   1.4   -1.0   0.2626   1.8    7.6	GX 301-2
255.8407 -37.8964    9.1  46.8 -132.4   0.6997   1.3    7.6	4U 1700-377
256.4274 -36.3591    5.4  48.3 -133.2   1.5319   2.1    3.9	GX 349+2
 91.7821 -46.8442    2.3  52.8   14.2   3.1769   5.0 ------	UNKNOWN
107.7687 -56.4977    1.7  39.1   15.5   1.7685   6.8 ------	UNKNOWN
 93.3880 -71.4707    2.3  34.8  -10.6   0.9632   5.0 ------	UNKNOWN
263.2704 -66.9076    2.0  30.8  -91.9   1.4097   5.7 ------	UNKNOWN
Post-slew image of 15-350 keV band
Time interval of the image:
331.900640 1023.800590

# RAcent  DECcent POSerr Theta    Phi  PeakCts   SNR AngSep     Name
#  [deg]    [deg]    ['] [deg]  [deg]                   [']
135.5254 -40.5758    0.9  24.0  119.8   8.8061  12.6    1.3	Vela X-1
170.3363 -60.6140    1.8  31.6 -176.6   4.2273   6.6    0.8	Cen X-3
186.5868 -62.6889    3.5  37.8 -167.8   2.4917   3.3    5.2	GX 301-2
156.7368 -30.8401    2.6  42.4  133.4   8.0721   4.5 ------	UNKNOWN
166.7625 -48.0717    2.8  35.9  161.7   3.3633   4.1 ------	UNKNOWN
107.7892 -56.4798    0.6   0.0   52.1  11.0496  20.7 ------	UNKNOWN
 70.1031 -69.1536    3.5  20.8  -82.8   2.1470   3.3 ------	UNKNOWN
229.2805 -56.9703    4.3  57.2 -154.1   9.5232   2.7 ------	UNKNOWN
 36.2809 -49.3962    3.3  41.7  -52.3   4.9852   3.5 ------	UNKNOWN
263.1947 -74.4754    2.7  48.0 -129.1  11.7017   4.3 ------	UNKNOWN