Analysis Summary
Notes:
- 1) No attempt has been made to eliminate the non-significant decimal places.
- 2) This batgrbproduct analysis is done using the HEASARC data.
- 3) This batgrbproduct analysis is using the flight position for the mask-weighting calculation.
======================================================================
BAT GRB EVENT DATA PROCESSING REPORT
Process Script Ver: batgrbproduct v2.47
Process Start Time: Mon May 18 14:48:08 EDT 2020
Host Name: bat1
Current Working Dir: /local/data/bat1/alien/Swift_3rdBATcatalog/event/batevent_reproc/trigger956639
======================================================================
Trigger: 00956639 Segment: 000
BAT Trigger Time: 603470396.416 [s; MET]
Trigger Stop: 603470397.44 [s; MET]
UTC: 2020-02-15T14:39:31.975900 [includes UTCF correction]
Where From?: TDRSS position message
BAT
RA: 34.1217781187011 Dec: 12.7806238069698 [deg; J2000]
Catalogged Source?: NO
Point Source?: YES
GRB Indicated?: YES [ by BAT flight software ]
Image S/N Ratio: 16.49
Image Trigger?: NO
Rate S/N Ratio: 37.1214223865412 [ if not an image trigger ]
Image S/N Ratio: 16.49
Analysis Position: [ source = BAT ]
RA: 34.1217781187011 Dec: 12.7806238069698 [deg; J2000]
Refined Position: [ source = BAT pre-slew burst ]
RA: 34.0999775945519 Dec: 12.7753599537487 [deg; J2000]
{ 02h 16m 24.0s , +12d 46' 31.3" }
+/- 0.981626090769389 [arcmin] (estimated 90% radius based on SNR)
+/- 0.35363813512322 [arcmin] (formal 1-sigma fit error)
SNR: 31.2337378847574
Angular difference between the analysis and refined position is 1.314154 arcmin
Partial Coding Fraction: 0.734375 [ including projection effects ]
Duration
T90: 11.1479998826981 +/- 2.15453477136577
Measured from: -7.33599996566772
to: 3.81199991703033 [s; relative to TRIGTIME]
T50: 3.70799994468689 +/- 0.627910734101116
Measured from: -2.08800005912781
to: 1.61999988555908 [s; relative to TRIGTIME]
Fluence
Peak Flux (peak 1 second)
Measured from: -0.159999966621399
to: 0.840000033378601 [s; relative to TRIGTIME]
Total Fluence
Measured from: -9.97200000286102
to: 5.36800003051758 [s; relative to TRIGTIME]
Band 1 Band 2 Band 3 Band 4
15-25 25-50 50-100 100-350 keV
Total 0.406933 0.658523 0.511084 0.128731
0.029439 0.031156 0.027983 0.023393 [error]
Peak 0.071393 0.120292 0.112172 0.043061
0.008417 0.009415 0.009068 0.007147 [error]
[ fluence units of on-axis counts / fully illuminated detector ]
======================================================================
====== Table of the duration information =============================
Value tstart tstop
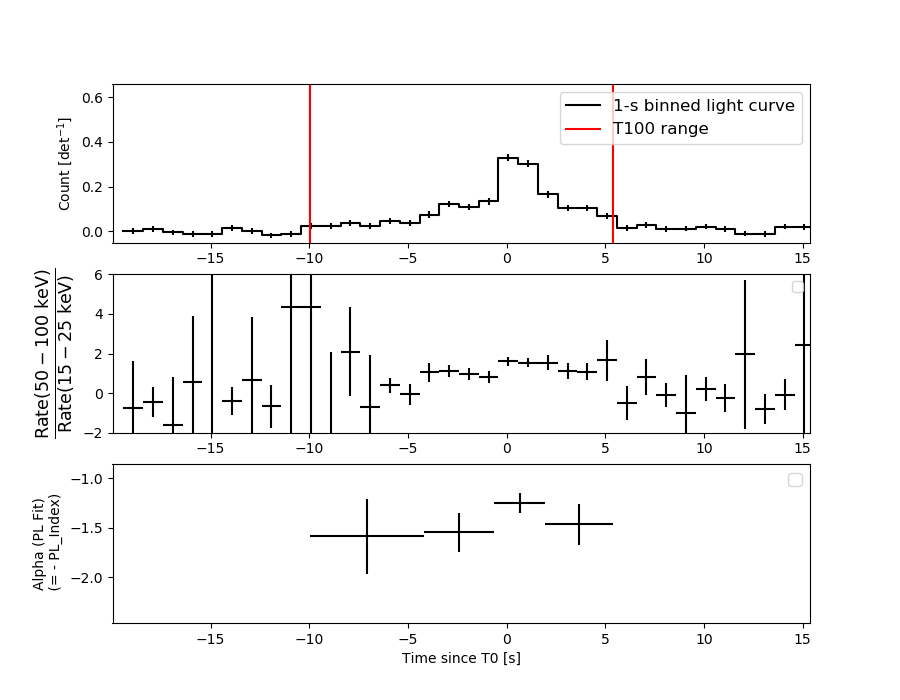
T100 15.340 -9.972 5.368
T90 11.148 -7.336 3.812
T50 3.708 -2.088 1.620
Peak 1.000 -0.160 0.840
====== Spectral Analysis Summary =====================================
Model : spectral model: simple power-law (PL) and cutoff power-law (CPL)
Ph_index : photon index: E^{Ph_index}
Ph_90err : 90% error of the photon index
Epeak : Epeak in keV
Epeak_90err: 90% error of Epeak
Norm : normalization at 50 keV in both the PL model and CPL model
Nomr_90err : 90% error of the normalization
chi2 : Chi-Squared
dof : degree of freedo
=== Time-averaged spectral analysis ===
(Best model with acceptable fit: PL)
Model Ph_index Ph_90err_low Ph_90err_hi Epeak Epeak_90err_low Epeak_90err_hi Norm Nomr_90err_low Norm_90err_hi chi2 dof
PL -1.406 -0.094 0.094 - - - 7.59e-03 -4.11e-04 4.11e-04 62.570 57
CPL -1.054 -0.352 0.386 140.810 -48.213 858.831 1.13e-02 -3.53e-03 5.85e-03 59.670 56
=== 1-s peak spectral analysis ===
(Best model with acceptable fit: PL)
Model Ph_index Ph_90err_low Ph_90err_hi Epeak Epeak_90err_low Epeak_90err_hi Norm Nomr_90err_low Norm_90err_hi chi2 dof
PL -1.209 -0.140 0.141 - - - 2.33e-02 -1.90e-03 1.90e-03 46.440 57
CPL -1.060 -0.273 0.566 344.871 -344.871 -344.871 2.74e-02 -5.78e-03 2.24e-02 46.200 56
=== Fluence/Peak Flux Summary ===
Model Band1 Band2 Band3 Band4 Band5 Total
15-25 25-50 50-100 100-350 15-150 15-350 keV
Fluence PL 1.36e-07 2.65e-07 4.00e-07 1.31e-06 1.12e-06 2.11e-06 erg/cm2
90%_error_low -1.32e-08 -1.58e-08 -2.69e-08 -1.83e-07 -6.63e-08 -2.03e-07 erg/cm2
90%_error_hi 1.36e-08 1.57e-08 2.68e-08 2.02e-07 6.66e-08 2.19e-07 erg/cm2
Peak flux PL 7.25e-01 8.68e-01 7.51e-01 1.11e+00 2.74e+00 3.46e+00 ph/cm2/s
90%_error_low -1.10e-01 -8.32e-02 -7.13e-02 -2.07e-01 -2.29e-01 -2.96e-01 ph/cm2/s
90%_error_hi 1.16e-01 8.22e-02 7.06e-02 2.35e-01 2.29e-01 3.00e-01 ph/cm2/s
Fluence CPL 1.27e-07 2.74e-07 4.12e-07 7.98e-07 1.10e-06 1.61e-06 erg/cm2
90%_error_low -1.58e-08 -1.82e-08 -2.98e-08 -2.97e-07 -7.18e-08 -3.02e-07 erg/cm2
90%_error_hi 1.61e-08 1.85e-08 3.02e-08 5.09e-07 7.15e-08 5.06e-07 erg/cm2
Peak flux CPL 7.02e-01 8.79e-01 7.65e-01 9.41e-01 2.72e+00 3.29e+00 ph/cm2/s
90%_error_low -1.35e-01 -4.57e-02 -8.11e-02 -4.02e-01 -2.34e-01 -4.73e-01 ph/cm2/s
90%_error_hi 1.24e-01 9.26e-02 8.58e-02 2.29e-01 2.34e-01 4.37e-01 ph/cm2/s
======================================================================
Image
Pre-slew 15.0-350.0 keV image (Event data)
#   RAcent    DECcent   POSerr    Theta     Phi              Peak Cts       SNR   Name
   34.1000    12.7754   0.0062    34.0530  -167.7735         1.7727986     31.234 TRIG_00956639

Foreground time interval of the image:
 -9.972   5.368 (delta_t =  15.340 [sec])
Background time interval of the image:
-239.416  -9.972 (delta_t = 229.444 [sec])
Light Curves
Note: The mask-weighted lightcurves have units of either count/det or counts/sec/det, where a det is 0.4 x 0.4 = 0.16 sq cm.
Full-time range; 1 s binning
Other quick-look light curves:
- 64 ms binning (zoomed)
- 16 ms binning (zoomed)
- 8 ms binning (zoomed)
- 2 ms binning (zoomed)
- SN=5 or 10 s binning (full-time range)
- Raw light curve
Spectra
- 64 ms binning (zoomed)
- 16 ms binning (zoomed)
- 8 ms binning (zoomed)
- 2 ms binning (zoomed)
- SN=5 or 10 s binning (full-time range)
- Raw light curve
Spectra
Notes:
- 1) The fitting includes the systematic errors.
- 2) When the burst includes telescope slew time periods, the fitting uses an average response file made from multiple 5-s response files through out the slew time plus single time preiod for the non-slew times, and weighted by the total counts in the corresponding time period using addrmf. An average response file is needed becuase a spectral fit using the pre-slew DRM will introduce some errors in both a spectral shape and a normalization if the PHA file contains a lot of the slew/post-slew time interval.
- 3) For fits to more complicated models (e.g. a power-law over a cutoff power-law), the BAT team has decided to require a chi-square improvement of more than 6 for each extra dof.
Time averaged spectrum fit using the average DRM
Power-law model
Time interval is from   -9.972 sec. to    5.368 sec.
XSPEC12>exit
 XSPEC: quit


Photon index: -1.40624     ( -0.0942883   0.0943835 )
------------------------------------------------------------
Parameters  : value       lower 90%   higher 90%
Photon index: 1.40624     ( -0.0943835   0.0942883 )
Norm@50keV  : 7.59002E-03    ( -0.000411398   0.000411183 )
------------------------------------------------------------

Photon flux (15-150 keV)    in 15.34 sec: 0.925658 ( -0.052096  0.052182 ) ph/cm2/s
Energy fluence (15-150 keV)             : 1.12374e-06 ( -6.63002e-08  6.66126e-08 ) ergs/cm2
Cutoff power-law model
Time interval is from   -9.972 sec. to    5.368 sec.
 XSPEC: quit


Photon index: -1.05405     ( -0.352242   0.385783 )
------------------------------------------------------------
Parameters  : value       lower 90%   higher 90%
Photon index: 1.05405     ( -0.385783   0.352242 )
Epeak [keV] : 140.810      ( -48.2124 858.832 )
Norm@50keV  : 1.12564E-02    ( -0.00352904   0.00585461 )
------------------------------------------------------------

Photon flux (15-150 keV)    in 15.34 sec: 0.910541 ( -0.054199  0.054242 ) ph/cm2/s
Energy fluence (15-150 keV)             : 1.09839e-06 ( -7.17536e-08  7.15309e-08 ) ergs/cm2
1-s peak spectrum fit
Power-law model
Time interval is from   -0.160 sec. to    0.840 sec.
XSPEC12>exit
 XSPEC: quit


Photon index: -1.20906     ( -0.140062   0.141248 )
------------------------------------------------------------
Parameters  : value       lower 90%   higher 90%
Photon index: 1.20906     ( -0.141248   0.140062 )
Norm@50keV  : 2.32833E-02    ( -0.0018952   0.00189519 )
------------------------------------------------------------

Photon flux (15-150 keV)    in 1 sec: 2.73654 ( -0.22919  0.22946 ) ph/cm2/s
Energy fluence (15-150 keV)             : 2.35646e-07 ( -2.12286e-08  2.13522e-08 ) ergs/cm2
Cutoff power-law model
Time interval is from   -0.160 sec. to    0.840 sec.
 XSPEC: quit


Photon index: -1.06037     ( -0.272972   0.56581 )
------------------------------------------------------------
Parameters  : value       lower 90%   higher 90%
Photon index: 1.06037     ( -0.56581   0.272972 )
Epeak [keV] : 344.871      ( -344.871 -344.871 )
Norm@50keV  : 2.73918E-02    ( -0.00578105   0.0223757 )
------------------------------------------------------------

Photon flux (15-150 keV)    in 1 sec: 2.72262 ( -0.23426  0.23426 ) ph/cm2/s
Energy fluence (15-150 keV)             : 2.339e-07 ( -2.23417e-08  2.20705e-08 ) ergs/cm2
Time-resolved spectra
Distribution
T90 vs. Hardness ratio plot
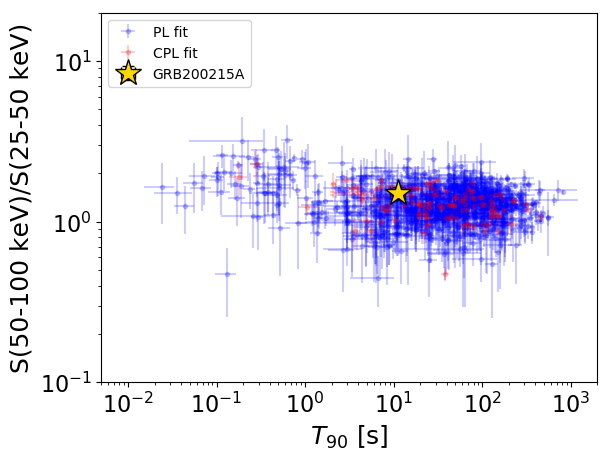
T90                                   = 11.148 sec.
Hardness ratio (energy fluence ratio) = 1.50921116585
S(15-50 keV) vs. S(50-150 keV) plot
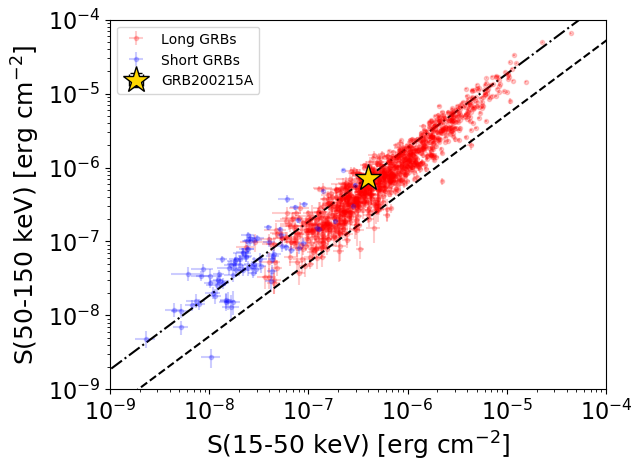
S(15-50 keV)  = 4.011648e-07
S(50-150 keV) = 7.225915e-07
The dash-dotted line and the dashed line traces the fluences calculated from the Band function with Epeak = 15 and 150 keV, respectively. Both lines assume a canonical values of alpha = -1 and beta = -2.5.
Mask shadow pattern
IMX = -6.605268263684679E-01, IMY = 1.431301994029492E-01
Spacecraft aspect plot
Bright source in the pre-burst/pre-slew/post-slew images
Pre-burst image of 15-350 keV band
Time interval of the image:
-239.416000 -9.972000

# RAcent  DECcent POSerr Theta    Phi  PeakCts   SNR AngSep     Name
#  [deg]    [deg]    ['] [deg]  [deg]                   [']
308.1098  40.9493   37.5  49.9  -25.9   0.1649   0.3    0.2	Cyg X-3
326.3518  38.3573   48.7  38.4  -38.1   0.0868   0.2    8.7	Cyg X-2
 12.7250  70.7380    2.3  27.1   38.2   1.2780   4.9 ------	UNKNOWN
 18.1793  48.0430    3.1   4.3   46.3   0.7086   3.8 ------	UNKNOWN
299.2486  45.5885    2.2  53.4  -16.8   3.0479   5.4 ------	UNKNOWN
323.9651  25.2605    2.7  47.0  -53.1   3.9126   4.2 ------	UNKNOWN
Pre-slew background subtracted image of 15-350 keV band
Time interval of the image:
-9.972000 5.368000

# RAcent  DECcent POSerr Theta    Phi  PeakCts   SNR AngSep     Name
#  [deg]    [deg]    ['] [deg]  [deg]                   [']
307.9966  40.9909    6.9  50.0  -25.8  -0.2030  -1.7    5.6	Cyg X-3
326.1800  38.3187  271.2  38.6  -38.1  -0.0033  -0.0    0.4	Cyg X-2
223.7010  86.2140    3.3  49.7   39.6   0.8486   3.5 ------	UNKNOWN
 34.1000  12.7754    0.4  34.1 -167.8   1.7727  31.2 ------	UNKNOWN
 38.9565  -7.2518    2.4  54.5 -164.5   0.9037   4.9 ------	UNKNOWN
Post-slew image of 15-350 keV band
Time interval of the image:
71.284600 962.695400

# RAcent  DECcent POSerr Theta    Phi  PeakCts   SNR AngSep     Name
#  [deg]    [deg]    ['] [deg]  [deg]                   [']
 47.2085 -19.9463    2.9  35.2  177.4   3.8227   4.0 ------	UNKNOWN
 29.2327 -19.5667    3.7  32.7 -152.4   2.7484   3.2 ------	UNKNOWN
 22.1264 -24.0181    3.1  38.6 -143.2   4.4932   3.7 ------	UNKNOWN
  7.8177 -27.8986    2.5  48.0 -129.1  13.8982   4.7 ------	UNKNOWN
  9.5078 -30.9406    2.4  49.7 -133.0  18.3590   4.8 ------	UNKNOWN