Analysis Summary
Notes:
- 1) No attempt has been made to eliminate the non-significant decimal places.
- 2) This batgrbproduct analysis is done using the HEASARC data.
- 3) This batgrbproduct analysis is using the flight position for the mask-weighting calculation.
======================================================================
                  BAT GRB EVENT DATA PROCESSING REPORT
    Process Script Ver: batgrbproduct v2.47
    Process Start Time: Mon May 18 14:41:11 EDT 2020
             Host Name: bat1
   Current Working Dir: /local/data/bat1/alien/Swift_3rdBATcatalog/event/batevent_reproc/trigger958141
======================================================================

  Trigger: 00958141      Segment: 000

  BAT Trigger Time: 604207513.792   [s; MET]
      Trigger Stop: 604207517.888   [s; MET]
               UTC: 2020-02-24T03:24:49.304000    [includes UTCF correction]
       Where From?: TDRSS position message

  BAT
    RA: 248.794294261897   Dec: 41.6752702574759  [deg; J2000]

     Catalogged Source?: NO
     Point Source?:      YES
     GRB Indicated?:     YES    [ by BAT flight software ]
     Image S/N Ratio:    6.8
     Image Trigger?:     NO
     Rate S/N Ratio:     10.7238052947636  [ if not an image trigger ]
     Image S/N Ratio:    6.8

  Analysis Position:   [ source = BAT ]
    RA: 248.794294261897   Dec: 41.6752702574759  [deg; J2000]

  Refined Position:   [ source = BAT pre-slew burst ]
    RA: 248.743357953247   Dec: 41.6657925200282  [deg; J2000]
        { 16h 34m 58.4s , +41d 39' 56.9" }
         +/- 3.50192149647006 [arcmin] (estimated 90% radius based on SNR)
         +/- 2.27280600428937 [arcmin] (formal 1-sigma fit error)
    SNR: 5.07618918817333

  Angular difference between the analysis and refined position is 2.352665 arcmin

  Partial Coding Fraction: 1.015625    [ including projection effects ]

  Duration
     T90: 45 +/- 9.21954445729289
        Measured from: -0.79200005531311
                   to: 44.2079999446869     [s; relative to TRIGTIME]
     T50: 30 +/- 20.0997512422418
        Measured from: 2.20799994468689
                   to: 32.2079999446869     [s; relative to TRIGTIME]


  Fluence
     Peak Flux  (peak 1 second)
        Measured from: 2.20799994468689
                   to: 3.20799994468689     [s; relative to TRIGTIME]
     Total Fluence
        Measured from: -0.79200005531311
                   to: 49.2079999446869     [s; relative to TRIGTIME]

             Band 1     Band 2     Band 3     Band 4
              15-25      25-50     50-100    100-350     keV
 Total     0.247527   0.093391   0.172701   0.047047
           0.042564   0.041388   0.035946   0.031581 [error]
 Peak      0.012647   0.013906   0.016637   0.004709
           0.006234   0.006129   0.005310   0.004531 [error]

     [ fluence units of on-axis counts / fully illuminated detector ]

======================================================================


====== Table of the duration information =============================

        Value   tstart    tstop
T100   50.000   -0.792   49.208
T90    45.000   -0.792   44.208
T50    30.000    2.208   32.208
Peak    1.000    2.208    3.208


====== Spectral Analysis Summary =====================================

Model      : spectral model: simple power-law (PL) and cutoff power-law (CPL)
Ph_index   : photon index: E^{Ph_index}
Ph_90err   : 90% error of the photon index
Epeak      : Epeak in keV
Epeak_90err: 90% error of Epeak
Norm       : normalization at 50 keV in both the PL model and CPL model
Nomr_90err : 90% error of the normalization
chi2       : Chi-Squared
dof        : degree of freedo

=== Time-averaged spectral analysis ===
(Best model with acceptable fit: PL)

Model Ph_index Ph_90err_low Ph_90err_hi  Epeak  Epeak_90err_low  Epeak_90err_hi  Norm       Nomr_90err_low    Norm_90err_hi    chi2    dof
PL      -1.685    -0.545      0.482       -           -               -         6.31e-04     -1.82e-04          1.63e-04      46.600   57
CPL     -2.020    -0.813      0.936        8.405      N/A           N/A         4.20e-04        N/A               N/A         45.930   56


=== 1-s peak spectral analysis ===
(Best model with acceptable fit: N/A)

Model Ph_index Ph_90err_low Ph_90err_hi  Epeak  Epeak_90err_low  Epeak_90err_hi  Norm       Nomr_90err_low    Norm_90err_hi    chi2    dof
PL      -1.092     -0.627     0.701       -           -               -         3.20e-03     -1.12e-03          1.11e-03      72.730   57
CPL     -0.996      0.996     4.352      576.175    -576.175      -576.175      3.54e-03     -1.40e-03          2.66e-01      72.720   56


=== Fluence/Peak Flux Summary ===

              Model    Band1     Band2     Band3     Band4     Band5     Total
                       15-25     25-50    50-100    100-350    15-150    15-350    keV
Fluence         PL   4.79e-08  7.87e-08  9.78e-08  2.41e-07  2.92e-07  4.66e-07   erg/cm2
      90%_error_low -1.78e-08 -1.78e-08 -3.87e-08 -1.54e-07 -8.40e-08 -1.95e-07   erg/cm2
      90%_error_hi   1.93e-08  1.77e-08  3.76e-08  2.70e-07  8.64e-08  2.90e-07   erg/cm2
Peak flux       PL   8.91e-02  1.14e-01  1.07e-01  1.77e-01  3.70e-01  4.88e-01   ph/cm2/s
      90%_error_low -5.57e-02 -5.14e-02 -4.17e-02 -1.12e-01 -1.33e-01 -1.74e-01   ph/cm2/s
      90%_error_hi   7.13e-02  4.86e-02  4.02e-02  2.04e-01  1.34e-01  1.90e-01   ph/cm2/s

Fluence        CPL   4.54e-08  2.44e-08  3.13e-08  2.39e-07  1.98e-07  4.83e-07   erg/cm2
      90%_error_low -1.98e-08    N/A    -3.05e-08    N/A       N/A    -2.26e-07   erg/cm2
      90%_error_hi   1.95e-08    N/A     4.07e-08    N/A       N/A     2.70e-07   erg/cm2
Peak flux      CPL   8.74e-02  1.15e-01  1.08e-01  1.62e-01  3.69e-01  4.72e-01   ph/cm2/s
      90%_error_low -7.06e-02 -5.20e-02 -4.27e-02 -1.62e-01 -1.40e-01 -2.37e-01   ph/cm2/s
      90%_error_hi   7.22e-02  5.66e-02  5.23e-02  1.19e-01  1.35e-01  1.99e-01   ph/cm2/s

======================================================================
Image
Pre-slew 15.0-350.0 keV image (Event data)
#   RAcent    DECcent   POSerr    Theta     Phi              Peak Cts       SNR   Name
  248.7434    41.6658   0.0378     6.9107   156.1812         0.4093704      5.076 TRIG_00958141

Foreground time interval of the image:
 -0.792  49.208 (delta_t =  50.000 [sec])
Background time interval of the image:
-239.792  -0.792 (delta_t = 239.000 [sec])
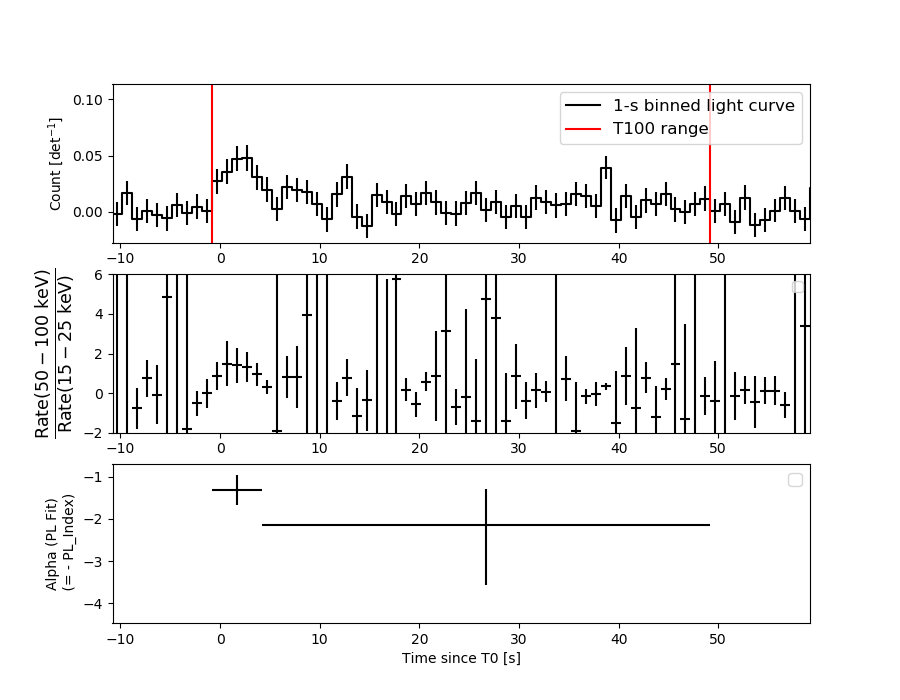
Light Curves
Note: The mask-weighted lightcurves have units of either count/det or counts/sec/det, where a det is 0.4 x 0.4 = 0.16 sq cm.
Full-time range; 1 s binning
Other quick-look light curves:
- 64 ms binning (zoomed)
- 16 ms binning (zoomed)
- 8 ms binning (zoomed)
- 2 ms binning (zoomed)
- SN=5 or 10 s binning (full-time range)
- Raw light curve
Spectra
- 64 ms binning (zoomed)
- 16 ms binning (zoomed)
- 8 ms binning (zoomed)
- 2 ms binning (zoomed)
- SN=5 or 10 s binning (full-time range)
- Raw light curve
Spectra
Notes:
- 1) The fitting includes the systematic errors.
- 2) When the burst includes telescope slew time periods, the fitting uses an average response file made from multiple 5-s response files through out the slew time plus single time preiod for the non-slew times, and weighted by the total counts in the corresponding time period using addrmf. An average response file is needed becuase a spectral fit using the pre-slew DRM will introduce some errors in both a spectral shape and a normalization if the PHA file contains a lot of the slew/post-slew time interval.
- 3) For fits to more complicated models (e.g. a power-law over a cutoff power-law), the BAT team has decided to require a chi-square improvement of more than 6 for each extra dof.
Time averaged spectrum fit using the average DRM
Power-law model
Time interval is from   -0.792 sec. to   49.208 sec.
XSPEC12>exit
 XSPEC: quit


Photon index: -1.6853     ( -0.544352   0.481797 )
------------------------------------------------------------
Parameters  : value       lower 90%   higher 90%
Photon index: 1.68530     ( -0.481797   0.544352 )
Norm@50keV  : 6.30884E-04    ( -0.000181816   0.000162555 )
------------------------------------------------------------

Photon flux (15-150 keV)    in 50 sec: 8.33672E-02 ( -0.0188701  0.0188738 ) ph/cm2/s
Energy fluence (15-150 keV)             : 2.92422e-07 ( -8.39875e-08  8.6387e-08 ) ergs/cm2
Cutoff power-law model
Time interval is from   -0.792 sec. to   49.208 sec.
 XSPEC: quit


Photon index: -2.15306     ( -0.680789   1.06905 )
------------------------------------------------------------
Parameters  : value       lower 90%   higher 90%
Photon index: 2.15306     ( -1.06905   0.680789 )
Epeak [keV] : 59.1840      (   )
Norm@50keV  : 3.66518E-04    (     )
------------------------------------------------------------

Photon flux (15-150 keV)    in 50 sec:  (    ) ph/cm2/s
Energy fluence (15-150 keV)             : 1.98199e-07 ( 0  0 ) ergs/cm2
1-s peak spectrum fit
Power-law model

Time interval is from    2.208 sec. to    3.208 sec.
XSPEC12>exit
 XSPEC: quit


Photon index: -1.09213     ( -0.627402   0.701099 )
------------------------------------------------------------
Parameters  : value       lower 90%   higher 90%
Photon index: 1.09213     ( -0.701099   0.627402 )
Norm@50keV  : 3.19583E-03    ( -0.00112443   0.00110697 )
------------------------------------------------------------

Photon flux (15-150 keV)    in 1 sec: 0.370417 ( -0.13255  0.134007 ) ph/cm2/s
Energy fluence (15-150 keV)             : 3.35012e-08 ( -1.23867e-08  1.26401e-08 ) ergs/cm2
Cutoff power-law model
Time interval is from    2.208 sec. to    3.208 sec.
 XSPEC: quit


Photon index: -0.995761     ( 1.00705   4.36373 )
------------------------------------------------------------
Parameters  : value       lower 90%   higher 90%
Photon index: 0.995761     ( -4.36373   -1.00705 )
Epeak [keV] : 576.175      ( -666.823 -666.823 )
Norm@50keV  : 3.53971E-03    ( -0.00134376   0.265829 )
------------------------------------------------------------

Photon flux (15-150 keV)    in 1 sec: 0.369091 ( -0.140415  0.135155 ) ph/cm2/s
Energy fluence (15-150 keV)             : 3.33434e-08 ( -1.38378e-08  1.27321e-08 ) ergs/cm2
Time-resolved spectra
Distribution
T90 vs. Hardness ratio plot
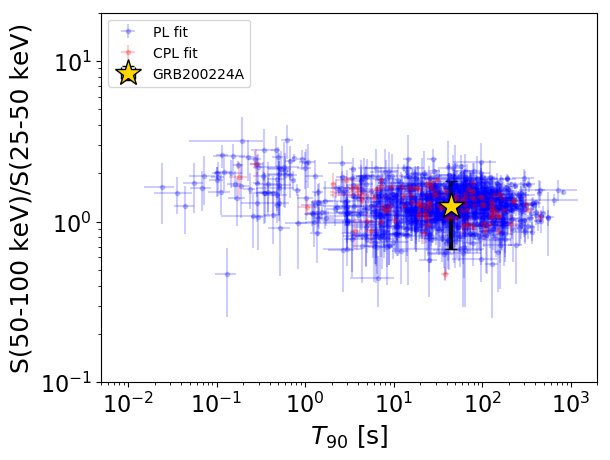
T90                                   = 45.0 sec.
Hardness ratio (energy fluence ratio) = 1.24354066043
S(15-50 keV) vs. S(50-150 keV) plot
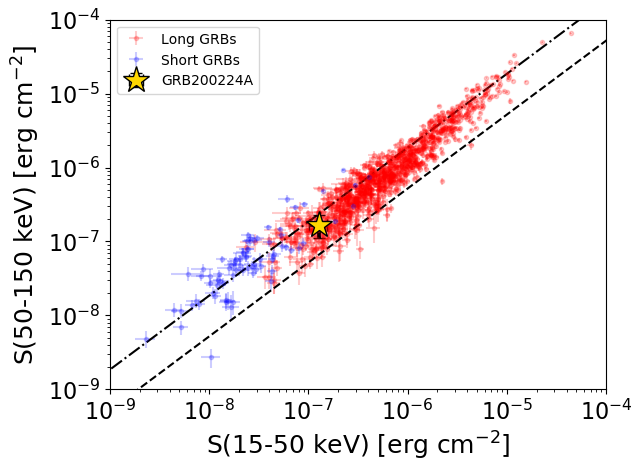
S(15-50 keV)  = 1.266355e-07
S(50-150 keV) = 1.6578735e-07
The dash-dotted line and the dashed line traces the fluences calculated from the Band function with Epeak = 15 and 150 keV, respectively. Both lines assume a canonical values of alpha = -1 and beta = -2.5.
Mask shadow pattern
IMX = -1.108792436603872E-01, IMY = -4.894704715791295E-02
Spacecraft aspect plot
Bright source in the pre-burst/pre-slew/post-slew images
Pre-burst image of 15-350 keV band
Time interval of the image:
-239.792000 -0.792000

# RAcent  DECcent POSerr Theta    Phi  PeakCts   SNR AngSep     Name
#  [deg]    [deg]    ['] [deg]  [deg]                   [']
244.9626 -15.6286    0.7  50.7   -8.1   9.2148  16.5    1.2	Sco X-1
254.4679  35.3173    0.9   3.5 -113.4   3.0767  13.0    1.6	Her X-1
268.3871  -1.3199    6.8  40.0  -43.6   0.7304   1.7    8.0	SW J1753.5-0127
299.5802  35.1813    1.1  40.0 -119.8   6.3430  10.8    1.3	Cyg X-1
308.0374  41.0894    5.2  45.2 -130.5   1.5998   2.2    8.8	Cyg X-3
331.4254  73.6291    3.0  54.3 -174.5   3.3543   3.8 ------	UNKNOWN
Pre-slew background subtracted image of 15-350 keV band
Time interval of the image:
-0.792000 49.208000

# RAcent  DECcent POSerr Theta    Phi  PeakCts   SNR AngSep     Name
#  [deg]    [deg]    ['] [deg]  [deg]                   [']
244.9807 -15.5906   14.9  50.7   -8.1   0.1568   0.8    3.0	Sco X-1
254.4604  35.3217  631.1   3.5 -113.5   0.0015   0.0    1.3	Her X-1
268.3779  -1.5345   23.1  40.2  -43.5   0.0800   0.5    4.9	SW J1753.5-0127
299.5559  35.2345    6.2  40.0 -119.9  -0.3838  -1.9    2.6	Cyg X-1
308.0548  40.7623    7.9  45.2 -130.1   0.4033   1.5   11.7	Cyg X-3
239.9910  56.7763    2.4  23.0  151.0   0.4533   4.8 ------	UNKNOWN
248.7409  41.6656    2.3   6.9  156.2   0.4076   5.1 ------	UNKNOWN
Post-slew image of 15-350 keV band
Time interval of the image:
81.308600 962.330900

# RAcent  DECcent POSerr Theta    Phi  PeakCts   SNR AngSep     Name
#  [deg]    [deg]    ['] [deg]  [deg]                   [']
244.9770 -15.6319    1.7  57.4   -4.0  22.6913   6.7    0.5	Sco X-1
254.4577  35.3399    0.8   7.7  -45.2   9.8891  15.1    0.2	Her X-1
268.5346  -1.3344    7.1  46.6  -36.1   2.2322   1.6   12.3	SW J1753.5-0127
299.5940  35.1896    1.0  39.7 -106.2  28.1126  11.9    0.7	Cyg X-1
307.9968  40.9709    5.1  43.6 -118.1  -6.4996  -2.2    5.3	Cyg X-3
200.1787  45.4584    4.2  34.9  104.7   3.8485   2.8 ------	UNKNOWN
228.9484   4.4050    2.8  41.3   22.5   4.3439   4.1 ------	UNKNOWN
311.7797  55.5209    3.2  42.3 -139.8   4.6873   3.6 ------	UNKNOWN
345.6892  61.5516    3.7  57.2 -154.1  13.3819   3.1 ------	UNKNOWN