Analysis Summary
Notes:
- 1) No attempt has been made to eliminate the non-significant decimal places.
- 2) This batgrbproduct analysis is done using the HEASARC data.
- 3) This batgrbproduct analysis is using the flight position for the mask-weighting calculation.
======================================================================
                  BAT GRB EVENT DATA PROCESSING REPORT
    Process Script Ver: batgrbproduct v2.47
    Process Start Time: Mon May 18 14:36:34 EDT 2020
             Host Name: bat1
   Current Working Dir: /local/data/bat1/alien/Swift_3rdBATcatalog/event/batevent_reproc/trigger958733
======================================================================

  Trigger: 00958733      Segment: 000

  BAT Trigger Time: 604581305.664   [s; MET]
      Trigger Stop: 604581313.856   [s; MET]
               UTC: 2020-02-28T11:14:41.151740    [includes UTCF correction]
       Where From?: TDRSS position message

  BAT
    RA: 252.025900508948   Dec: 16.9602927726214  [deg; J2000]

     Catalogged Source?: NO
     Point Source?:      YES
     GRB Indicated?:     YES    [ by BAT flight software ]
     Image S/N Ratio:    7.13
     Image Trigger?:     NO
     Rate S/N Ratio:     9.74679434480896  [ if not an image trigger ]
     Image S/N Ratio:    7.13

  Analysis Position:   [ source = BAT ]
    RA: 252.025900508948   Dec: 16.9602927726214  [deg; J2000]

  Refined Position:   [ source = BAT pre-slew burst ]
    RA: 252.00738688842   Dec: 16.9637778448686  [deg; J2000]
        { 16h 48m 01.8s , +16d 57' 49.6" }
         +/- 2.46818898680289 [arcmin] (estimated 90% radius based on SNR)
         +/- 0.969458862098571 [arcmin] (formal 1-sigma fit error)
    SNR: 8.36715461069679

  Angular difference between the analysis and refined position is 1.082876 arcmin

  Partial Coding Fraction: 0.3125    [ including projection effects ]

  Duration
     T90: 7.36799991130829 +/- 1.57555826006172
        Measured from: -0.580000042915344
                   to: 6.78799986839294     [s; relative to TRIGTIME]
     T50: 3.76800000667572 +/- 1.59487299974957
        Measured from: 1.39599990844727
                   to: 5.16399991512299     [s; relative to TRIGTIME]


  Fluence
     Peak Flux  (peak 1 second)
        Measured from: 1.31599998474121
                   to: 2.31599998474121     [s; relative to TRIGTIME]
     Total Fluence
        Measured from: -0.843999981880188
                   to: 6.96799993515015     [s; relative to TRIGTIME]

             Band 1     Band 2     Band 3     Band 4
              15-25      25-50     50-100    100-350     keV
 Total     0.213784   0.241939   0.087826   0.029460
           0.038513   0.035698   0.029308   0.025365 [error]
 Peak      0.067294   0.013172   0.018266   0.000895
           0.014146   0.012987   0.010706   0.009343 [error]

     [ fluence units of on-axis counts / fully illuminated detector ]

======================================================================


====== Table of the duration information =============================

        Value   tstart    tstop
T100    7.812   -0.844    6.968
T90     7.368   -0.580    6.788
T50     3.768    1.396    5.164
Peak    1.000    1.316    2.316


====== Spectral Analysis Summary =====================================

Model      : spectral model: simple power-law (PL) and cutoff power-law (CPL)
Ph_index   : photon index: E^{Ph_index}
Ph_90err   : 90% error of the photon index
Epeak      : Epeak in keV
Epeak_90err: 90% error of Epeak
Norm       : normalization at 50 keV in both the PL model and CPL model
Nomr_90err : 90% error of the normalization
chi2       : Chi-Squared
dof        : degree of freedo

=== Time-averaged spectral analysis ===
(Best model with acceptable fit: PL)

Model Ph_index Ph_90err_low Ph_90err_hi  Epeak  Epeak_90err_low  Epeak_90err_hi  Norm       Nomr_90err_low    Norm_90err_hi    chi2    dof
PL      -2.271    -0.387      0.342       -           -               -         4.05e-03     -1.05e-03          1.01e-03      57.350   57
CPL     -1.437    -0.628      2.474       26.359      N/A           N/A         1.28e-02        N/A               N/A         56.620   56


=== 1-s peak spectral analysis ===
(Best model with acceptable fit: N/A)

Model Ph_index Ph_90err_low Ph_90err_hi  Epeak  Epeak_90err_low  Epeak_90err_hi  Norm       Nomr_90err_low    Norm_90err_hi    chi2    dof
PL      -4.473     -2.677     1.614       -           -               -         1.01e-03     -1.01e-03          3.17e-03      42.680   57
CPL     -1.986      1.986     1.986        0.508      -0.462        17.039      1.48e-02     5.97e-02          1.40e-01      46.690   56


=== Fluence/Peak Flux Summary ===

              Model    Band1     Band2     Band3     Band4     Band5     Total
                       15-25     25-50    50-100    100-350    15-150    15-350    keV
Fluence         PL   8.37e-08  9.65e-08  8.00e-08  1.11e-07  3.00e-07  3.72e-07   erg/cm2
      90%_error_low -2.00e-08 -1.83e-08 -2.69e-08 -5.89e-08 -6.34e-08 -9.88e-08   erg/cm2
      90%_error_hi   2.07e-08  1.80e-08  2.85e-08  9.12e-08  6.56e-08  1.21e-07   erg/cm2
Peak flux       PL   7.93e-01  1.47e-01  1.32e-02  1.29e-03  9.54e-01  9.54e-01   ph/cm2/s
      90%_error_low -2.83e-01 -1.19e-01 -1.32e-02 -1.29e-03 -3.65e-01 -3.65e-01   ph/cm2/s
      90%_error_hi   2.77e-01  1.68e-01  6.69e-02  2.57e-02  3.62e-01  3.63e-01   ph/cm2/s

Fluence        CPL    N/A      N/A      N/A      N/A      N/A      N/A      erg/cm2
      90%_error_low -2.00e-08 -1.83e-08 -2.69e-08 -5.89e-08 -6.34e-08 -9.88e-08   erg/cm2
      90%_error_hi   2.07e-08  1.80e-08  2.85e-08  9.12e-08  6.56e-08  1.21e-07   erg/cm2
Peak flux      CPL   7.22e-01  8.58e-02  4.70e-03  3.29e-04  8.12e-01  8.13e-01   ph/cm2/s
      90%_error_low -3.03e-01 -8.58e-02 -4.70e-03 -3.29e-04 -3.80e-01 -3.80e-01   ph/cm2/s
      90%_error_hi   2.91e-01  1.71e-01  4.65e-02  1.44e-02  3.96e-01  3.97e-01   ph/cm2/s

======================================================================
Image
Pre-slew 15.0-350.0 keV image (Event data)
#   RAcent    DECcent   POSerr    Theta     Phi              Peak Cts       SNR   Name
  252.0074    16.9638   0.0230    39.3231   145.6634         0.5785641      8.367 TRIG_00958733

Foreground time interval of the image:
 -0.844   6.968 (delta_t =   7.812 [sec])
Background time interval of the image:
-239.664  -0.844 (delta_t = 238.820 [sec])
Light Curves
Note: The mask-weighted lightcurves have units of either count/det or counts/sec/det, where a det is 0.4 x 0.4 = 0.16 sq cm.
Full-time range; 1 s binning
Other quick-look light curves:
- 64 ms binning (zoomed)
- 16 ms binning (zoomed)
- 8 ms binning (zoomed)
- 2 ms binning (zoomed)
- SN=5 or 10 s binning (full-time range)
- Raw light curve
Spectra
- 64 ms binning (zoomed)
- 16 ms binning (zoomed)
- 8 ms binning (zoomed)
- 2 ms binning (zoomed)
- SN=5 or 10 s binning (full-time range)
- Raw light curve
Spectra
Notes:
- 1) The fitting includes the systematic errors.
- 2) When the burst includes telescope slew time periods, the fitting uses an average response file made from multiple 5-s response files through out the slew time plus single time preiod for the non-slew times, and weighted by the total counts in the corresponding time period using addrmf. An average response file is needed becuase a spectral fit using the pre-slew DRM will introduce some errors in both a spectral shape and a normalization if the PHA file contains a lot of the slew/post-slew time interval.
- 3) For fits to more complicated models (e.g. a power-law over a cutoff power-law), the BAT team has decided to require a chi-square improvement of more than 6 for each extra dof.
Time averaged spectrum fit using the average DRM
Power-law model
Time interval is from   -0.844 sec. to    6.968 sec.
XSPEC12>exit
 XSPEC: quit


Photon index: -2.27094     ( -0.387325   0.341722 )
------------------------------------------------------------
Parameters  : value       lower 90%   higher 90%
Photon index: 2.27094     ( -0.341722   0.387325 )
Norm@50keV  : 4.04532E-03    ( -0.00104604   0.00100617 )
------------------------------------------------------------

Photon flux (15-150 keV)    in 7.812 sec: 0.695782 ( -0.126362  0.126437 ) ph/cm2/s
Energy fluence (15-150 keV)             : 3.00499e-07 ( -6.3442e-08  6.55528e-08 ) ergs/cm2
Cutoff power-law model
Time interval is from   -0.844 sec. to    6.968 sec.
 XSPEC: quit


Photon index: -1.43687     ( -0.627889   2.47376 )
------------------------------------------------------------
Parameters  : value       lower 90%   higher 90%
Photon index: 1.43687     ( -2.47376   0.627889 )
Epeak [keV] : 26.3590      (   )
Norm@50keV  : 1.28340E-02    (     )
------------------------------------------------------------

Photon flux (15-150 keV)    in 7.812 sec: 0.677166 (    ) ph/cm2/s
Energy fluence (15-150 keV)             : 0 ( 0  0 ) ergs/cm2
1-s peak spectrum fit
Power-law model
Time interval is from    1.316 sec. to    2.316 sec.
XSPEC12>exit
 XSPEC: quit


Photon index: -4.47324     ( -2.67572   1.61495 )
------------------------------------------------------------
Parameters  : value       lower 90%   higher 90%
Photon index: 4.47324     ( -1.61495   2.67572 )
Norm@50keV  : 1.01188E-03    ( -0.00101022   0.00317389 )
------------------------------------------------------------

Photon flux (15-150 keV)    in 1 sec: 0.953921 ( -0.364586  0.362069 ) ph/cm2/s
Energy fluence (15-150 keV)             : 3.20908e-08 ( -1.46036e-08  1.89679e-08 ) ergs/cm2
Cutoff power-law model
Time interval is from    1.316 sec. to    2.316 sec.
 XSPEC: quit


Photon index: -1.98588     ( 1.98588   1.98588 )
------------------------------------------------------------
Parameters  : value       lower 90%   higher 90%
Photon index: 1.98588     ( -1.98588   -1.98588 )
Epeak [keV] : 0.118025      ( -0.0718928 17.4294 )
Norm@50keV  : 0.114801    ( -0.0403748   0.0403748 )
------------------------------------------------------------

Photon flux (15-150 keV)    in 1 sec: 0.812489 ( -0.379656  0.395621 ) ph/cm2/s
Energy fluence (15-150 keV)             : 0 ( 0  0 ) ergs/cm2
Time-resolved spectra

Distribution
T90 vs. Hardness ratio plot
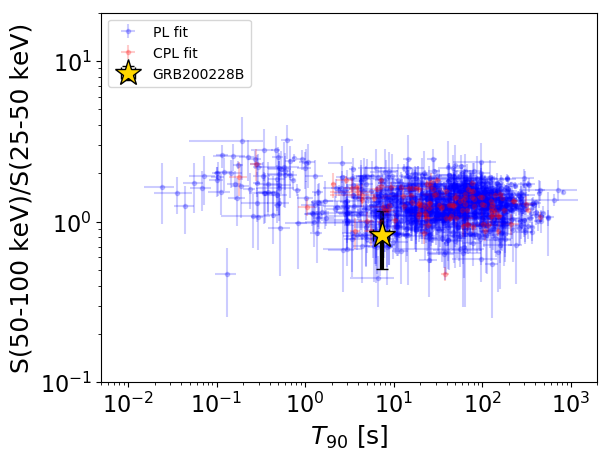
T90                                   = 7.368 sec.
Hardness ratio (energy fluence ratio) = 0.828819451459
S(15-50 keV) vs. S(50-150 keV) plot
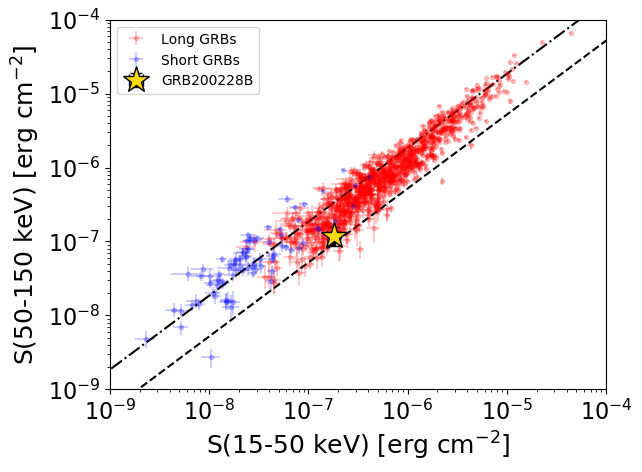
S(15-50 keV)  = 1.8021307e-07
S(50-150 keV) = 1.2028718e-07
The dash-dotted line and the dashed line traces the fluences calculated from the Band function with Epeak = 15 and 150 keV, respectively. Both lines assume a canonical values of alpha = -1 and beta = -2.5.
Mask shadow pattern
IMX = -6.764138944444137E-01, IMY = -4.620524165263773E-01
Spacecraft aspect plot
Bright source in the pre-burst/pre-slew/post-slew images
Pre-burst image of 15-350 keV band
Time interval of the image:
-239.664000 -0.844000

# RAcent  DECcent POSerr Theta    Phi  PeakCts   SNR AngSep     Name
#  [deg]    [deg]    ['] [deg]  [deg]                   [']
244.9800 -15.6516    0.7  28.3   86.6   7.9390  17.3    0.7	Sco X-1
254.3343  35.3143   36.4  54.3  160.6   0.4760   0.3    6.3	Her X-1
255.9390 -37.8087    3.0  27.6   33.5   1.3844   3.9    3.1	4U 1700-377
256.4056 -36.5662    6.7  26.4   34.7   0.6300   1.7    8.7	GX 349+2
262.9716 -24.7591    2.9  14.1   48.3   1.1702   4.0    2.2	GX 1+4
264.5660 -44.3178    6.4  29.9   14.9   0.6319   1.8   11.0	4U 1735-44
268.2811  -1.6027    3.6  15.2  156.9   0.9152   3.2   10.4	SW J1753.5-0127
270.1221 -24.9268    0.0  10.2   23.2   0.0474   0.2   12.7	GX 5-1
270.3580 -25.7154    5.5  10.8   20.5   0.6155   2.1    3.4	GRS 1758-258
274.0606 -13.8858    4.3   1.7  170.2   0.7591   2.7    9.6	GX 17+2
275.9156 -30.4078    4.4  14.9   -4.4   0.8176   2.6    2.5	H1820-303
284.8838 -25.0817    0.0  13.7  -43.6  -0.4665  -1.7   12.7	HT1900.1-2455
288.7527  10.8099  137.1  30.0 -150.1  -0.0316  -0.1    8.6	GRS 1915+105
299.4572  35.2404    3.7  56.1 -154.6   4.8470   3.1    6.9	Cyg X-1
262.8261 -33.6726    0.0  20.9   28.6   0.4320   1.3   12.7	GX 354-0
243.5292 -61.3943    2.7  50.8   19.2   3.4637   4.3 ------	UNKNOWN
322.0618 -47.7188    2.8  50.6  -39.3   5.2841   4.1 ------	UNKNOWN
312.8262   6.1640    2.9  43.8 -116.1   5.7975   4.0 ------	UNKNOWN
Pre-slew background subtracted image of 15-350 keV band
Time interval of the image:
-0.844000 6.968000

# RAcent  DECcent POSerr Theta    Phi  PeakCts   SNR AngSep     Name
#  [deg]    [deg]    ['] [deg]  [deg]                   [']
245.0605 -15.5175    9.6  28.2   86.9   0.0655   1.2    8.7	Sco X-1
254.5589  35.2279   10.4  54.2  160.8  -0.2188  -1.1    8.5	Her X-1
256.0084 -37.9951    6.1  27.7   33.1  -0.0830  -1.9    9.1	4U 1700-377
256.5200 -36.2878    5.8  26.1   34.9   0.0837   2.0    9.1	GX 349+2
263.1687 -24.6577   80.6  13.9   48.2   0.0048   0.1   10.2	GX 1+4
264.5677 -44.2868    0.0  29.9   14.9   0.0908   2.3   12.3	4U 1735-44
268.5135  -1.4575    3.1  15.3  157.9   0.1292   3.7    8.7	SW J1753.5-0127
270.1202 -25.1572   25.4  10.4   22.7   0.0151   0.5   10.1	GX 5-1
270.4673 -25.5960    0.0  10.7   20.2  -0.0562  -1.7   12.5	GRS 1758-258
274.1599 -13.9930   11.4   1.6  172.9   0.0333   1.0    9.3	GX 17+2
275.8193 -30.2250    4.7  14.7   -4.1  -0.0859  -2.5   10.1	H1820-303
285.1987 -24.9108    8.6  13.8  -44.9   0.0424   1.3    8.9	HT1900.1-2455
288.9501  10.7947    0.0  30.1 -149.7   0.0566   1.4   12.7	GRS 1915+105
299.6320  35.0553    7.0  56.0 -154.4  -0.2695  -1.7    9.0	Cyg X-1
263.1534 -33.9769    4.1  21.0   27.5  -0.0989  -2.8   11.8	GX 354-0
244.1591 -44.9782    2.4  38.9   35.3   0.3149   4.8 ------	UNKNOWN
252.0074  16.9638    1.4  39.3  145.7   0.5786   8.4 ------	UNKNOWN
297.4242 -66.0365    2.3  52.7  -10.8   0.4561   5.0 ------	UNKNOWN
305.0412 -59.1260    2.1  49.0  -19.5   0.3779   5.4 ------	UNKNOWN
Post-slew image of 15-350 keV band
Time interval of the image:
119.436600 302.526000

# RAcent  DECcent POSerr Theta    Phi  PeakCts   SNR AngSep     Name
#  [deg]    [deg]    ['] [deg]  [deg]                   [']
244.9794 -15.6404  601.3  33.3    4.6  -0.0547  -0.0    0.0	Sco X-1
254.5020  35.3455   23.8  18.5  178.5   1.1316   0.5    2.2	Her X-1
255.9090 -37.9535   43.6  55.0  -11.6   1.8644   0.3    7.5	4U 1700-377
256.4258 -36.3852   13.3  53.5  -12.2  -6.1865  -0.9    2.3	GX 349+2
262.9384 -24.7375    8.5  43.0  -22.4   4.8200   1.4    3.9	GX 1+4
268.4049  -1.3141    4.7  24.4  -50.9  -6.9196  -2.5    8.6	SW J1753.5-0127
270.3655 -25.0914    4.3  45.7  -31.3 -11.8374  -2.7    4.5	GX 5-1
270.3495 -25.7631    8.7  46.3  -30.9   6.1554   1.3    2.8	GRS 1758-258
273.9007 -13.8974    0.0  37.7  -44.1   2.3977   0.6   10.3	GX 17+2
276.0057 -30.2232    6.2  52.5  -34.1  17.1092   1.9    9.6	H1820-303
288.6432  10.9113    6.9  36.0  -93.1  -9.6400  -1.7    9.4	GRS 1915+105
299.6566  35.2598    7.1  46.0 -130.8  11.8834   1.6    4.8	Cyg X-1
262.8399 -33.8997    5.5  51.9  -19.3 -12.2072  -2.1    8.4	GX 354-0
239.4945  -8.2255    2.9  28.1   19.3  11.6988   4.0 ------	UNKNOWN
246.9439  16.6454    2.7   4.9   79.3  10.2413   4.3 ------	UNKNOWN
300.5167  40.2234    3.3  47.7 -137.3  23.3911   3.5 ------	UNKNOWN
302.3587  34.2807    2.7  48.0 -129.0  42.5518   4.4 ------	UNKNOWN