Analysis Summary
Notes:
- 1) No attempt has been made to eliminate the non-significant decimal places.
- 2) This batgrbproduct analysis is done using the HEASARC data.
- 3) This batgrbproduct analysis is using the flight position for the mask-weighting calculation.
======================================================================
BAT GRB EVENT DATA PROCESSING REPORT
Process Script Ver: batgrbproduct v2.47
Process Start Time: Mon May 18 14:28:51 EDT 2020
Host Name: bat1
Current Working Dir: /local/data/bat1/alien/Swift_3rdBATcatalog/event/batevent_reproc/trigger959917
======================================================================
Trigger: 00959917 Segment: 000
BAT Trigger Time: 605146804.736 [s; MET]
Trigger Stop: 605146805.76 [s; MET]
UTC: 2020-03-06T00:19:40.187060 [includes UTCF correction]
Where From?: TDRSS position message
BAT
RA: 101.148811669039 Dec: -62.013026745735 [deg; J2000]
Catalogged Source?: NO
Point Source?: YES
GRB Indicated?: YES [ by BAT flight software ]
Image S/N Ratio: 9.74
Image Trigger?: NO
Rate S/N Ratio: 18.8414436814168 [ if not an image trigger ]
Image S/N Ratio: 9.74
Analysis Position: [ source = BAT ]
RA: 101.148811669039 Dec: -62.013026745735 [deg; J2000]
Refined Position: [ source = BAT pre-slew burst ]
RA: 101.113280670331 Dec: -62.0098538497666 [deg; J2000]
{ 06h 44m 27.2s , -62d 00' 35.5" }
+/- 0.625662759378318 [arcmin] (estimated 90% radius based on SNR)
+/- 0.173415088697049 [arcmin] (formal 1-sigma fit error)
SNR: 59.437536418324
Angular difference between the analysis and refined position is 1.018423 arcmin
Partial Coding Fraction: 0.75 [ including projection effects ]
Duration
T90: 32.9639999866486 +/- 1.10926278881364
Measured from: 3.32000005245209
to: 36.2840000391006 [s; relative to TRIGTIME]
T50: 13.0119999647141 +/- 0.308933642302145
Measured from: 13.1000000238419
to: 26.1119999885559 [s; relative to TRIGTIME]
Fluence
Peak Flux (peak 1 second)
Measured from: 20.0600000619888
to: 21.0600000619888 [s; relative to TRIGTIME]
Total Fluence
Measured from: -3.67199993133545
to: 49.9520000219345 [s; relative to TRIGTIME]
Band 1 Band 2 Band 3 Band 4
15-25 25-50 50-100 100-350 keV
Total 4.550567 6.648848 4.704234 0.886392
0.062574 0.068956 0.060818 0.046516 [error]
Peak 0.206769 0.320929 0.258770 0.043138
0.010713 0.012547 0.011301 0.007522 [error]
[ fluence units of on-axis counts / fully illuminated detector ]
======================================================================
====== Table of the duration information =============================
Value tstart tstop
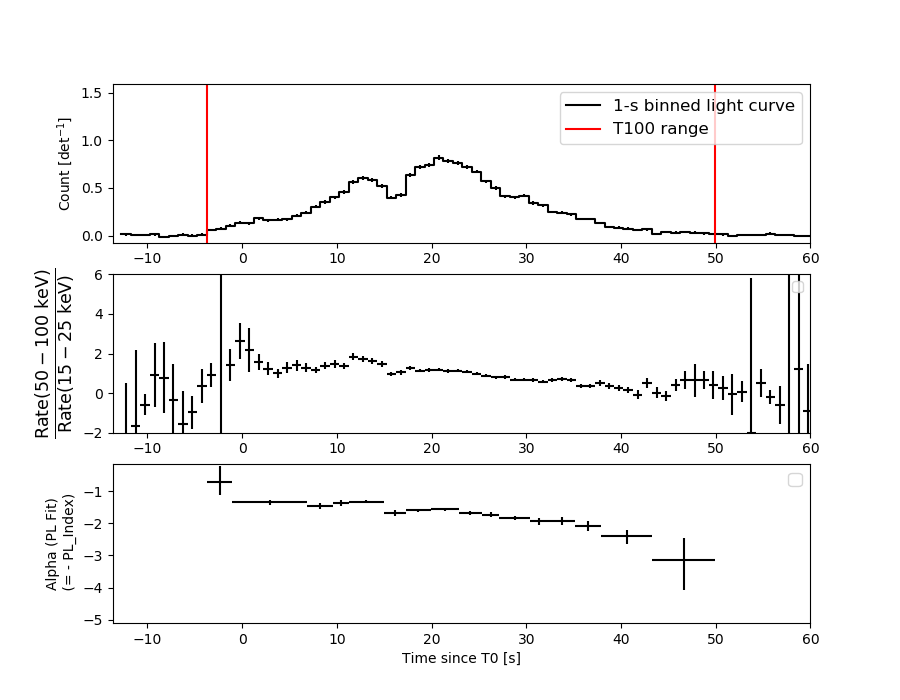
T100 53.624 -3.672 49.952
T90 32.964 3.320 36.284
T50 13.012 13.100 26.112
Peak 1.000 20.060 21.060
====== Spectral Analysis Summary =====================================
Model : spectral model: simple power-law (PL) and cutoff power-law (CPL)
Ph_index : photon index: E^{Ph_index}
Ph_90err : 90% error of the photon index
Epeak : Epeak in keV
Epeak_90err: 90% error of Epeak
Norm : normalization at 50 keV in both the PL model and CPL model
Nomr_90err : 90% error of the normalization
chi2 : Chi-Squared
dof : degree of freedo
=== Time-averaged spectral analysis ===
(Best model with acceptable fit: CPL)
Model Ph_index Ph_90err_low Ph_90err_hi Epeak Epeak_90err_low Epeak_90err_hi Norm Nomr_90err_low Norm_90err_hi chi2 dof
PL -1.694 -0.031 0.031 - - - 2.10e-02 -3.60e-04 3.60e-04 90.130 57
CPL -1.066 -0.143 0.147 83.460 -6.133 8.838 4.01e-02 -5.33e-03 6.35e-03 28.250 56
=== 1-s peak spectral analysis ===
(Best model with acceptable fit: CPL)
Model Ph_index Ph_90err_low Ph_90err_hi Epeak Epeak_90err_low Epeak_90err_hi Norm Nomr_90err_low Norm_90err_hi chi2 dof
PL -1.517 -0.074 0.074 - - - 5.60e-02 -2.54e-03 2.54e-03 57.050 57
CPL -0.688 -0.328 0.354 81.865 -11.004 21.157 1.43e-01 -4.35e-02 6.86e-02 36.350 56
=== Fluence/Peak Flux Summary ===
Model Band1 Band2 Band3 Band4 Band5 Total
15-25 25-50 50-100 100-350 15-150 15-350 keV
Fluence PL 1.73e-06 2.82e-06 3.49e-06 8.52e-06 1.04e-05 1.66e-05 erg/cm2
90%_error_low -5.97e-08 -5.78e-08 -6.99e-08 -3.80e-07 -1.80e-07 -4.15e-07 erg/cm2
90%_error_hi 6.05e-08 5.77e-08 6.98e-08 3.91e-07 1.79e-07 4.23e-07 erg/cm2
Peak flux PL 2.34e+00 2.33e+00 1.63e+00 1.80e+00 7.02e+00 8.11e+00 ph/cm2/s
90%_error_low -1.78e-01 -1.13e-01 -9.01e-02 -1.93e-01 -3.24e-01 -3.64e-01 ph/cm2/s
90%_error_hi 1.82e-01 1.13e-01 8.97e-02 2.06e-01 3.25e-01 3.65e-01 ph/cm2/s
Fluence CPL 1.46e-06 2.90e-06 3.68e-06 4.36e-06 1.01e-05 1.24e-05 erg/cm2
90%_error_low -7.75e-08 -6.27e-08 -8.31e-08 -5.45e-07 -1.97e-07 -5.78e-07 erg/cm2
90%_error_hi 7.90e-08 6.28e-08 8.34e-08 6.43e-07 1.97e-07 6.66e-07 erg/cm2
Peak flux CPL 1.99e+00 2.50e+00 1.76e+00 8.44e-01 6.79e+00 7.09e+00 ph/cm2/s
90%_error_low -2.17e-01 -1.34e-01 -1.07e-01 -2.08e-01 -3.36e-01 -4.03e-01 ph/cm2/s
90%_error_hi 2.21e-01 1.36e-01 1.08e-01 2.76e-01 3.36e-01 4.29e-01 ph/cm2/s
======================================================================
Image
Pre-slew 15.0-350.0 keV image (Event data)
#   RAcent    DECcent   POSerr    Theta     Phi              Peak Cts       SNR   Name
  101.1133   -62.0099   0.0032    30.9856   178.3138         5.3499839     59.438 TRIG_00959917

Foreground time interval of the image:
 -3.672  14.965 (delta_t =  18.637 [sec])
Background time interval of the image:
-239.736  -3.672 (delta_t = 236.064 [sec])
Light Curves
Note: The mask-weighted lightcurves have units of either count/det or counts/sec/det, where a det is 0.4 x 0.4 = 0.16 sq cm.
Full-time range; 1 s binning
Other quick-look light curves:
- 64 ms binning (zoomed)
- 16 ms binning (zoomed)
- 8 ms binning (zoomed)
- 2 ms binning (zoomed)
- SN=5 or 10 s binning (full-time range)
- Raw light curve
Spectra
- 64 ms binning (zoomed)
- 16 ms binning (zoomed)
- 8 ms binning (zoomed)
- 2 ms binning (zoomed)
- SN=5 or 10 s binning (full-time range)
- Raw light curve
Spectra
Notes:
- 1) The fitting includes the systematic errors.
- 2) When the burst includes telescope slew time periods, the fitting uses an average response file made from multiple 5-s response files through out the slew time plus single time preiod for the non-slew times, and weighted by the total counts in the corresponding time period using addrmf. An average response file is needed becuase a spectral fit using the pre-slew DRM will introduce some errors in both a spectral shape and a normalization if the PHA file contains a lot of the slew/post-slew time interval.
- 3) For fits to more complicated models (e.g. a power-law over a cutoff power-law), the BAT team has decided to require a chi-square improvement of more than 6 for each extra dof.
Time averaged spectrum fit using the average DRM
Power-law model
Time interval is from   -3.672 sec. to   49.952 sec.
XSPEC12>exit
 XSPEC: quit


Photon index: -1.69398     ( -0.0313667   0.0313685 )
------------------------------------------------------------
Parameters  : value       lower 90%   higher 90%
Photon index: 1.69398     ( -0.0313685   0.0313667 )
Norm@50keV  : 2.10218E-02    ( -0.000359732   0.000359718 )
------------------------------------------------------------

Photon flux (15-150 keV)    in 53.62 sec: 2.78619 ( -0.05754  0.05777 ) ph/cm2/s
Energy fluence (15-150 keV)             : 1.0443e-05 ( -1.795e-07  1.7947e-07 ) ergs/cm2
Cutoff power-law model
Time interval is from   -3.672 sec. to   49.952 sec.
 XSPEC: quit


Photon index: -1.06626     ( -0.142501   0.146838 )
------------------------------------------------------------
Parameters  : value       lower 90%   higher 90%
Photon index: 1.06626     ( -0.146838   0.142501 )
Epeak [keV] : 83.4595      ( -6.13276 8.83839 )
Norm@50keV  : 4.00620E-02    ( -0.0053348   0.00635217 )
------------------------------------------------------------

Photon flux (15-150 keV)    in 53.62 sec: 2.63896 ( -0.06392  0.06437 ) ph/cm2/s
Energy fluence (15-150 keV)             : 1.00713e-05 ( -1.97254e-07  1.97395e-07 ) ergs/cm2
1-s peak spectrum fit
Power-law model
Time interval is from   20.060 sec. to   21.060 sec.
XSPEC12>exit
 XSPEC: quit


Photon index: -1.51677     ( -0.0742351   0.0737806 )
------------------------------------------------------------
Parameters  : value       lower 90%   higher 90%
Photon index: 1.51677     ( -0.0737806   0.0742351 )
Norm@50keV  : 5.59982E-02    ( -0.00254155   0.00253827 )
------------------------------------------------------------

Photon flux (15-150 keV)    in 1 sec: 7.02297 ( -0.32431  0.32465 ) ph/cm2/s
Energy fluence (15-150 keV)             : 5.29871e-07 ( -2.58136e-08  2.58925e-08 ) ergs/cm2
Cutoff power-law model
Time interval is from   20.060 sec. to   21.060 sec.
 XSPEC: quit


Photon index: -0.68796     ( -0.327955   0.354237 )
------------------------------------------------------------
Parameters  : value       lower 90%   higher 90%
Photon index: 0.687960     ( -0.354237   0.327955 )
Epeak [keV] : 81.8649      ( -11.0036 21.1571 )
Norm@50keV  : 0.143086    ( -0.0434652   0.0685933 )
------------------------------------------------------------

Photon flux (15-150 keV)    in 1 sec: 6.79109 ( -0.33594  0.33625 ) ph/cm2/s
Energy fluence (15-150 keV)             : 5.07026e-07 ( -2.7679e-08  2.76861e-08 ) ergs/cm2
Time-resolved spectra
Distribution
T90 vs. Hardness ratio plot
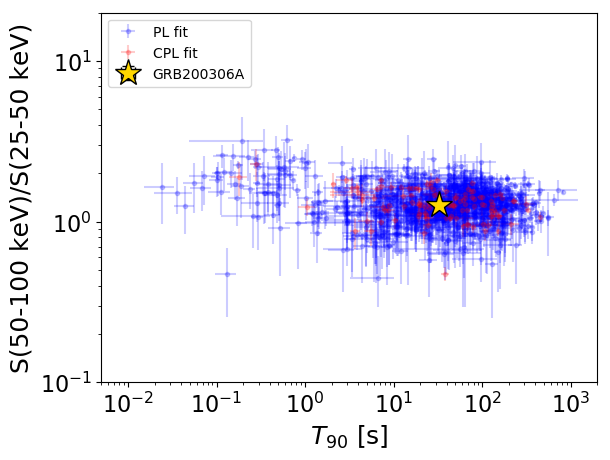
T90                                   = 32.964 sec.
Hardness ratio (energy fluence ratio) = 1.26934613036
S(15-50 keV) vs. S(50-150 keV) plot
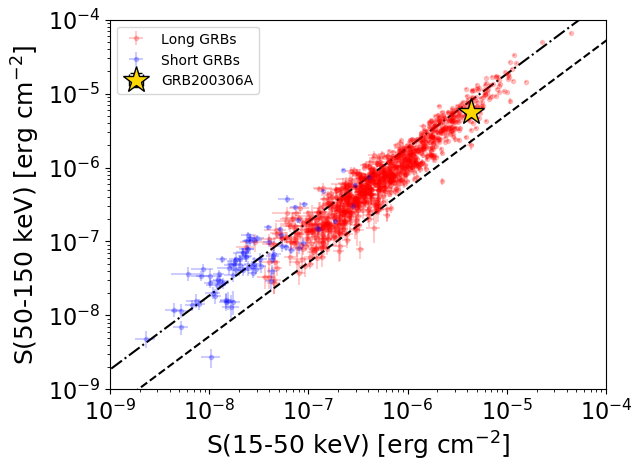
S(15-50 keV)  = 4.362845e-06
S(50-150 keV) = 5.708617e-06
The dash-dotted line and the dashed line traces the fluences calculated from the Band function with Epeak = 15 and 150 keV, respectively. Both lines assume a canonical values of alpha = -1 and beta = -2.5.
Mask shadow pattern
IMX = -6.002578426180583E-01, IMY = -1.767021167549318E-02
Spacecraft aspect plot
Bright source in the pre-burst/pre-slew/post-slew images
Pre-burst image of 15-350 keV band
Time interval of the image:
-239.736000 -3.672000

# RAcent  DECcent POSerr Theta    Phi  PeakCts   SNR AngSep     Name
#  [deg]    [deg]    ['] [deg]  [deg]                   [']
 83.6264  22.0380    1.4  54.4    6.0   7.7853   8.2    1.5	Crab
135.5690 -40.4382    6.8  39.0  126.6   1.4490   1.7    7.2	Vela X-1
106.9767  -2.6858    2.8  34.7   46.1   1.9711   4.2 ------	UNKNOWN
162.6208 -70.5962    2.6  54.8  167.5   6.4105   4.5 ------	UNKNOWN
 87.9106  23.7184    3.0  56.0   10.9   5.3029   3.8 ------	UNKNOWN
 66.5696  18.3942    2.6  54.5  -14.2   3.2971   4.4 ------	UNKNOWN
 61.8275 -38.8091    2.1  21.9 -104.0   1.5805   5.6 ------	UNKNOWN
 61.2259   6.7008    2.3  46.4  -27.0   2.4422   5.1 ------	UNKNOWN
 51.2288   4.6857    3.3  50.6  -39.4   3.4608   3.5 ------	UNKNOWN
 26.3494 -56.7883    2.9  48.0 -129.2   4.6558   4.0 ------	UNKNOWN
Pre-slew background subtracted image of 15-350 keV band
Time interval of the image:
-3.672000 14.964570

# RAcent  DECcent POSerr Theta    Phi  PeakCts   SNR AngSep     Name
#  [deg]    [deg]    ['] [deg]  [deg]                   [']
 83.7312  21.9961  506.7  54.4    6.1  -0.0065  -0.0    5.6	Crab
135.3699 -40.6244   22.3  38.8  126.9  -0.1031  -0.5    8.4	Vela X-1
101.1133 -62.0099    0.2  31.0  178.3   5.3498  59.4 ------	UNKNOWN
 63.4481  12.9420    3.0  50.8  -20.4   0.6904   3.8 ------	UNKNOWN
 24.0314 -77.5046    2.7  53.0 -155.4   1.0501   4.3 ------	UNKNOWN
Post-slew image of 15-350 keV band
Time interval of the image:
66.164600 453.564600

# RAcent  DECcent POSerr Theta    Phi  PeakCts   SNR AngSep     Name
#  [deg]    [deg]    ['] [deg]  [deg]                   [']
135.5704 -40.5747    3.0  29.7   84.2   2.2322   3.9    2.3	Vela X-1
170.3598 -60.6078    2.4  31.7  143.3   2.8158   4.8    1.6	Cen X-3
186.6985 -62.7921    5.6  36.7  154.5   1.3897   2.1    1.7	GX 301-2
151.4509 -42.8247    3.5  34.9  104.7   2.3728   3.3 ------	UNKNOWN
109.8697 -17.2573    2.3  45.2   36.0   4.1093   5.0 ------	UNKNOWN
 82.6002  -8.2080    2.4  55.5    1.8   5.9998   4.8 ------	UNKNOWN
256.6637 -67.7443    2.8  49.1 -167.8   3.9722   4.0 ------	UNKNOWN
 70.4981 -29.5800    2.7  38.1  -21.7   2.0527   4.2 ------	UNKNOWN
 49.4327 -68.0327    2.3  21.9 -104.0   1.9949   5.0 ------	UNKNOWN