Analysis Summary
Notes:
- 1) No attempt has been made to eliminate the non-significant decimal places.
- 2) This batgrbproduct analysis is done using the HEASARC data.
- 3) This batgrbproduct analysis is using the flight position for the mask-weighting calculation.
======================================================================
BAT GRB EVENT DATA PROCESSING REPORT
Process Script Ver: batgrbproduct v2.47
Process Start Time: Mon May 18 14:26:59 EDT 2020
Host Name: bat1
Current Working Dir: /local/data/bat1/alien/Swift_3rdBATcatalog/event/batevent_reproc/trigger960102
======================================================================
Trigger: 00960102 Segment: 000
BAT Trigger Time: 605227863.616 [s; MET]
Trigger Stop: 605227867.712 [s; MET]
UTC: 2020-03-06T22:50:39.061800 [includes UTCF correction]
Where From?: TDRSS position message
BAT
RA: 198.58161324179 Dec: 11.2550650612691 [deg; J2000]
Catalogged Source?: NO
Point Source?: YES
GRB Indicated?: YES [ by BAT flight software ]
Image S/N Ratio: 7.35
Image Trigger?: NO
Rate S/N Ratio: 14.1067359796659 [ if not an image trigger ]
Image S/N Ratio: 7.35
Analysis Position: [ source = BAT ]
RA: 198.58161324179 Dec: 11.2550650612691 [deg; J2000]
Refined Position: [ source = BAT pre-slew burst ]
RA: 198.577720442576 Dec: 11.2631612679907 [deg; J2000]
{ 13h 14m 18.7s , +11d 15' 47.4" }
+/- 1.27543677510759 [arcmin] (estimated 90% radius based on SNR)
+/- 0.396705734205899 [arcmin] (formal 1-sigma fit error)
SNR: 21.4870623616894
Angular difference between the analysis and refined position is 0.537075 arcmin
Partial Coding Fraction: 0.4296875 [ including projection effects ]
Duration
T90: 53.1520000696182 +/- 13.7253143456788
Measured from: -8.8160001039505
to: 44.3359999656677 [s; relative to TRIGTIME]
T50: 19.055999994278 +/- 3.82256871307867
Measured from: -0.976000070571899
to: 18.0799999237061 [s; relative to TRIGTIME]
Fluence
Peak Flux (peak 1 second)
Measured from: 3.57199990749359
to: 4.57199990749359 [s; relative to TRIGTIME]
Total Fluence
Measured from: -12.0640000104904
to: 48.0159999132156 [s; relative to TRIGTIME]
Band 1 Band 2 Band 3 Band 4
15-25 25-50 50-100 100-350 keV
Total 0.569615 1.120629 1.276245 0.601628
0.073634 0.077388 0.070090 0.060902 [error]
Peak 0.035700 0.046552 0.058793 0.015848
0.010308 0.011157 0.009774 0.008292 [error]
[ fluence units of on-axis counts / fully illuminated detector ]
======================================================================
====== Table of the duration information =============================
Value tstart tstop
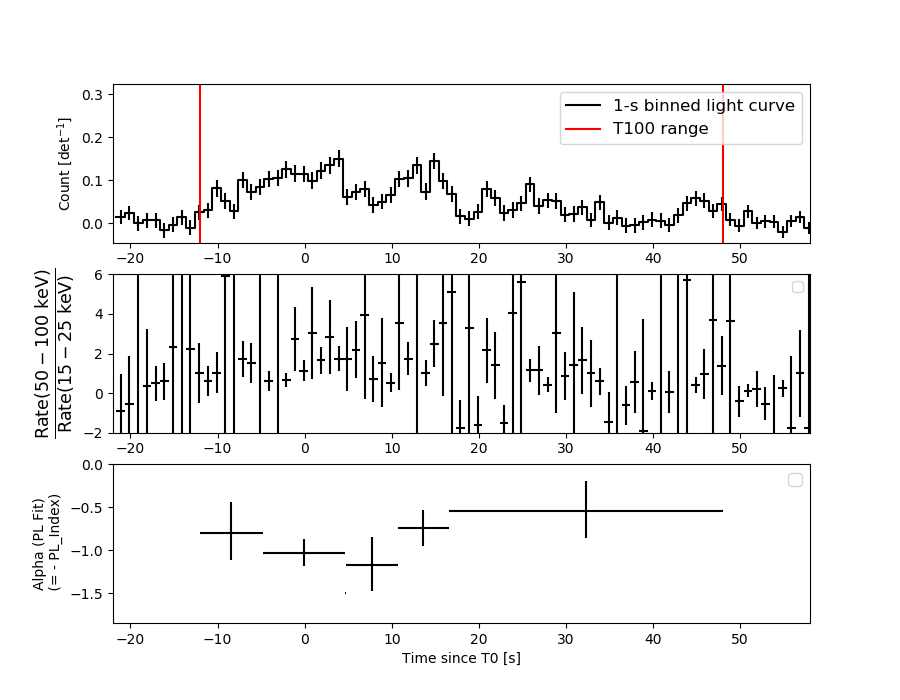
T100 60.080 -12.064 48.016
T90 53.152 -8.816 44.336
T50 19.056 -0.976 18.080
Peak 1.000 3.572 4.572
====== Spectral Analysis Summary =====================================
Model : spectral model: simple power-law (PL) and cutoff power-law (CPL)
Ph_index : photon index: E^{Ph_index}
Ph_90err : 90% error of the photon index
Epeak : Epeak in keV
Epeak_90err: 90% error of Epeak
Norm : normalization at 50 keV in both the PL model and CPL model
Nomr_90err : 90% error of the normalization
chi2 : Chi-Squared
dof : degree of freedo
=== Time-averaged spectral analysis ===
(Best model with acceptable fit: N/A)
Model Ph_index Ph_90err_low Ph_90err_hi Epeak Epeak_90err_low Epeak_90err_hi Norm Nomr_90err_low Norm_90err_hi chi2 dof
PL -0.827 -0.118 0.122 - - - 4.03e-03 -2.79e-04 2.75e-04 71.160 57
CPL -0.819 -0.119 0.122 9997.610 -9997.610 -9997.610 4.06e-03 -2.60e-04 1.39e-03 71.190 56
=== 1-s peak spectral analysis ===
(Best model with acceptable fit: PL)
Model Ph_index Ph_90err_low Ph_90err_hi Epeak Epeak_90err_low Epeak_90err_hi Norm Nomr_90err_low Norm_90err_hi chi2 dof
PL -1.059 -0.367 0.395 - - - 1.04e-02 -2.18e-03 2.16e-03 47.840 57
CPL -0.828 0.828 1.563 294.753 -294.753 -294.753 1.32e-02 -4.58e-03 4.14e-02 47.850 56
=== Fluence/Peak Flux Summary ===
Model Band1 Band2 Band3 Band4 Band5 Total
15-25 25-50 50-100 100-350 15-150 15-350 keV
Fluence PL 1.65e-07 4.61e-07 1.04e-06 6.25e-06 2.80e-06 7.91e-06 erg/cm2
90%_error_low -2.46e-08 -4.19e-08 -6.61e-08 -9.26e-07 -1.80e-07 -9.45e-07 erg/cm2
90%_error_hi 2.62e-08 4.14e-08 6.60e-08 1.05e-06 1.80e-07 1.06e-06 erg/cm2
Peak flux PL 2.81e-01 3.68e-01 3.54e-01 6.04e-01 1.20e+00 1.61e+00 ph/cm2/s
90%_error_low -1.15e-01 -1.01e-01 -7.84e-02 -2.49e-01 -2.59e-01 -3.41e-01 ph/cm2/s
90%_error_hi 1.35e-01 9.71e-02 7.70e-02 3.53e-01 2.61e-01 3.57e-01 ph/cm2/s
Fluence CPL 1.65e-07 4.60e-07 1.03e-06 6.44e-06 2.81e-06 7.86e-06 erg/cm2
90%_error_low N/A -4.57e-08 -6.03e-08 -2.28e-06 N/A -2.01e-06 erg/cm2
90%_error_hi N/A 4.58e-08 9.16e-08 2.69e-07 N/A 4.90e-07 erg/cm2
Peak flux CPL 2.74e-01 3.70e-01 3.58e-01 5.45e-01 1.20e+00 1.55e+00 ph/cm2/s
90%_error_low -1.49e-01 -1.01e-01 -8.16e-02 -5.45e-01 -2.72e-01 -5.21e-01 ph/cm2/s
90%_error_hi 1.19e-01 1.04e-01 9.76e-02 2.48e-01 2.65e-01 4.05e-01 ph/cm2/s
======================================================================
Image
Pre-slew 15.0-350.0 keV image (Event data)
#   RAcent    DECcent   POSerr    Theta     Phi              Peak Cts       SNR   Name
  198.5777    11.2632   0.0089    30.6281    58.5061         3.2381128     21.487 TRIG_00960102

Foreground time interval of the image:
-12.064  37.085 (delta_t =  49.149 [sec])
Background time interval of the image:
-239.616 -12.064 (delta_t = 227.552 [sec])
Light Curves
Note: The mask-weighted lightcurves have units of either count/det or counts/sec/det, where a det is 0.4 x 0.4 = 0.16 sq cm.
Full-time range; 1 s binning
Other quick-look light curves:
- 64 ms binning (zoomed)
- 16 ms binning (zoomed)
- 8 ms binning (zoomed)
- 2 ms binning (zoomed)
- SN=5 or 10 s binning (full-time range)
- Raw light curve
Spectra
- 64 ms binning (zoomed)
- 16 ms binning (zoomed)
- 8 ms binning (zoomed)
- 2 ms binning (zoomed)
- SN=5 or 10 s binning (full-time range)
- Raw light curve
Spectra
Notes:
- 1) The fitting includes the systematic errors.
- 2) When the burst includes telescope slew time periods, the fitting uses an average response file made from multiple 5-s response files through out the slew time plus single time preiod for the non-slew times, and weighted by the total counts in the corresponding time period using addrmf. An average response file is needed becuase a spectral fit using the pre-slew DRM will introduce some errors in both a spectral shape and a normalization if the PHA file contains a lot of the slew/post-slew time interval.
- 3) For fits to more complicated models (e.g. a power-law over a cutoff power-law), the BAT team has decided to require a chi-square improvement of more than 6 for each extra dof.
Time averaged spectrum fit using the average DRM
Power-law model
Time interval is from  -12.064 sec. to   48.016 sec.
XSPEC12>exit
 XSPEC: quit


Photon index: -0.82675     ( -0.117849   0.122078 )
------------------------------------------------------------
Parameters  : value       lower 90%   higher 90%
Photon index: 0.826750     ( -0.122078   0.117849 )
Norm@50keV  : 4.03460E-03    ( -0.000278558   0.000274831 )
------------------------------------------------------------

Photon flux (15-150 keV)    in 60.08 sec: 0.463334 ( -0.031131  0.031304 ) ph/cm2/s
Energy fluence (15-150 keV)             : 2.80156e-06 ( -1.79698e-07  1.80112e-07 ) ergs/cm2
Cutoff power-law model

Time interval is from  -12.064 sec. to   48.016 sec.
 XSPEC: quit


Photon index: -0.818719     ( -0.119355   0.122534 )
------------------------------------------------------------
Parameters  : value       lower 90%   higher 90%
Photon index: 0.818719     ( -0.122534   0.119355 )
Epeak [keV] : 9997.61      ( -9998.22 -9998.22 )
Norm@50keV  : 4.06179E-03    ( -0.000259903   0.00138884 )
------------------------------------------------------------

Photon flux (15-150 keV)    in 60.08 sec: 0.465571 ( -0.033514  0.028859 ) ph/cm2/s
Energy fluence (15-150 keV)             : 2.81061e-06 ( 0  0 ) ergs/cm2
1-s peak spectrum fit
Power-law model
Time interval is from    3.572 sec. to    4.572 sec.
XSPEC12>exit
 XSPEC: quit


Photon index: -1.0592     ( -0.367468   0.394958 )
------------------------------------------------------------
Parameters  : value       lower 90%   higher 90%
Photon index: 1.05920     ( -0.394958   0.367468 )
Norm@50keV  : 1.04158E-02    ( -0.00218155   0.00215608 )
------------------------------------------------------------

Photon flux (15-150 keV)    in 1 sec: 1.20384 ( -0.258833  0.26105 ) ph/cm2/s
Energy fluence (15-150 keV)             : 1.10372e-07 ( -2.3919e-08  2.41149e-08 ) ergs/cm2
Cutoff power-law model
Time interval is from    3.572 sec. to    4.572 sec.
 XSPEC: quit


Photon index: -0.927399     ( 0.840769   1.57583 )
------------------------------------------------------------
Parameters  : value       lower 90%   higher 90%
Photon index: 0.927399     ( -1.57583   -0.840769 )
Epeak [keV] : 459.953      ( -322.703 -322.703 )
Norm@50keV  : 1.18782E-02    ( -0.00313934   0.0428783 )
------------------------------------------------------------

Photon flux (15-150 keV)    in 1 sec: 1.19787 ( -0.271907  0.26493 ) ph/cm2/s
Energy fluence (15-150 keV)             : 2.03105e-08 ( 0  0 ) ergs/cm2
Time-resolved spectra
Distribution
T90 vs. Hardness ratio plot
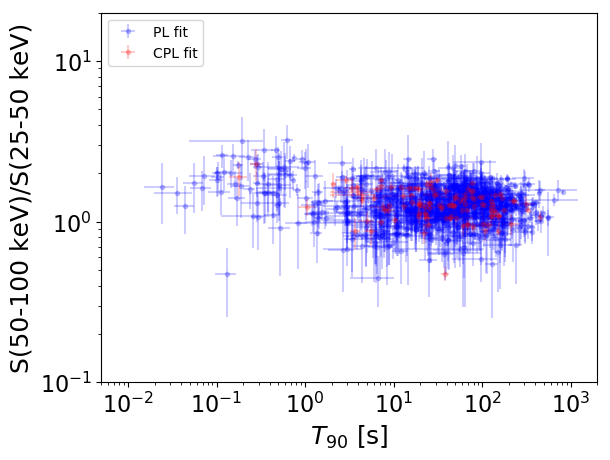
T90                                   = N/A sec.
Hardness ratio (energy fluence ratio) = N/A
S(15-50 keV) vs. S(50-150 keV) plot
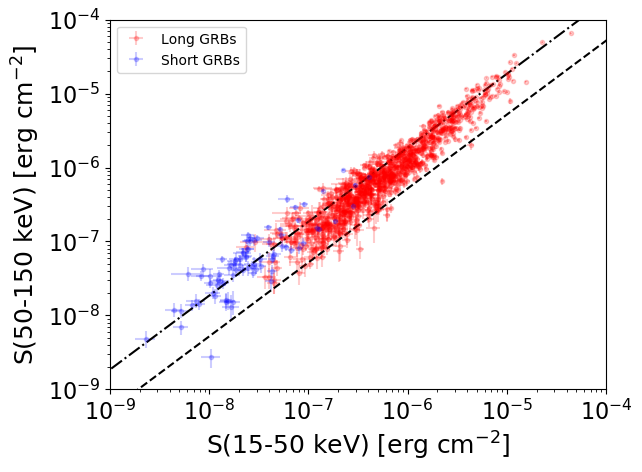
S(15-50 keV)  = N/A
S(50-150 keV) = N/A
The dash-dotted line and the dashed line traces the fluences calculated from the Band function with Epeak = 15 and 150 keV, respectively. Both lines assume a canonical values of alpha = -1 and beta = -2.5.
Mask shadow pattern
IMX = 3.092967542200852E-01, IMY = -5.048471485744995E-01
Spacecraft aspect plot
Bright source in the pre-burst/pre-slew/post-slew images
Pre-burst image of 15-350 keV band
Time interval of the image:
-239.616000 -12.064000

# RAcent  DECcent POSerr Theta    Phi  PeakCts   SNR AngSep     Name
#  [deg]    [deg]    ['] [deg]  [deg]                   [']
254.6082  35.5092   19.9  35.9  -58.8   0.2633   0.6   12.4	Her X-1
170.3157  20.0585    2.3  38.7  108.0   3.2172   5.0 ------	UNKNOWN
175.6816  37.4810    3.4  25.9  132.4   1.0206   3.3 ------	UNKNOWN
124.6323  70.0044    2.4  50.5 -167.9   3.2094   4.8 ------	UNKNOWN
285.5220  80.3518    3.0  48.0 -129.1   3.7916   3.9 ------	UNKNOWN
Pre-slew background subtracted image of 15-350 keV band
Time interval of the image:
-12.064000 37.084600

# RAcent  DECcent POSerr Theta    Phi  PeakCts   SNR AngSep     Name
#  [deg]    [deg]    ['] [deg]  [deg]                   [']
254.6327  35.3473   19.5  36.0  -58.6   0.0910   0.6    8.6	Her X-1
212.6712 -10.2159    2.6  50.8   33.5   2.1161   4.4 ------	UNKNOWN
198.5777  11.2632    0.5  30.6   58.5   3.2381  21.5 ------	UNKNOWN
252.9095  15.7759    2.2  45.3  -31.8   0.9122   5.1 ------	UNKNOWN
Post-slew image of 15-350 keV band
Time interval of the image:
100.484590 962.499400
975.384000 1065.454000

# RAcent  DECcent POSerr Theta    Phi  PeakCts   SNR AngSep     Name
#  [deg]    [deg]    ['] [deg]  [deg]                   [']
172.7442 -28.5471    3.5  47.0   40.5   7.1916   3.3 ------	UNKNOWN
159.6836  43.6352    2.8  46.6  150.2  11.8977   4.2 ------	UNKNOWN
240.7641  42.2066    2.6  48.0 -129.1  13.5417   4.5 ------	UNKNOWN